High-Latitude Molecular Clouds as -ray Sources for GLAST
Abstract
For about two decades, a population of relative small and nearby molecular clouds has been known to exist at high Galactic latitudes. Lying more than 10∘ from the Galactic plane, these clouds have typical distances of 150 pc, angular sizes of 1∘, and masses of order tens of solar masses. These objects are passive sources of high-energy -rays through cosmic ray-gas interactions. Using a new wide-angle CO survey of the northern sky, we show that typical high-latitude clouds are not bright enough in -rays to have been detected by EGRET, but that of order 100 of them will be detectable by the Large Area Telescope (LAT) on GLAST. Thus, we predict a new steady population of -ray sources at high Galactic latitudes, perhaps the most numerous after active galactic nuclei.
1 Introduction
The great majority of -ray point sources at high Galactic latitudes in the Third Energetic -ray Experiment Telescope (EGRET) catalog is active galactic nuclei (AGNs, Hartman et al. 1999). This is also the expectation for the sources that will be detected by the -ray Large Area Space Telescope (GLAST) mission, to be launched by NASA in early 2007. However, Punsly (1997) and Sowards-Emmerd et al. (2002; 2004), among others, have already noted that ascribing all EGRET detections at high latitudes to AGNs is not possible. Numerous other potential -ray sources at high latitudes have been suggested, including nearby starburst galaxies (e.g., Paglione et al. 1996), luminous infrared galaxies (Torres et al. 2004a; Torres 2004b), normal galaxies (e.g., Pavlidou & Fields 2001), clouds of baryonic dark matter in the Galactic halo (Walker et al. 2003), galaxy clusters (e.g., Reimer et al. 2003 and references therein), and radio galaxies (e.g. Mukherjee et al. 2002; Combi et al. 2003), but not all of them are viable (see the review by Torres 2004c).
In this Letter we show that another significant population of high-latitude -ray sources will be relevant for the next generation -ray telescopes: relatively small and nearby molecular clouds. The -ray fluxes from these objects depend only on their angular sizes and molecular column densities—quantities that can be inferred by CO surveys—and on the ambient cosmic ray (CR) spectrum. Since molecular clouds lie in such a thin layer (87 pc HWHM; Dame et al. 1987), nearly all clouds at will lie within 1 kpc of the Sun, and many will be much closer than that. We can therefore assume that the ambient CR spectrum is the same as that measured near the Earth. Using the instrumental characteristics of the Large Area Telescope (LAT) on GLAST, we estimate here that this instrument will be able to detect of order 100 high-latitude clouds. Since these clouds will be steady -ray sources, variability indices (Torres et al. 2001; Nolan et al. 2003) will be useful to distinguish them from AGNs.
The -ray emission from high-latitude clouds is of interest not only for what it can reveal about the masses of these objects and the local CR spectrum, but also as a potential source of confusion for identifying other types of -ray sources detected by the LAT. As was the case for EGRET, the study of the extragalactic sky with the LAT will require an accurate model for the diffuse -ray emission produced by CR interactions with the Galactic interstellar medium. Small molecular clouds not included in the diffuse model, or simply assigned incorrect column densities, might be interpreted as point sources. The lack of CO surveys over large areas of the high-latitude sky was not a serious problem for modeling the diffuse emission detected by EGRET (Bertsch et al. 1993, Hunter et al. 1997) because it was evident even from optical and far-infrared surveys that no molecular clouds large enough to be detected with the limited sensitivity and resolution of EGRET existed in these areas. Interpretation of the much more sensitive and higher angular resolution LAT survey will require a far more accurate accounting of the gamma rays from molecular gas at high latitudes.
2 Surveys of high-latitude clouds
The molecular gas at consists primarily of translucent clouds111Small molecular clouds are divided into three classes on the basis of their visual extinction and astrochemical properties (van Dishoeck & Black 1988): diffuse, translucent, and dark. Translucent clouds, the intermediate regime, have CO abundances in the range and column densities greater than cm-2. Different from dark clouds, where the chemistry is driven by collisional processes, translucent clouds are still dominated by photoprocesses. It is in this translucent regime where most of the carbon becomes molecular, and so they are detectable in CO, but are relatively optically thin – and thus their name – exhibiting low optical extinctions. , although a few more massive objects are found in this region, most notably the giant molecular cloud in Orion (Wilson et al. 2004), the Polaris Flare222A large molecular cloud with a mass of 5500 M⊙ at a distance of pc (Meyerdierks & Heithausen 1996 and references therein); its -ray emission was analyzed by Digel et al. (1996). and the dark clouds in Taurus (Ungerechts & Thaddeus 1987) and Ophiuchus (de Geus et al. 1990).
The first large-scale search for high-latitude molecular clouds was carried out by Magnani, Blitz & Mundy (MBM, 1985), who surveyed CO toward regions of optical obscuration on the Palomar Observatory Sky Survey plates. MBM reported finding 57 clouds in 35 complexes at , distributed asymmetrically with respect to the Galactic plane, at typical distances of 100 pc. More clouds were found in the southern Galactic hemisphere than in the north, a fact interpreted as a displacement of the position of the Sun from the midplane of the Galaxy. This work was updated by Magnani, Hartmann & Speck (MHS, 1996), who compiled a catalog of molecular clouds at high Galactic latitudes consisting of 120 members.
Table 3 of MHS details the average properties of the clouds in their catalog. The distances range from 60 to 350 pc, with a typical value around 150 pc, whereas the masses range from (0.1) to (100) M⊙. The mean values for mass and H2 density are 40 M⊙ (46 M⊙ if the Polaris flare is included) and 140 cm-3, respectively. The scale height inferred from the velocity dispersion of the clouds was 124 pc and the average solid angle per cloud was 0.8 square degrees. The filling fraction of the sample, averaged over the whole sky at , is .
More complete surveys in CO have been conducted both for the northern (Hartmann et al. 1998) and southern (Magnani et al. 2000) Galactic hemispheres at , although the gridding of the searches was still coarse (about 1∘) and allowed for some clouds to be missed (see below). In the northern hemisphere, only 2 molecular clouds previously unknown were found. In contrast, 58 new detections were reported in the southern hemisphere survey, and another 75 were found to be related with 26 previously catalogued clouds situated within the survey boundaries. Using the southern survey, the filling factor of molecular gas was found to be 0.03, an order of magnitude larger than that reported using the survey of the northern hemisphere. Average results concerning masses, densities, and distances were not significantly different from those of MBM.
Over the past 3 years, the Galactic CO ( = 1–0) survey of Dame, Hartmann, & Thaddeus (2001; hereafter DHT) has been extended with the CfA 1.2 meter telescope to cover all of the area at and () with a sampling interval of 1/4∘ or better (Dame & Thaddeus 2004). These new observations have found more than 200 relatively small and isolated molecular clouds more than from the plane. Since this new survey covers a large fraction of the Galaxy with a resolution and sensitivity to molecular clouds that exceeds that of the LAT, we will use it in Section 4 to estimate the total number of high-latitude clouds that the LAT will detect.
3 -ray emission from clouds and detectability
With a cloud considered as a passive target for CR interactions, the hadronically-generated -ray number luminosity (photons per unit time) can be computed as (see, e.g., Aharonian 2001, Torres et al. 2003) where represents the position within the interaction region , is the mass of gas, is the proton mass, is the number density, and is the -ray emissivity (photons per unit of time per atom). The -ray flux is then , where is the distance to the cloud. In an appropriate scaling, the flux is where is the enhancement factor of CRs. The numerical factor takes into account electron bremsstrahlung (see, e.g., Pavlidou & Fields 2001). For local high-latitude clouds, we assume no enhancement, , so that the CR spectrum is the same as the proton flux measured in the neighborhood of the Earth.
The molecular masses of each cloud can be estimated under the usual assumption of a proportionality between the velocity-integrated CO intensity and the H2 column density, , . We use the value cm-2 (K km s, derived from an intercomparison of large-scale far-infrared, 21 cm, and CO surveys (DHT).333Recently, Magnani et al. (2003), although favoring the use of the -factor for population analyses like ours, provided evidence that in translucent clouds, CO is not a linear tracer of the column density of molecular hydrogen. They showed that for at least one cloud, the CO/H2 ratio varies as a function of the molecular hydrogen column density. Magnani et al. (2003) proposed to use CH observations to calibrate the CO-to-H2 conversion factor. Given the fact that these observations are not available for all clouds (not even for a significant fraction of them) we continue using the standard approach. The value of is uncertain for translucent clouds: other works have adopted values that are either larger or smaller, by at least a factor of 2 than the value adopted here (e.g., de Vries, Heithausen & Thaddeus 1987; Magnani & Onello 1995, Hartmann et al. 1998). Thus, the mass estimate should perhaps be considered uncertain by a comparable factor.
Expressed in terms of its integrated intensity in the CO line, , the mass of molecular hydrogen is (Dame et al. 1986). The factor 860 incorporates the value of assumed in this paper; the correction for the contributions from helium and heavier elements is removed here, because the -ray emissivity that we use (see below) already corrects for their contributions to the overall cross sections by relative abundance. Note that since the -ray flux from a cloud scales as and scales as , the -ray flux is linearly proportional to , which is a directly observable quantity.
In estimating cloud masses, we do not include atomic hydrogen associated with the molecular gas. The atomic gas is typically more smoothly distributed than the molecular gas on angular scales of degrees. Effectively we are considering the diffuse -ray emission from the pervasive atomic hydrogen as part of the Galactic background against which the molecular clouds are detected.
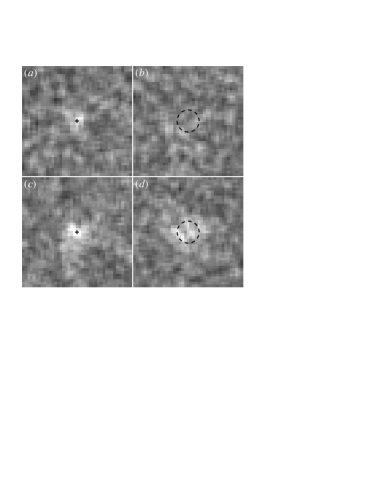
In order to determine which clouds the LAT will be able to detect and spatially resolve, we simulated observations of idealized, disk-shaped sources against an isotropic background that includes contributions from the extragalactic sky as well as cosmic-ray interactions in Galactic H I and inverse Compton scattering of the interstellar radiation field. The background intensity was cm-2 s-1 sr-1, MeV, photon spectral index ), typical of the Milky Way at high latitude. We simulated a 1-year sky survey of the sort planned for the first year after instrument checkout. These simulations are shown in Figure 1. The sources were assumed to have a spectrum consistent with the local -ray emissivity (primarily from decay in the range 100 MeV, Bertsch et al. 1993). Preliminary response functions for the LAT, consistent with the performance requirements (GLAST Science Requirements Doc. 2003), were used. The actual limits and angular sizes can be expected to change somewhat when final response functions become available.
As Figure 1 illustrates, the criterion for detectability by the LAT cannot be based solely on expected flux. For faint extended -ray sources, detectability by the LAT will depend rather strongly on angular size (see below).
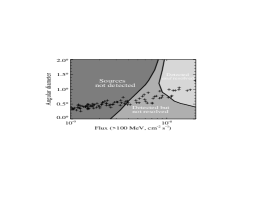
In the following we use ‘resolve’ to mean determine to 5 or better that the source is inconsistent with being point-like. Resolving a source requires better statistics (i.e., more -rays) than detecting it; thus the flux limit for detecting a source is lower than the limit for resolving it. Again using simulations with disk-shaped clouds that have -ray spectra consistent with the local emissivity, we mapped the regions of detectability and resolvability in the flux-angular size plane. The result is shown in Figure 2, where we have also overlaid all of the molecular clouds in the range detected by the recently-extended DHT survey (see Section 4).
Sources in the lightest shaded region of Figure 2 are both detectable and resolvable, i.e., distinguishable from point sources. In the intermediate shaded region sources are detectable but not distinguishable from point sources. Even if the expected location, extent, and shape of a source (disks in the case of the simulations) are known, if it lies within this region it is indistinguishable from a point source. Figure 2 indicates that at high latitudes a molecular cloud with flux as great as twice the detection limit for small clouds will not be detectable if its angular diameter, , is greater than 1∘. Conversely, many of the clouds that are detectable will not be resolvable (i.e., not distinguishable from point sources). In particular any detectable cloud with flux less than 8 cm-2 s-1 (100 MeV) will not be resolvable.
Resolving a cloud of course unambiguously establishes it as a diffuse source. The diffuse nature of the clouds might also be inferred from variability studies – they should be steady – or from their relatively soft spectra at high energies (the local -ray emissivity falling as in the GeV range). However, variability and spectral studies for faint sources such as these small clouds will not be particularly constraining. We expect that many of these -ray sources would be unidentified if they were not already cataloged as molecular clouds.
4 The total number of LAT-detectable clouds
In this section we use the CfA Galactic CO survey, including the recent large extension by Dame & Thaddeus (2004), to estimate the total number of clouds at that will be detected by the LAT, and the number of these that will be resolved. We generated a velocity-integrated CO map from the survey using the masked-moment method described in DHT. Defining individual clouds as isolated regions of statistically significant emission, we derived a catalog of 232 clouds in the region (, ) with ranging from 0.09 to 1418 . The minimum value corresponds to a -ray flux of (see Sec. 3), which as Figure 2 shows is well below the detection threshold for the LAT; the corresponding mass is at 150 pc. The fluxes and angular diameters of the clouds are indicated in Figure 2 as crosses. Many of the cataloged clouds lie below the flux range of the figure and 20 lie above it (see below).
This catalog certainly contains all clouds in the survey area that might be detectable by the LAT, and it covers such a large range of Galactic longitude and latitude that the total number of clouds—or the number in any given range of or size—can be reliably extrapolated to the whole sky at . The number of cataloged clouds per unit solid angle closely follows a cosecant dependence on latitude, as expected for clouds in a plane-parallel layer. On the assumption that this dependence extends to latitude and that there is no systematic dependence on longitude, the extrapolation factor from the survey area to the whole sky at is 2.8.
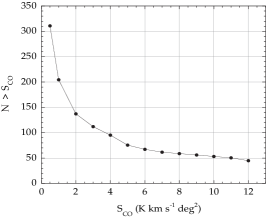
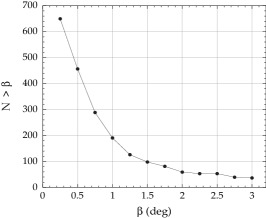
As noted above, under the assumption of a uniform local CR flux and the -ratio of DHT, the detectability of a local molecular cloud by the LAT depends on its total CO flux and its angular size . Figure 2 shows the total number of clouds as a function of minimum , extrapolated from the survey area to the whole sky at . Figure 2 shows the same for cloud angular diameters.
A total of 53 clouds in the survey area are expected to be detectable by the LAT; this extrapolates to 143 such clouds over the whole sky at . (Figure 2 does not show the 20 with the greatest fluxes and diameters, which are sparsely distributed outside the range of the plot.) A smaller but still significant number of clouds will not only be detected but also resolved: 30 over the survey area or 78 over the whole sky at . Since many clouds at high latitude cluster into larger associations that follow HI filaments or shells (Gir, Blitz, & Magnani 1994; see also Yamamoto et al. 2003), some otherwise undetectable small clouds likely will form larger structures that will be resolved by the LAT.
5 Concluding remarks
It is important to understand and to account for the -ray flux from high-latitude molecular clouds both as individual sources and as contributors to the diffuse background. Unlike the proposed associations between low-latitude EGRET sources and clouds adjacent to supernova remnants (e.g., Romero et al. 1999), local high-latitude clouds are passive targets for CR interactions. Except for those those lying very close to stellar OB associations (Bhat 2000), we expect them to be subject to the same CR spectrum as that found locally.
Detecting these clouds will provide information on the local CR spectrum, particularly in cases where the cloud distance is well determined (e.g., Luhman 2001, Grant & Burrows 1999). In addition, if as was done with EGRET observations at low latitudes, H I data are used to calibrate the -ray emissivity, comparison of cloud -ray fluxes with CO luminosities will provide not only a calibration of the -factor, but also information on possible variations of with cloud properties or Galactic location.
The present results underscore the need for continued large-scale mapping of CO at medium and high Galactic latitudes. Only in the mid-latitude region analyzed here (, ; Dame & Thaddeus 2004) can we claim that most LAT-detectable clouds have been found, and even in this region more finely-sampled CO maps are required to accurately determine cloud sizes and masses. In the southern Galaxy CO observations more than a few degrees from the plane are still extremely sparse.
While the analysis regarding detectability/resolvability presented here (see Figure 1) is applicable to all possible -ray sources, our investigation shows that nearby molecular clouds may in fact be the most numerous population of sources other than that of blazars that the LAT will detect at high latitudes.
Acknowledgments
The work of DFT was performed under the auspices of the U.S. DOE by UC’s LLNL under contract No. W-7405-Eng-48, and it was in part done while visiting the Institut de Física d’Altes Energies, Spain. He acknowledges its hospitality.
References
- (1) Aharonian F. 2001, Space Science Reviews 99, 187
- (2) Bertsch, D. L., et al. 1993, ApJ, 416, 587
- (3) Bhatt H. C. 2000, A&A 362, 715
- (4) Combi J.A., Romero G.E., Paredes J.M., Torres D.F. & Ribó M. 2003, ApJ 588, 731
- (5) Dame T. M., et al. 1986, ApJ, 305, 892
- (6) Dame T. M., et al. 1987, ApJ 322, 706
- (7) Dame T. M., Hartmann D., & Thaddeus P. 2001, ApJ 547, 792
- (8) Dame T. M. & Thaddeus P. 2004, in ”Milky Way Surveys: The structure and Evolution of our Galaxy”, ASP Conference Series, to be published.
- (9) de Geus, E. J., Bronfman, L., & Thaddeus, P. 1990, A&A 231, 137
- (10) de Vries H. W., Heithausen A. & Thaddeus P. 1987, ApJ 319, 723
- (11) Digel S. W., Grenier I. A., Heithausen A., Hunter S. D. & Thaddeus P. 1996 ApJ 463, 609
- (12) Hartmann, D. & Burton, W. B. 1997, Cambridge; New York: Cambridge University Press, ISBN 0521471117
- (13) Hartmann D., Magnani L. & Thaddeus P. 1998, ApJ 492, 205
- (14) Hunter, S. D., et al. 1997, ApJ, 481, 205
- (15) Gir, B.-Y., Blitz, L., & Magnani, L. 1994, ApJ, 434, 162
- (16) GLAST Science Requirements Document, 433-SRD-0001, NASA Goddard Space Flight Center, CH-03, 2003, http://glast.gsfc.nasa.gov/project/cm/mcdl
- (17) Grant C. E. & Burrows D. N. 1999, ApJ 516, 243
- (18) Luhman K. L. 2001, ApJ 560, 287
- (19) Magnani L., Lada E. & Blitz L. 1986, ApJ 301, 395
- (20) Magnani L., Blitz L. & Mundy L. (MBM) 1985, ApJ 295, 402
- (21) Magnani L. & Onello J. S. 1995, ApJ 443, 169
- (22) Magnani L., Hartmann D. & Speck B. G. (MHS) 1996, ApJ 106, 447
- (23) Magnani L., Hartmann D., Holcomb S. L., Smith L. E. & Thaddeus P. 2000, ApJ 535, 167
- (24) Magnani L., et al. 2003, ApJ 586, 1111
- (25) Meyerdierks H. & Heithausen A. 1996, A&A 313, 929
- (26) Mukherjee R., et al. 2002, ApJ 574, 693
- (27) Nolan P., Tompkins W., Grenier I. & Michelson P. 2003, ApJ, 597, 615
- (28) Pavlidou, V. & Fields, B. D. 2001, ApJ 558, 63
- (29) Punsly B. 1997, AJ 114, 544
- (30) Paglione T. A. D., Marscher A. P., Jackson J. M. & Bertsch D. L. 1996, ApJ 460, 295
- (31) Reimer O., et al. 2003, ApJ 588, 155
- (32) Romero G. E., Benaglia P. & Torres D. F. 1999, A&A 348, 868
- (33) Sowards-Emmerd D., Romani R. W. & Michelson P. F. 2003, ApJ 590, 109
- (34) Sowards-Emmerd D., Romani R. W., Michelson P. F. & Ulvestad J. S. 2004, ApJ 609, 564
- (35) Torres D. F., Romero G. E., Combi J. A., Benaglia P., Andernach H. & Punsly B. 2001, A&A 370, 468
- (36) Torres D. F., Romero G. E., Dame T. M., Combi J. A. & Butt Y. M. 2003, Physics Reports 382, 303
- (37) Torres D. F., Reimer O., Domingo-Santamaría E. & Digel S. 2004a, ApJ 607, L99
- (38) Torres D. F. 2004b, ApJ 617, 966
- (39) Torres D. F. 2004c, ’-ray Sources at High Galactic Latitudes’, in Cosmic -ray Sources, edited by K. S. Cheng and G. E. Romero, Kluwer Academic Press, in press. arXiv:astro-ph/0308069.
- (40) Ungerechts, H. & Thaddeus, P. 1987, ApJS 63, 645
- (41) van Dishoek E. F. & Black J. N. 1988, ApJ 334, 771
- (42) Walker M., Oshishi M. & Mori M. ApJ 589, 810
- (43) Wilson, B. A., Dame, T. M., Masheder, M. R. W., & Thaddeus, P. 2004, A&A, in press (astro-ph/0411089).
- (44) Yamamoto H., Onishi T., Mizuno A. & Fukui Y. 2003, ApJ 592, 217