A Chandra Study of the Multi-Component X-ray Emission from the X-shaped Radio Galaxy 3C 403
Abstract
We present results from a 49.4 ks Chandra/ACIS-S observation of the nearby (=0.059) X-shaped FRII radio galaxy 3C 403. This is the first Chandra observation of an X-shaped radio galaxy, and one of the goals of this pioneering study is to determine the relationship between the X-ray emitting gas and the X-shaped radio morphology. We find that the X-ray isophotes of the hot gas within 3.5′′ of the central galaxy are highly elliptical (eccentricity0.57) and co-aligned with the elliptical optical isophotes. This supports the hypothesis that X-shaped radio sources are created by propagation of jets through asymmetric density distributions. Within large uncertainties, there is no evidence that the lobes or wings are overpressurized relative to the ISM, supporting the scenario in which the wings are the result of strong backflow of material from the jet head and subsequent buoyant evolution. We have detected X-ray emission from several of the radio knots to the E of the active nucleus, and diffuse emission from the radio lobe to the W. The X-ray emission from the eastern knots cannot be explained by an inverse Compton model unless they are far from equipartition. Using archival HST data, optical emission is detected from two knots, and the radio/optical/X-ray spectra are well fitted by simple synchrotron models. This is one of the strongest examples to date of X-ray synchrotron emission from multiple knots in the jet of an FR II radio galaxy. X-ray emission is also detected from the radio wings at a flux consistent with inverse Compton scattering of CMB photons from relativistic electrons if the wings are near equipartition. The nuclear spectrum is well described by a multi-component model that includes a heavily absorbed power law (41023 cm-2) and a bright (EW244 eV), broadened Fe line. A second, less absorbed, power-law component, likely to represent unresolved emission from a pc-scale jet, is also required.
1 Introduction
Approximately 10% of the FRII radio galaxies in the 3CRR catalog are classified as ‘X-shaped’ or ’winged’ because of their unusual radio morphologies (Leahy & Williams, 1984). These radio galaxies have two pairs of misaligned radio lobes of approximately equal linear extent. They also tend to have low radio luminosities, typically lying near the FRI/FRII division. There are two general hypotheses about the nature and origin of these structures. On the one hand, it has been argued that the X-shaped morphology is essentially a hydrodynamic phenomenon which is the result of supersonic or buoyant flow of radio plasma in an asymmetric gas distribution. Leahy & Williams (1984) and Worrall, Birkinshaw, & Cameron (1995) argued that the X-shaped radio morphology is a result of the result of strong backflow of material behind the terminal hot spots of radio galaxy jets and subsequent buoyant evolution of the ’wings’. Capetti et al. (2002) hypothesized that the X-shaped morphology is the direct result of the supersonic expansion/inflation of the lobe into an elliptical atmosphere, and that all radio galaxies in such environments should exhibit this phenomenon. On the other hand, it has been argued that this structure results from precession or reorientation of the jet axis, possibly as a result of a galaxy interaction and/or merger event of two supermassive black holes (Ekers et al., 1978; Gopal-Krishna, Biermann, & Wiita, 2003; Dennett-Thorpe et al., 2002). In this scenario, the ’wings’ represent the remnant lobe of an earlier epoch of nuclear activity, and only the primary ’jet/lobe’ is currently being powered by the nuclear outflow. This latter scenario has generated particular interest recently because it implies that these galaxies may be strong sources of gravitational radiation (Merritt & Ekers, 2002).
The sensitivity of Chandra and XMM-Newton has been a crucial factor in making progress in the study of the gaseous environments of the radio galaxies and better understanding issues related to the dynamics of the radio structures. In addition to emission from the thermal coronae, Chandra and XMM-Newton observations of radio galaxies have detected dozens of examples of non-thermal X-ray emission from their jets and hotspots. The standard paradigm suggests that the X-ray emission observed from these features has different origins depending on the power of the radio galaxy. The X-ray emission from the knots of jets of FR I radio galaxies are generally attributed to synchrotron emission from a population of ultra-relativistic electrons (Worrall, Birkinshaw, & Hardcastle, 2001). This conclusion is supported by several pieces of evidence including their broad-band spectra. Well studied examples include Centaurus A (Kraft et al., 2002; Hardcastle et al., 2003), M87 (Marshall et al., 2002), and 3C 66B (Hardcastle, Birkinshaw, & Worrall, 2001). On the other hand, inverse-Compton scattering of seed photons by relativistic electrons is generally believed to be responsible for the X-ray emission from jets (Tavecchio et al., 2000; Sambruna et al., 2001) and hotspots (Hardcastle et al., 2004) of the more powerful FRII sources. Well known hotspot examples include Cygnus A (Carilli, Perley, & Harris, 1994) and 3C 295 (Harris et al., 2000). To date, only two examples of X-ray emission from FR II hotspots have been attributed to synchrotron emission, 3C 390.3 (Harris et al., 1998) and Pictor A (Wilson, Young, & Shopbell, 2001), although Hardcastle et al. (2004) argue that the X-ray emission from a large number of low power hotspots is at least partly synchrotron in origin.
3C 403 is the nearest X-shaped radio galaxy in the 3CRR catalog (Laing, Riley, & Longair, 1983), and is an ideal target to study the X-shaped phenomenon. In this paper we present results from a Chandra observation of this radio galaxy. We use archival VLA and HST observations to make a multi-frequency study of the various components. We have resolved X-ray emission from four distinct components: the bright active nucleus, the hot ISM, several compact radio components, and diffuse X-ray emission coincident with the radio lobes. This is the first high-resolution X-ray observation of an X-shaped radio galaxy and the primary goal of this observation was to study the ambient ISM confining the radio emitting components. In addition, the non-thermal X-ray emission that we detect from several of the compact radio components allows us to draw strong conclusions regarding their emission mechanisms.
This paper is organized as follows. Section two contains a brief description of the data, an observation log, and a summary of our analysis. In section three, we discuss the emission from the hot ISM and nucleus, and we describe how we have separated these components spatially and spectrally. In section four, we discuss the non-thermal X-ray emission associated with the radio hotspots and lobes. The nature of X-shaped radio galaxies and the implications of our results are discussed in section five. The final section contains a brief summary and conclusion. Throughout this paper, we assume the WMAP cosmology (=71, =0.27, =0.73), so that the measured redshift of the host galaxy () corresponds to a luminosity distance of 260.6 Mpc, and 1′′ = 1.127 kpc.
2 Observations
The radio galaxy 3C 403 was observed for 49470 s with the Chandra/ACIS-S instrument (OBSID 2968) in faint mode on December 12, 2002. The nucleus of the galaxy was located at the best focus. The lightcurve of events in the 5.0-10.0 keV bandpass on the entire S3 chip, excluding the nucleus and any other point sources visible by eye, was created using 259 s bins and examined for periods of flaring background. Intervals where the rate was more than 3 above the mean rate were removed. The mean rate with periods of flaring removed is consistent with the nominal quiescent ACIS-S background listed in the Proposer’s Observation Guide. A total of 4600 s of data was excluded, leaving 44870 s of good time. Bad pixels, hot columns, and columns along node boundaries were also removed. This galaxy is located at relatively low Galactic latitude (, ), so the nominal blank sky background files generated from deep, high Galactic latitude observations are not appropriate. Fortunately the radio galaxy covers only a small region of the S3 chip, so that local background for spectral analysis was estimated from a large region on the S3 chip north of the source. Absorption by foreground gas in our galaxy (=1.541021 cm-2) was included in all spectral fits.
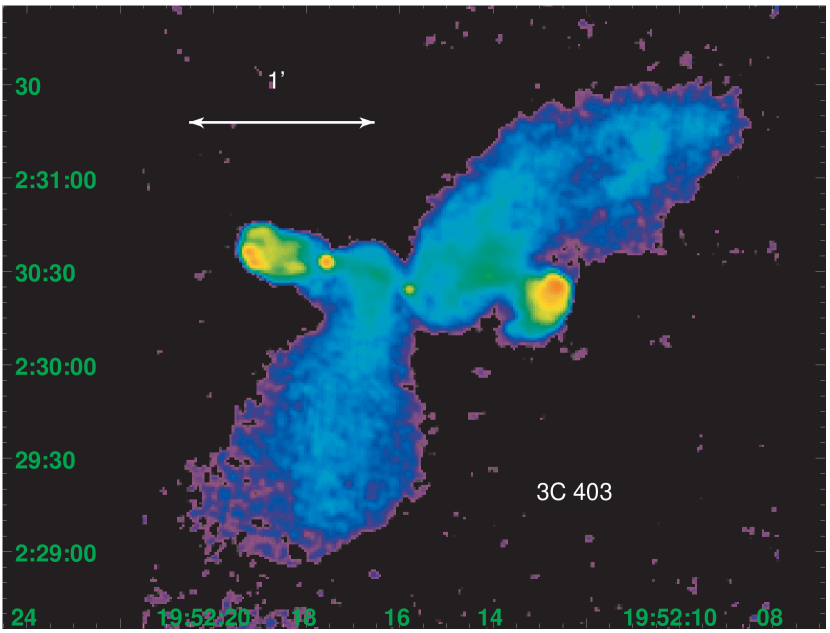
We have combined data from our Chandra/ACIS-S observation with archival VLA observations (1.48 and 8.4 GHz) and an HST observation to make a multi-frequency study of various components. Detailed discussions of the 1.48 and 8.4 GHz VLA data have been presented in Dennett-Thorpe et al. (2002) and Black et al. (1992), respectively. We will use the nomenclature of the Black et al. (1992) throughout this paper when referring to specific knots or radio features. An 8.4 GHz radio map of this radio galaxy is shown in Figure 1. The primary lobes can be seen to the E and W of the central nucleus. The lower surface brightness ‘wings’ that give this object its X-shaped morphology extend to the N and S. Several hotspots can be seen in the eastern lobe, and perhaps a hint of a jet between the nucleus and knot F6. The X-ray and radio positions of the active nucleus agree to 0.5′′. This radio galaxy was also observed for 280 s with the HST/WFPC2 instrument in 1995 as part of the HST 3CR snapshot survey using the F702W filter (pivot wavelength of 6919 Å) (Martel et al., 1999). We obtained the reprocessed data from the HST archive and used the IRAF synphot package to apply photometric calibrations. The fluxes were reddening-corrected using the dust maps of Schlegel, Finkbeiner, & Davis (1998).
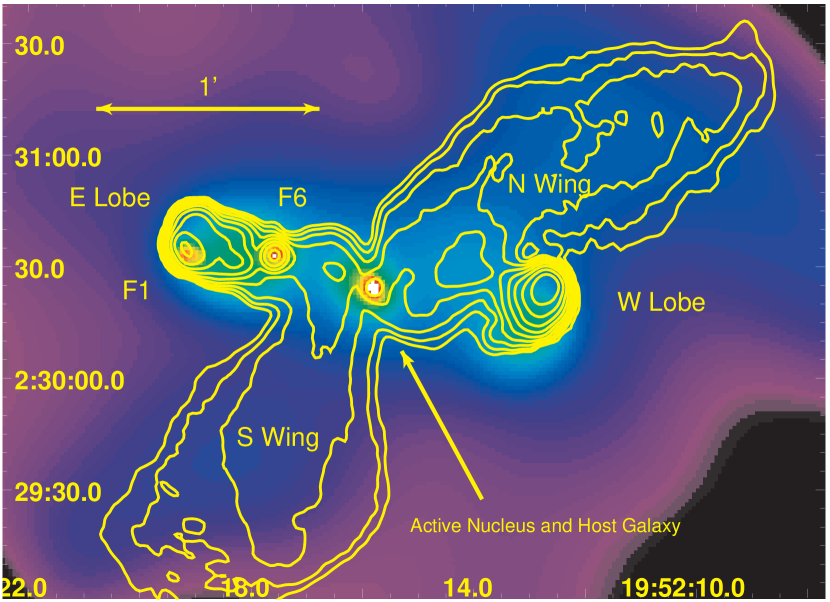
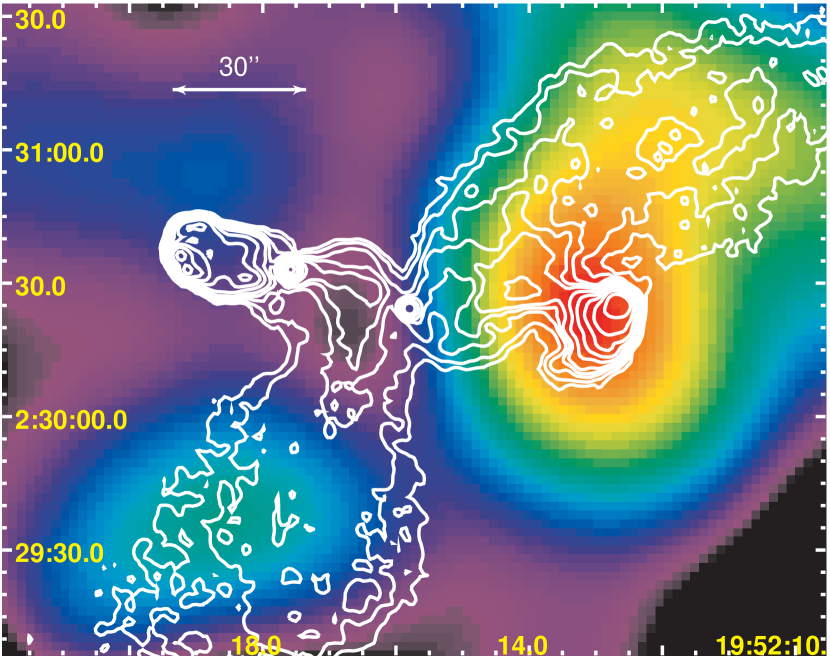
An adaptively smoothed, exposure corrected, background subtracted X-ray image in the 0.5-2.0 keV bandpass with 8.4 GHz radio contours overlaid is shown in Figure 2. X-ray emission is detected from at least four distinct components: the active nucleus, the hot gas of the host galaxy, several of the radio hot spots, and diffuse emission from the lobes and the wings.
3 Hot ISM and Nucleus
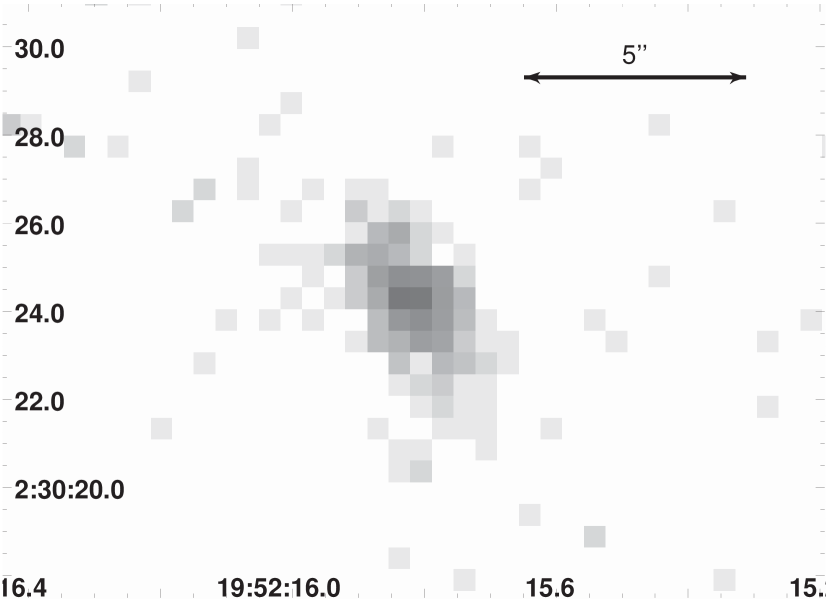
A raw X-ray image in the 0.5-2.0 keV bandpass of the central region (2014′′), including the hot ISM and the active nucleus, is shown in Figure 3. The point source at the center is the AGN, and the extensions to the NE and SW are the hot ISM. The morphology of the ISM is highly elliptic, and co-aligned with, but more eccentric than, the optical isophotes of the stellar light distribution (Capetti et al., 2002). We wish to separate the emission of the hot ISM from that of the active nucleus in order to study each component separately. Unfortunately, these components are not well separated spatially. The major and minor axes of the ISM shown in Figure 3 are approximately 7.5′′ and 3.0′′ in length, respectively. The 90% encircled energy radius for a point source on-axis at 1.49 keV is 0.9′′. We have used images in four X-ray bands to guide our spectral analysis in order to separate the emission from the two components. An examination of images in the 0.5-0.7, 0.7-1.0, 1.0-1.5, and 1.5-2.0 keV bands showed that above 1 keV, most of the emission is unresolved and is probably due to the active nucleus. Below 0.7 keV, the contribution from the central point source is small, and most or all of the emission is from the ISM.
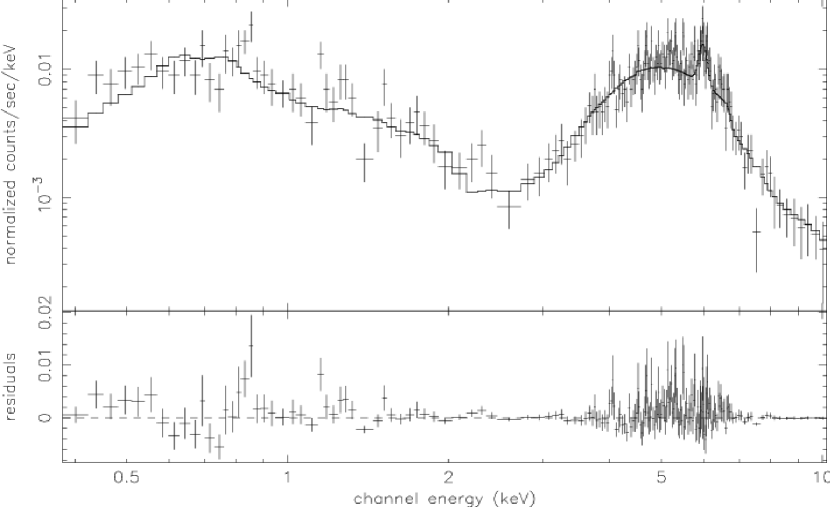
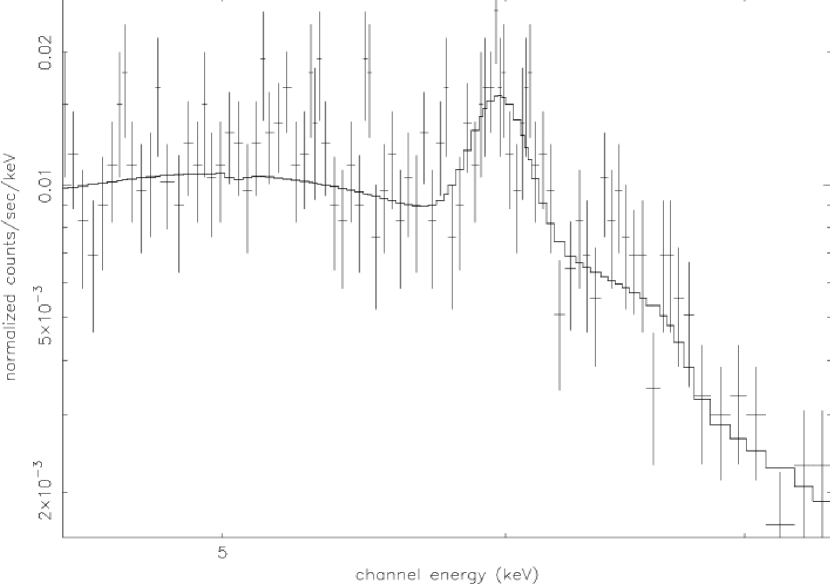
We extracted the spectrum, shown in Figure 4, from a 7.5′′ radius circular region centered on the nucleus. The data have been binned to a minimum of 10 counts per bin, and the background was determined from a large region on the S3 chip approximately 4′ to the N of the nucleus, well removed from any detectable emission from the galaxy. The spectrum consists of two peaks: one centered at 0.7 keV with a high energy tail, and a second that peaks at around 5 keV. The count rate in the 0.25-10.0 keV band was 4.710-2 cts s-1. The majority of the counts in this spectrum are from the unresolved active nucleus. This suggests that this spectrum moderately suffers from the effects of pile-up. Based on Figure 6.19 of the Chandra Proposer’s Observatory Guide (POG), we estimate a pile-up fraction of 5%. We note that we fitted the data using coarser binning (25 and 50 counts per bin) to ensure the applicability of Gaussian statistics and find statistically identical parameter values and uncertainties.
We initially modeled the spectrum with a three-component model including a heavily absorbed (1023 cm-2) power law, an Fe line with variable centroid and width, and an APEC model. The effect of the pile-up was modeled by using the XSPEC function ‘pileup’ (Davis, 2001), and Galactic absorption (=1.541021 cm-2) was included in all fits. For simplicity, the elemental abundance of the APEC model was fixed at 1.0 times Solar, typical of the central regions of early-type galaxies. If allowed to vary freely, the elemental abundance was poorly constrained. At the relatively low best-fit temperature (0.3 keV), the emission is line dominated, and the elemental abundance can be traded against the normalization. The radiative cooling function, , scales nearly linearly with abundance at these temperatures and abundances. None of our conclusions below are sensitive to this choice, although a larger elemental abundance would reduce our estimates of the gas density below ().
In this scenario, the power law represents emission from the AGN, and the APEC model the emission from the hot ISM. We could not obtain an acceptable fit with this three component model as there were large residuals between 1 and 2 keV. Inspection of images in the 1-2 keV band suggests that most of the emission in this band is is due to the unresolved AGN. We therefore added a second, less absorbed power law to the model and were able to obtain an acceptable fit. An examination of the images in several bands (described above) suggests that this second power law is heavily absorbed. We fixed the absorption and spectral index of this second power law to 41021 cm-2 and 2.0 respectively to minimize the number of free parameters; only the normalization of this component was allowed to vary freely. The choice of a spectral index that is steeper than that of the primary absorbed power law and the choice of the value of constrain this component to contribute little above and below the 1-2 keV band. The best-fit model has been overlaid onto Figure 4. The data and model around the Fe K line is more clearly shown in Figure 5. The best-fit values of the parameters and 90% confidence intervals are summarized in Table 1.
3.1 ISM
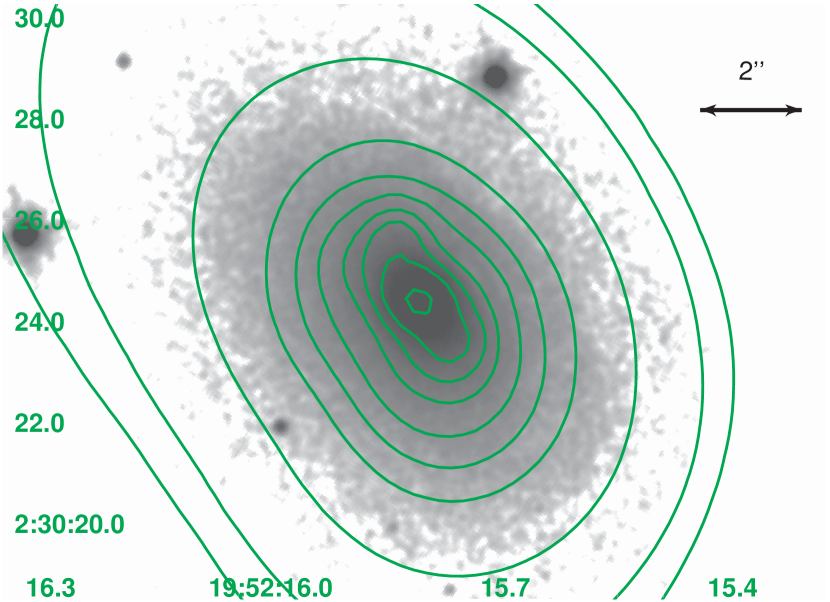
The morphology of the X-ray emission of the central region of the hot ISM is highly elliptical and co-aligned with the optical isophotes of the host galaxy. We have overplotted the contours from an adaptively smoothed X-ray image in the 0.5-2.0 keV band onto an HST/WFPC2 image of the host galaxy as shown in Figure 6. The position angle of the diffuse emission is not aligned with the primary E/W radio components, and is almost perpendicular to the N and S radio wings. The spatial relationship between the lobes, the wings, and the ISM, at least near the nucleus, is qualitatively what we would expect in the buoyancy/backflow model. Based on the spectral analysis above, the unabsorbed X-ray luminosity of the ISM within 8.5 kpc of the nucleus is 2.91041 ergs s-1 in the 0.25-10.0 keV bandpass. This X-ray luminosity is at the high end of the versus relationship derived from observations of large samples of elliptical galaxies in Canizares, Fabbiano, & Trinchieri (1987) and O’Sullivan, Forbes, & Ponman (2001). The temperature of the gas in this central region is 0.3 keV, rather low for a massive elliptical galaxy, perhaps indicative of a cooling flow.
We fitted an elliptical -model plus constant background to an X-ray image of the central 5′′ of the galaxy in the 0.3-1.0 keV bandpass using the Sherpa software package in order to characterize quantitatively the morphology of this emission. As demonstrated above, the contribution from the nucleus in this band is small. The free parameters of this model were , the scale parameter , the normalization, the ellipticity, , the position angle of the major axis of the ellipse, , and the background, . The telescope PSF was computed using the CIAO program mkpsf to remove the instrumental response. Both and were well constrained, with =0.570.04 and =442∘ (measured East of North). The uncertainties are at 90% confidence. Based on the spectral analysis described above, the 0.3-1.0 keV band contains little emission from the active nucleus. The parameters and were poorly constrained, but 0.5 and 3′′ (3.5 kpc). Using nominal values of =0.55 and =0.6′′, the central proton density, , is 1.14 cm-3 for the best-fit spectrum described above. The values of and are somewhat smaller and larger, respectively, than typically observed in elliptical galaxies, although it is not uncommon to find small scale, dense cores in the ISM at the centers of radio galaxies (Hardcastle et al., 2002). The cooling time of this material is very short, 107 years, because of the high density and relatively low temperature. The cooling time is insensitive to the adopted abundance, since a metal abundance higher than we have assumed (1.0 times the Solar value) would decrease the central density but increase the cooling time (the cooling time scales roughly as Z-1/2).
On the kpc scale, the X-ray morphology, and presumably the density and pressure profiles, are highly elliptical (=0.57). In contrast, the ellipticity of the stellar light profile is only 0.25 at 6.9′′ (the effective radius of the de Vaucouleurs profile for the host of 3C 403) from the nucleus (Govoni et al., 2000). We have detected X-ray emission to only half this distance along the semi-major axis, but an examination of the central 3′′ of the HST images clearly shows that the stellar distribution has a roughly constant ellipticity (0.25) down to about 1′′, where the distribution becomes circular. The distribution of the gas is therefore more elliptical than that of stars. In the central 10-15 kpc of a elliptical galaxies, the stellar mass typically dominates the dark matter so the gravitational potential should be determined by the distribution of the former. If the gas is in hydrostatic equilibrium with the gravitating matter, we expect that the ellipticity of the gas and that of the gravitating matter should be similar, but in fact this is not the case in 3C 403.
We suggest two possible explanations for this. The first, and most likely in our view, is that the gas is not in hydrostatic equilibrium. The cooling time of this gas is less than 107 years, roughly the same age as the radio lobes. It is plausible that the gas is cooling and falling in toward the center. The inflation of the radio lobe may have disrupted the central region as well. If the gas is moving, it may well have a different morphology than the gravitating matter. As an alternative, it is possible that the emission which we have been attributing to the ISM is, in fact, due to a partially resolved kiloparsec scale jet. We consider this unlikely for two reasons. First, there is no evidence for any radio counterpart to this emission. The X-ray to radio spectrum would have to be unusually flat. Second, the axis of this hypothetical kpc scale jet is not aligned with the larger scale, tens of kpc radio features, which implies that the jet has been sharply bent.
On larger (tens of kpc) scales, the data are not of sufficient quality for us to determine whether the gas distribution remains elliptical at or beyond the boundaries of the wings and lobes. We can, however, address the simpler question of whether the radio wings are greatly overpressurized relative to the ambient medium. There is statistically significant emission above background out to about 50′′ from the nucleus, although the profile of the emission is poorly constrained. This could represent emission associated with a group of galaxies for which the optical host of 3C 403 is the dominant member. The surface brightness profile of the gas from the core to 50′′ cannot be described by a single -profile, however. Given the small core radius and high density of the emission in the central region, it is not reasonable simply to extrapolate this to larger radii to estimate the gas pressure for a comparison with the pressure of the lobes and the wings. For simplicity, and because it would be difficult to maintain a gas distribution to large radii that is more elliptical than the stellar mass distribution, we assume that the profile is spherically symmetric and parameterize the data with a circular -profile. We note that using an elliptical profile (e.g. with the same ellipticity that we found for the smaller scale emission) would not significantly change our conclusions below. A plot of the surface brightness in circular annuli versus distance from the nucleus is shown in Figure 7. X-ray knots, hotspots, and background point sources have been excluded.
We measure a flux of 1.3210-14 ergs cm-2 s-1 (unabsorbed) in the 0.1-10.0 keV band in an annular region 50′′ in radius from the nucleus, excluding the central 10′′. The X-ray luminosity of this emission is 1.1 1041 ergs s-1 in the same band. We have assumed a gas temperature of 0.7 keV, typical for groups, and an elemental abundance of 0.4 times Solar. For an assumed spherical -model profile with =0.5 and =30′′, the central proton density is 3.310-3 cm-3. The gas pressure at the distance of the center of the wings is 210-12 dyn cm-2. The equipartition pressure of the wings is 510-13 dyn cm-2 (see Section 4.2). If all of the X-ray emission from the wings is due to IC scattering of CMB photons, the pressure is 110-12 dyn cm-2 (see below). Thus, the internal minimum pressure of the radio wings is the same order of magnitude as the pressure of the ambient medium. Our estimate of the gas pressure has large uncertainties, and we have ignored the effects of projection which would place the lobes further out into the halo and into lower density gas. Given the uncertainties, it is reasonable to conclude that the lobes are in approximate pressure equilibrium with the ISM. There is no evidence to suggest that the wings are greatly overpressurized relative to the ambient medium.
3.2 Active Nucleus
The spectrum of the nucleus is well described by a two power-law model plus an Fe line. The primary power-law is heavily absorbed (41023 cm-2). We attribute the primary power-law component to emission from material near the inner part of the accretion close to the central supermassive black hole. There is no evidence for a significant amount of dust in HST observations of the host galaxy (Martel et al., 1999), so it is likely that this large absorption column is due to cool material in close proximity to the central black hole as well, perhaps a molecular torus. This is consistent with previous optical emission line studies that have shown that 3C 403 is a narrow emission line galaxy (NELG) (Tadhunter et al., 1993, 1998). This suggests that we are observing the disk/torus nearly edge on, and that the jets are advancing at an angle close to the plane of the sky. The broad line region, if it exists, must be buried behind the torus and unobservable. Neither the photon index (1.70.15) nor the unabsorbed X-ray luminosity (1.071044 ergs s-1 in the 0.25-10 keV bandpass) are unusual for the nuclei of radio galaxies.
The parameters of the second power-law component are poorly constrained, and as described above, we have fixed the power-law index (=2) and absorption (=41021 cm-2) of this component for consistency with the imaging data. We suggest that this second power-law component is X-ray emission from an unresolved jet that is partially obscured, as observed with greater sensitivity in Centaurus A (Evans et al., 2004). The radio luminosity of the core is 6.51021 W Hz-1 sr-1 at 5 GHz. The X-ray luminosity of the second power-law component is 7.11015 W Hz-1 sr-1 at 1 keV. The X-ray to radio flux ratio is consistent with that found in a sample of low-power radio galaxies (Canosa et al., 1999), and supports the hypothesis that this second power-law component is related to spatially unresolved emission from a jet. It is likely that the excess column density is due to absorption within a few pc of the nucleus. We speculate that this unresolved jet lies above the accretion disk, and our line of sight to the jet passes through a region of lower column density higher up in the torus. There is no evidence of gas or dust on kpc scales, perhaps from a recent merger, that could be responsible for this large column. It is also possible that the hot ISM is responsible for this large column. The column density of the hot gas within a distance (the central core radius) is 1.01021 cm-2, remarkably close to the 41021 cm-2 value chosen based on the multi-band images. A careful calculation would require detailed knowledge of the ionization state of the gas, the distribution of gas along the line of sight, and the elemental abundance, all of which are poorly constrained. Alternatively, it is possible that this second power-law component is due either to electron scattering from an ionized corona or a partial covering fraction absorber, both of which are often invoked to explain the X-ray spectrum of Seyfert galaxies (Turner et al., 1997). The observed flux ratio of the first and second power-law components is consistent with that observed in Seyfert galaxies. The jet hypothesis is, however, more natural in our view as 3C 403 is an FRII radio galaxy. This hypothesis could be evaluated by a VLBI observation to search for a pc-scale jet near the core.
A strong Fe line with EW=24420 eV (90% confidence) has also been detected. The centroid of the line is 6.310.04 keV, and the width (r.m.s.) of the line is 8050 eV. The centroid of this line is consistent with fluorescent emission from cold material. The large EW of this line is consistent with a model where the line emission originates from an absorbing region that surrounds the central supermassive black hole (Leahy & Creighton, 1993; Miyazaki et al., 1996). The measured width of the Fe line corresponds to a velocity (FWHM) of 900 km s-1. If the line broadening is the result of fluorescence from cold gas in Keplerian motion around a 109 M⊙ black hole, it must lie 5 pc from the black hole. It is reasonable to attribute the large column and fluorescent Fe line to a molecular torus that surrounds the central supermassive black hole.
4 Extended radio-related X-ray emission
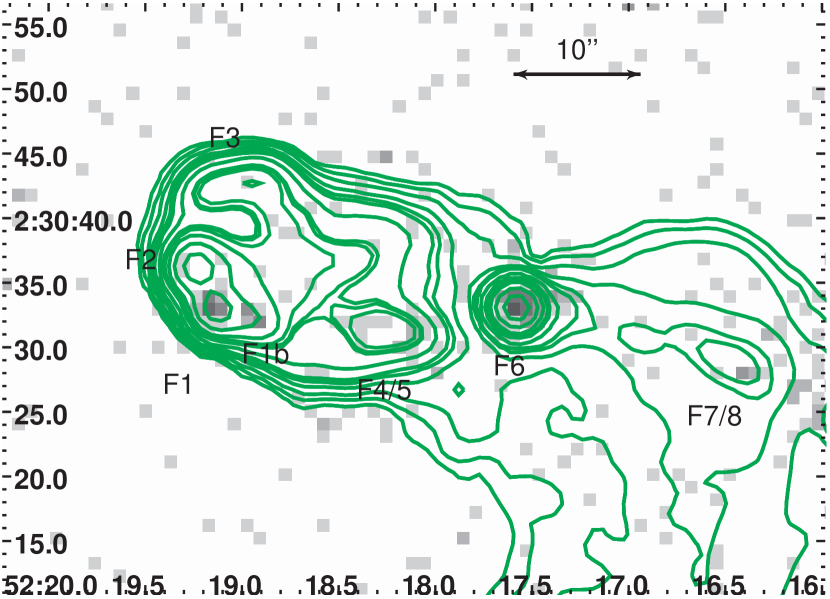
As shown in Figure 8, small-scale X-ray emission is associated with multiple radio components in the eastern lobe: these include the radio components F7/F8, F6, F5, F1 and a distinct radio component upstream of F1 which we denote F1b. There is no detected X-ray emission associated with the hotspot components F2 or F3 in the E lobe or with the larger hotspots P1 and P2 in the western lobe. Figure 10 shows that there is also large-scale diffuse emission associated with the western lobe and with both the extended wings. The position of the active nucleus in the X-ray data using the nominal aspect solution agrees with the radio position to better than 0.5′′. We have not attempted to improve the aspect solution beyond this.
4.1 Compact components
We begin by considering the compact components in the E lobe shown in Figure 8. For the X-ray emission associated with the radio hotspots F1 and F6, there are enough counts to fit a power-law spectrum. We find best-fitting photon indices of and for F1 and F6 respectively, and normalizations corresponding to flux densities at 1 keV of and nJy. For the other three compact components there are not enough counts to extract a spectrum, so we estimated the flux densities based on the count rates assuming a photon index of 2. (The flux density is insensitive to our assumed photon index: for a photon index of 1.5 the flux densities would decrease by %.) Flux densities for all the eastern lobe components are tabulated in Table 2.
We use the 8.4 GHz maps (Black et al., 1992) to measure radio flux densities corresponding to the X-ray detections. For compact radio components it is possible to extract radio flux densities either by integrating over the whole X-ray extraction region (with local background subtraction) or by fitting a model, such as a homogeneous sphere (as was done by Hardcastle et al. (2004)) or a Gaussian. In Table 2 we tabulate radio flux densities extracted using both methods, where they were both possible, which is true of the compact components F1 and F6; this illustrates the range of possible radio flux densities that can be said to correspond to the X-ray emission. We also tabulate the ratio of X-ray to radio flux.
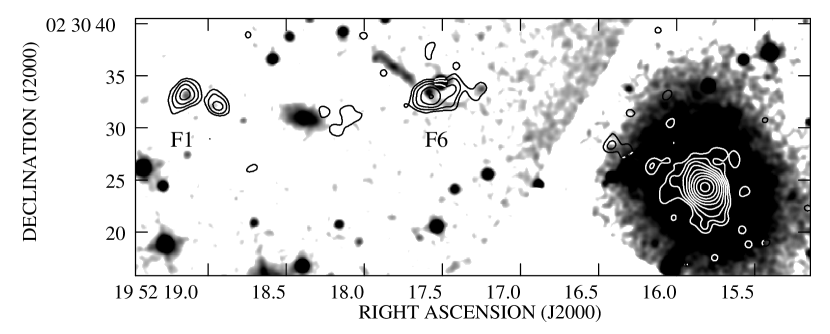
The compact components F1 and F6 are detected with HST; the HST image with X-ray contours overlaid is shown in Figure 11. The radio-optical-X-ray spectra of these two knots are shown in Figure 12. We have fitted synchrotron models to these data, and both of these components are well fitted by a single standard continuous injection model (Heavens & Meisenheimer, 1987). As pointed out by Hardcastle et al. (2004), inverse-Compton models require extreme conditions to reproduce the observed X-ray flux densities. The knots must either be far from equipartition or they must be moving relativistically at an angle close to the line of sight. A synchrotron model seems to be the only plausible explanation for the X-ray emission from F1 and F6. For the other components, the existing short HST observation does not give us useful constraints (these features are resolved at 8.4 GHz with an beam, and therefore spread over many HST WFC pixels) and we do not have X-ray spectral measurements. However, the radio to X-ray ratios for the other detected components (Table 2) are very similar to those measured for F1 and F6, so it would seem plausible that they have the same emission mechanism.
An interesting feature of this interpretation is that some of the X-ray detected components of 3C 403 are morphologically part of the jet rather than being hotspots: this is true of F1b, F5/4 and (the clearest case) F7/8, and it is also debatable whether F6 should be considered a jet knot rather than a primary hotspot. X-ray emission from hotspots is of course seen in many other sources, and has been attributed to synchrotron emission in some cases (e.g. 3C 390.3, Harris et al. (1998)), although 3C 403 is one of the clearest cases of synchrotron rather than inverse-Compton emission (Hardcastle et al., 2004). However, 3C 403 is one of the best examples of synchrotron X-ray emission from the jet of a powerful narrow-line radio galaxy. In unified models of FRII radio galaxies, the jets of narrow-line radio galaxies are at large angles to the line of sight (Barthel, 1989); this is true even for lower-luminosity objects, whose unification partners must be broad-line radio galaxies rather than quasars (Hardcastle, et al., 1998b). In both cases, the numbers of the different classes of objects observed require that the narrow-line objects be at angles greater than to the line of sight. Such large angles effectively rule out the possibility of applying the popular beamed inverse-Compton model (Tavecchio et al., 2000) to the jet in 3C 403. We have calculated the expected flux density in this model for the jet component F7/8 for a range of angles and bulk Lorentz factors, and find that the observed flux density can only be reproduced with large bulk Lorentz factors () and small angles to the line of sight (). While the large bulk Lorentz factors cannot be ruled out, such small angles to the line of sight are inconsistent with everything that is known about 3C 403. A synchrotron model appears to be the only viable one here. It is unclear what fraction of FRII jets are dominated in the X-ray band by synchrotron emission, but they may be common. The inverse-Compton process may dominate only in those sources whose jets are highly beamed.
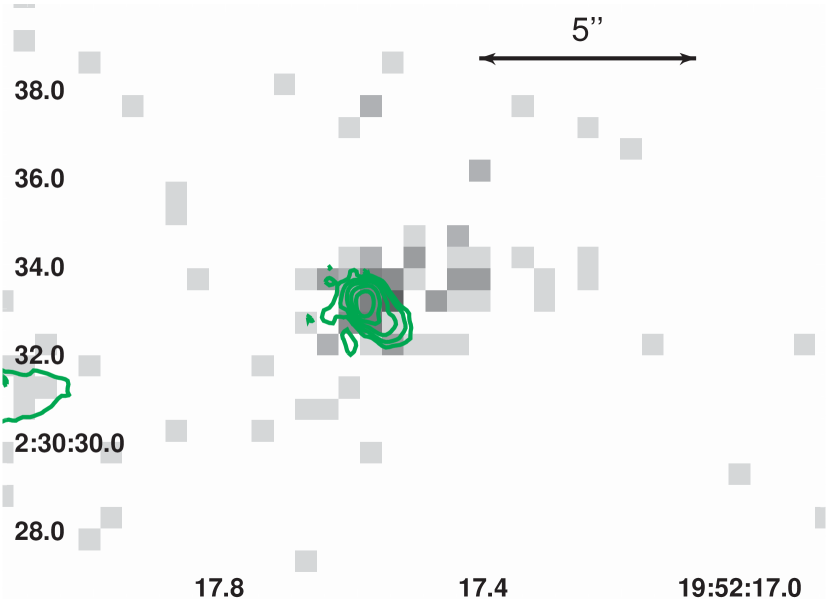
Finally, we wish to draw attention to two other interesting features of the compact X-ray emission. The first is the non-detection of the hotspot component F2. The upper limit on the X-ray emission from this hotspot is an order of magnitude below the level at which it would have been detected if its radio to X-ray ratio had been the same as the detected components’. In a synchrotron interpretation, this requires a difference in the particle acceleration properties of F1 and F2. It is possible that F2 is a relic hotspot that is now detached from the jet flow and that has no ongoing particle acceleration. The second interesting feature is the clear extension of the brightest X-ray feature, F6, back towards the nucleus. Figure 9 contains an X-ray image of the knot F6 in the 0.5-2.0 keV band with 8.4 GHz radio contours overlaid. The peaks of the radio and X-ray emission are well aligned, and both knots are clearly extended. The X-ray extension is to the W of the main peak, and the radio extension to the SW. There is no clear radio counterpart to the X-ray extension and if the extension is considered to be radio-related, it has an X-ray to radio flux density ratio more than a factor 10 above most of the other features in the jets (based on an upper limit to the possible associated radio emission). This sort of X-ray to radio ratio is not impossible for a synchrotron feature — knots in the Centaurus A jet show similar properties — but its location just upstream of a bright hotspot or jet knot is certainly intriguing, and reminiscent of the ‘offsets’ seen in the jets of FRI radio galaxies (Kraft et al., 2002; Hardcastle et al., 2003).
4.2 Extended components
Extended X-ray emission from the lobes of FRII radio sources is normally attributed to inverse-Compton emission (e.g. Hardcastle et al. (2002); Brunetti et al. (2002); Isobe et al. (2002); Comastri et al. (2003); Belsole et al. (2004); Croston et al. (2004a)). Typically the X-ray flux densities measured from the lobes are close to, or slightly above, the value expected for inverse-Compton scattering of the microwave background radiation by lobes with magnetic field strengths close to the equipartition value. The detected extended emission from the W lobe and wings of 3C 403 is too faint and diffuse for us to fit a spectrum, so that we cannot test the inverse-Compton model’s prediction of a flat (photon index 1.5) X-ray spectrum. However, we can estimate the 1-keV flux densities of the various components from the observed count rate. Here we assume a photon index of 1.5 in converting between counts and flux density. The results are tabulated in Table 3. The X-ray counts are background subtracted, and the uncertainties are statistical (Poisson).
We measured corresponding radio fluxes from 1.4 GHz and 8.4 GHz radio maps (the low-resolution map of Black et al. (1992) and a map made from the 1.4-GHz B-configuration data of Dennett-Thorpe et al. (2002)). These are also tabulated in Table 3. Modeling the lobes and hotspots as being in the plane of the sky, we then calculated the expected inverse-Compton flux density at equipartition. To do this we assumed no relativistic protons, a low-energy electron energy cutoff corresponding to , and a low-energy electron energy index of 2 (corresponding to . A high-energy break and cutoff were included to fit to the steep spectral index between 1.4 and 8.4 GHz, and the radio spectra were normalized to the appropriate fraction of the 178-MHz flux density of 28.3 Jy (see Leahy et al. (1997)) — this is justified given the very uniform spectral index found by Dennett-Thorpe et al. (2002). The inverse-Compton calculation was then carried out using the code of Hardcastle, Birkinshaw, & Worrall (1998a). We have assumed cylindrical geometry for the wings, and spherical geometry for the W lobe. The results are tabulated in Table 3.
The ratios of observed to predicted X-ray flux are around 4 for the two wings, which is not particularly unusual for radio galaxies (Croston et al., 2004b) and suggests field strengths within a factor of of the equipartition value in the wings. The discrepancy with the equipartition prediction would be further reduced if there were any projection of the wings. If we assume no projection, and take the X-ray flux density as giving a magnetic field strength measurement, then the electron energy density dominates over the magnetic field energy density in these lobes by around a factor 20, and the non-thermal pressure in the wings is about dyn cm-2 (with large uncertainties because of the large formal error on the count measurement). The western lobe, on the other hand, has a ratio of observed to predicted flux that is much larger than is typical, and the distribution of X-ray counts in this region is also not what would be expected from a simple inverse-Compton model, in which it should more or less match the low-frequency radio emission (Fig. 10). The X-ray emission is not peaked at the radio peak in the N end of the lobe, rather the X-ray emission uniformly fills the lobe. Therefore, this emission cannot be explained by inverse-Compton scattering of CMB photons by the electrons responsible for the radio emission. Because of the differences in radio and X-ray morphology, this emission is unlikely to be a shock heated shell of gas surrounding the lobe that would be created if the lobe were expanding into the ISM supersonically (Heinz, Reynolds, & Begelman, 1998; Kraft et al., 2003). It is possible that the X-ray emission from the W lobe is due to inverse-Compton scattering of beamed IR/optical photons from the active nucleus by a lower energy, unobservable, population of relativistic electrons. Such a model has been used to explain diffuse X-ray emission from the western lobe of the quasar 3C 207 (Brunetti et al., 1997, 2002).
5 Discussion - The Nature of X-shaped Radio Galaxies
As summarized in the introduction, there are two general scenarios commonly invoked to explain the X-shaped morphology of radio galaxies such as 3C 403. One line of argument suggests that the X-shaped morphology is a hydrodynamic phenomenon, and the other is that X-shaped radio galaxies are formed as the result of a sudden change in the jet axis of AGN, perhaps as the result of a galaxy merger and/or the merger of two supermassive black holes. Within the hydrodynamic scenario, there are two general models in the literature: the X-shaped structure is the result of strong (perhaps highly supersonic) backflow and subsequent buoyant evolution (Leahy & Williams, 1984; Worrall, Birkinshaw, & Cameron, 1995), or that both the lobes and wings are highly supersonic (relative to the ambient ISM/ICM) and the observed structures are the natural result of over-pressurized expansion/inflation of the lobes into an asymmetric medium (Capetti et al., 2002). We prefer the backflow/buoyancy model because, in our view, the observed structures of X-shaped radio galaxies are the natural consequences of strong backflows in an asymmetric medium, and there is no indication that 3C 403’s lobes are highly overpressured.
We know that strong backflows exist in radio galaxies, and that there are many cases where the morphology of the ambient medium in clusters, groups, and isolated ellipticals is complex. The dynamics of the backflow of material from the jet head are determined by several factors including the jet velocity, the density contrast between the jet and the ambient medium, and the temperature and density profile of the medium into which the jet is propagating (Leahy & Williams, 1984; Hardee et al., 1992). In particular, lighter jets (i.e. jets with a larger values of /) have more powerful backflows than heavier jets. Backflow velocities ranging from several thousand km s-1 to 0.1 have been estimated for a sample of double lobed 3CR radio galaxies (Alexander and Leahy, 1987). Thus backflow velocities can be orders of magnitude higher than the advance speed of the jet head. Once the backflow material reaches a strong pressure gradient, it will rapidly decelerate, bend (depending on the details of the gradient), and subsequently it will be driven primarily by buoyancy forces (i.e. subsonically). The density and pressure morphologies of the hot gas in clusters, groups, and elliptical galaxies is complex. If Chandra observations of clusters of galaxies are any guide, there are no such things as spherically symmetric gas halos sitting idly in their gravitating dark matter potentials (Markevitch, 2004, private communication). In our view, there is no compelling reason to invoke more complex phenomena such as merging supermassive black holes to explain X-shaped radio galaxies.
The arguments against the hydrodynamic models are based primarily on three considerations: the radio morphology of these objects, evidence for recent mergers, and radio spectral differences of the wings and lobes. None of these are strong arguments in our view and we suggest that it is quite plausible (and even natural) for backflow/buoyancy to create the structures that are observed. The most important of the three are those based on the radio morphology. In some sources, the wings (in projection) are longer than the lobes (as is the case in 3C 403) (Dennett-Thorpe et al., 2002), and in others the alignment of the wings and lobes relative to the nucleus is sometimes offset (e.g. NGC 326) (Gopal-Krishna, Biermann, & Wiita, 2003). Qualitative arguments are often made that the observed morphologies are unlikely to be generally formed by hydrodynamic flows. The implicit assumption in these arguments is that the gas atmosphere that the jet is propagating into is roughly spherically symmetric. The observed radio structures will depend critically on the distribution of the gas into which the jet is propagating. Similarly, the general paradigm suggests that the lobes of FR IIs are advancing supersonically into the ambient medium, and it has been argued that it is not plausible that the wings and lobes are approximately the same length if the lobes are evolving supersonically and the wings buoyantly (Leahy & Parma, 1991). This claim is true if the lobes are advancing supersonically into the ambient medium, but there is no direct evidence to support this claim. In all cases where the internal and external pressures of FR II lobes have been measured to date, the lobes appear to be close to pressure equilibrium with their surroundings, as we observe in 3C 403 (Hardcastle et al., 2002; Belsole et al., 2004; Croston et al., 2004a), implying relatively slow expansion. The complex radio morphology of 3C 403 is clearly different from the canonical lobe/hotspot morphology of classic FR II radio galaxies such as Cyg A, and its radio luminosity lies on the FRI/FRII dividing line. Both of these suggest that 3C 403 is among the least powerful sources in this class. The inner radio lobes of M87, a radio galaxy on the FRI/II luminosity boundary, have detached from the shock propagating through the ICM of the Virgo cluster and are thus evolving buoyantly/subsonically (Forman et al., 2004).
Additionally, some have argued that there is evidence for recent mergers in the host galaxies of some of these sources. This is certainly not a general conclusion as 3C 403, one of the best studied X-shaped radio galaxies, resides in a relatively poor environment and shows little evidence for a recent (within the last 108 years) merger. HST observations of the host galaxy of 3C 403 indicate the presence of weak dust lanes, suggestive of a much older merger, certainly older than the age of the radio source, estimated to be 16 Myr based on radio spectral analysis (Dennett-Thorpe et al., 2002). Finally, multispectral radio observations of several winged sources (e.g. NGC 326 (Ekers et al., 1978) and B2 0828+32 (Klein et al., 1995)) suggest that the plasma in the wings is considerably older than that in the lobes. Variations in radio spectral index across the wings and lobes would be a natural result if the jet axis were slowly precessing. However, this observational result is also consistent with the hydrodynamic backflow models in our view for two reasons. First, the plasma in the wings is naturally older than that in the lobes since it traveled back from the jet head to its present location in the wings. Second, the evolutionary history of the material in the wings is clearly different from that of the material currently in the lobes in the backflow model. The spectral differences could well be telling us something about the hydrodynamics and the nature of shock acceleration of the backflow, and be unrelated to radiative energy loss of the most energetic particles. It is impossible to draw definitive conclusions from spectral differences between the wings and lobes.
The quality of our data presented in this paper is not sufficient for us to put strong constraints on the dynamics of the lobes/wings interaction with the ISM and make a definitive, general statement regarding the nature of X-shaped radio galaxies. We have detected non-axisymmetric structures in the central region of the host galaxy. This result is consistent with the various hydrodynamic scenarios that have been invoked to explain this phenomenon. Deeper observations of this object and others with Chandra and/or XMM/Newton are required to better understand the interaction between the gaseous corona and the radio lobes in order to resolve this issue.
6 Conclusions
The primary results of this work include the following:
-
•
We have detected X-ray emission from the hot ISM, the active nucleus, several radio knots, and diffuse emission from the lobes and wings of the nearby X-shaped radio galaxy 3C 403.
-
•
Within 5 kpc of the nucleus, the morphology of the hot gas is highly (0.57) elliptic. This is consistent with the hypothesis that the X-shaped radio morphology is the result of the propagation of jets in non-axisymmetric atmospheres. The distribution of the stars in the central 5 kpc is considerably less elliptical (0.2). Our data are not of sufficient quality for us to make a good measurement of the density/pressure profile of the hot gas on larger scales, but within the uncertainties, the lobes and wings are in approximate pressure equilibrium with the hot corona.
-
•
We have detected X-ray and optical emission from radio knots and hotspots. Based on their radio/optical/X-ray, we attribute the emission in all cases to synchrotron emission, not IC scattering from the CMB. All lines of evidence suggest that the jet and radio lobes lie at a large angle to the line of sight, so the effects of relativistic beaming are negligible. This is one of the best examples to date of synchrotron X-ray emission from the compact radio features of a narrow-line FR II radio galaxy.
-
•
The X-ray spectrum of the nucleus is well modeled by two power laws plus a broad, fluorescent Fe line from cold material. The first power law is heavily absorbed and is buried deeply in the torus. The second power law is less heavily absorbed, and we attribute this to X-ray emission from an unresolved jet. The ratio of X-ray to radio flux is consistent with that measured for the nuclei of other radio galaxies.
-
•
Diffuse X-ray emission is detected from the lobes and wings. This emission can generally be explained as IC scattering from the CMB if we assume moderate departure from equipartition.
References
- Alexander and Leahy (1987) Alexander, P., and Leahy, J. P. 1987, MNRAS, 225, 1.
- Barthel (1989) Barthel, P. D. 1989, ApJ, 336, 606.
- Belsole et al. (2004) Belsole, E., Worrall, D. M., Hardcastle, M. J., Birkinshaw, M., and Lawrence, C. R. 2004, MNRAS, in press.
- Black et al. (1992) Black, A. R. S. Baum, S. A., Leahy, J. P., Perley, R. A., Riley, J. M., and Scheuer, P. A. G. 1992, MNRAS, 256, 186.
- Brunetti et al. (1997) Brunetti, G., Setti, G., and Comastri, A. 1997, A&A, 325, 898.
- Brunetti et al. (2002) Brunetti, G., Bondi, M., Comastri, A., Setti, G. 2002, A&A, 381, 795.
- Canizares, Fabbiano, & Trinchieri (1987) Canizares, C. R., Fabbiano, G., and Trinchieri, G. 1987, ApJ, 312, 503.
- Carilli, Perley, & Harris (1994) Carilli, C. L., Perley, R. A., and Harris, D. E. 1994, MNRAS, 270, 173.
- Canosa et al. (1999) Canosa, C. M., Worrall, D. M., Hardcastle, M. J., and Birkinshaw, M. 1999, MNRAS, 310, 30.
- Capetti et al. (2002) Capetti, A., Zamfir, S., Bodo, G., Zanni, C., and Massaglia, S. 2002, A&A, 394, 39.
- Comastri et al. (2003) Comastri, A., Brunetti, G., Dallacasa, D., Bondi, M., Pedani, M., Setti, G. 2003, MNRAS, 304, L52.
- Croston et al. (2004a) Croston, J. H., Hardcastle, M. J., Birkinshaw, M., and Worrall, D. M. 2004a, MNRAS, 353, 978.
- Croston et al. (2004b) Croston, J. H., et al. 2004b, MNRAS, in preparation.
- Davis (2001) Davis, J. 2001, ApJ, 562, 575.
- Dennett-Thorpe et al. (2002) Dennett-Thorpe, J., Scheuer, P. A. G., Laing, R. A., Bridle, A. H., Pooley, G. G., and Reich, W. 2002, MNRAS, 330, 609.
- Ekers et al. (1978) Ekers, R. D., Fanti, R., Lari, C., and Parma, P. 1978, Nature, 276, 588.
- Evans et al. (2004) Evans, D. A., Kraft, R. P., Worrall, D. M., Hardcastle, M. J., Jones, C., Forman, W. R., Murray, S. S. 2004, ApJ, 612, 786.
- Forman et al. (2004) Forman, W. R., et al. 2004, ApJ, in press.
- Gopal-Krishna, Biermann, & Wiita (2003) Gopal-Krishna, Biermann, P. L., and Wiita, P. J. 2003, ApJ, 594, L103.
- Govoni et al. (2000) Govoni, F., Falomo, R., Fasano, G., and Scarpa, R. 2000, A&A, 353, 607.
- Hardcastle, Birkinshaw, & Worrall (1998a) Hardcastle, M. J., Birkinshaw, M., Worrall, D. M. 1998, MNRAS, 294, 615.
- Hardcastle, et al. (1998b) Hardcastle, M. J., Alexander, P., Pooley, G. G., Riley, J. M. 1998, MNRAS, 296, 445.
- Hardcastle et al. (1999) Hardcastle, M. J., Alexander, P., Pooley, G. G., and Riley, J. M., 1999, MNRAS, 304, 135.
- Hardcastle, Birkinshaw, & Worrall (2001) Hardcastle, M. J., Birkinshaw, M., and Worrall, D. M. 2001, MNRAS, 326, 1499.
- Hardcastle et al. (2002) Hardcastle, M. J., Worrall, D. M., Birkinshaw, M., Laing, R. A., and Bridle, A. H. 2002, MNRAS, 334, 182.
- Hardcastle et al. (2003) Hardcastle, M. J., Worrall, D. M., Kraft, R. P., Forman, W. R., Jones, C., and Murray, S. S. 2003, ApJ, 593, 169.
- Hardcastle et al. (2004) Hardcastle, M. J., Harris, D. E., Birkinshaw, M., and Worrall, D. M. 2004, ApJ, in press.
- Hardee et al. (1992) Hardee, P. E., White, R. E., Norman, M. L., Cooper, M. A., and Clarke, D. A. 1992, ApJ, 387, 460.
- Harris et al. (1998) Harris, D. E. et al. 1998, ApJ, 449, L149.
- Harris et al. (2000) Harris, D. E. et al. 2000, ApJ, 530, L81.
- Heavens & Meisenheimer (1987) Heavens, A. F., and Meisenheimer, K. 1987, MNRAS, 225, 335.
- Heinz, Reynolds, & Begelman (1998) Heinz, S., Reynolds, C. S., and Begelman, M. C. 1998, 501, 126.
- Isobe et al. (2002) Isobe, N., Tashiro, M., Makishima, K., Iyomoto, N., Suzuki, M., Murakami, M. M., Mori, M., Abe, K. 2002, ApJ, 580, L111.
- Klein et al. (1995) Klein, U., Mack, K.-H., Gregorini, L., and Parma, P. 1995, A&A, 303, 427.
- Kraft et al. (2002) Kraft, R. P.,Forman, W. R., Jones, C., Murray, S. S., Hardcastle, M. J., Worrall, D. M. 2002, ApJ, 569, 54.
- Kraft et al. (2003) Kraft, R. P., Vázquez, S., Forman, W. R., Jones, C., Murray, S. S., Hardcastle, M. J., Worrall, D. M., and Churazov, E. C. 2003, ApJ, 592, 129.
- Laing, Riley, & Longair (1983) Laing, R. A., Riley, J. M., & Longair, M. S. 1983, MNRAS, 204, 151.
- Leahy & Williams (1984) Leahy, J. P., and Williams, A. G. 1984, MNRAS, 210, 929.
- Leahy & Parma (1991) Leahy, J. P., and Parma, P. 1991, in Proceedings of the 7th IAP Meeting, Extragalactic Radio Sources - From Beams to Jets, ed. J. Roland, H. Sol, and G. Pelletier (Cambridge, Cambridge University Press), 307.
- Leahy et al. (1997) Leahy, J. P., Black, A. R. S., Dennett-Thorpe, J., Hardcastle, M. J., Komissarov, S., Perley, R. A., Riley, J. M., Scheuer, P. A. G. 1997, MNRAS, 291, 20.
- Leahy & Creighton (1993) Leahy, D. A., and Creighton, J. 1993, MNRAS, 263, 314.
- Marshall et al. (2002) Marshall, H. L., Miller, B. P., Davis, D. S., Perlman, E. S., Wise, M., Canizares, C. R., Harris, D. E. 2002, ApJ, 564, 683.
- Martel et al. (1999) Martel, A. et al. 1999, ApJS, 122, 81.
- Merritt & Ekers (2002) Merritt, D., and Ekers, R. D. 2002, Science, 297, 1310.
- Miyazaki et al. (1996) Miyazaki, S. et al. 1996, PASJ, 48, 801.
- O’Sullivan, Forbes, & Ponman (2001) O’Sullivan, E., Forbes, D. A., and Ponman, T. J. 2001, MNRAS, 328, 461.
- Sambruna et al. (2001) Sambruna, R., M., Urry, C. M., Tavecchio, F., Maraschi, L., Scarpa, R., Chartas, G., and Muxlow, T. 2001, ApJ, 549, L161.
- Schlegel, Finkbeiner, & Davis (1998) Schlegel, D. J., Finkbeiner, D. P., and Davis, M. 1998, ApJ, 500, 525.
- Tadhunter et al. (1993) Tadhunter, C. N., Morganti, R., di Serego Alighieri, S., Fosbury, R. A. E., Danziger, I. J. 1993, MNRAS, 263, 999.
- Tadhunter et al. (1998) Tadhunter, C. N., Morganti, R., Robinson, A., Dickson, R., Villar-Martin, M., and Fosbury, R. A. E. 1998, MNRAS, 298, 1035.
- Tavecchio et al. (2000) Tavecchio, F., Maraschi, L., Sambruna, R. M., and Urry, C. M. 2000, ApJ, 544, L23.
- Turner et al. (1997) Turner, T. J., George, I. M., Nandra, K., and Mushotzky, R. F. 1997, ApJ, 488, 164.
- Wilson, Young, & Shopbell (2001) Wilson, A. S., Young, A. J., and Shopbell, P. L. 2001, ApJ, 547, 740.
- Worrall, Birkinshaw, & Cameron (1995) Worrall, D. M., Birkinshaw, M., and Cameron, R. A. 1995, ApJ, 449, 93.
- Worrall, Birkinshaw, & Hardcastle (2001) Worrall, D. M., Birkinshaw, M., and Hardcastle, M. J. 2001, MNRAS, 326, L7.


| Count rate | 4.7110-2 cts s-1 | |
| APEC | 0.30.04 keV | |
| 1.0Solar (fixed) | ||
| 1.541021 cm-2 (fixed - Galactic) | ||
| Flux | 3.610-14 ergs cm-2 s-1 | |
| Luminosity | 2.91041 ergs s-1 | |
| First PL | Index | 1.700.15 |
| 4.00.21023 cm-2 | ||
| Flux | 1.3110-11 ergs cm-2 s-1 | |
| Luminosity | 1.071044 ergs s-1 | |
| Second PL | Index | 2.0 (fixed) |
| 4.01021 cm-2 (fixed) | ||
| Flux | 8.7510-14 ergs cm-2 s-1 | |
| Luminosity | 7.111041 ergs s-1 | |
| Fe line | Centroid | 6.310.04 keV |
| Width (r.m.s.) | 8050 eV | |
| EW | 24420 eV |
| Name | 0.5-5.0 keV | X-ray flux density | Photon | Radio flux | Radio flux | X-ray/radio |
|---|---|---|---|---|---|---|
| counts | (nJy at 1 keV) | index | (model) (mJy) | (integ.) (mJy) | ratio () | |
| F1 | 16 | 25 | 0.06–0.04 | |||
| F1b | 2 | 7.7 | 0.06 | |||
| F2 | 2 | 27 | ||||
| F5/4 | 2 | 10.8 | 0.05 | |||
| F6 | 27 | 41 | 0.09–0.06 | |||
| F7/8 | 2 | 2.6 | 0.12 |
| Name | 0.5-5.0 keV | 1-keV flux | 1.4-GHz | 8.4-GHz | Geometry | Predicted (1 keV) | Ratio |
|---|---|---|---|---|---|---|---|
| counts | (nJy) | flux (Jy) | flux (Jy) | IC (nJy) | (Obs/Pred) | ||
| N wing | 1.6 | 0.78 | 0.27 | Cylinder, | 0.35 | 4.6 | |
| S wing | 1.4 | 0.71 | 0.24 | Cylinder, | 0.34 | 4.0 | |
| W lobe | 1.4 | 1.88 | 0.50 | Sphere, | 0.1 | 14 | |
| 75 |