Evidence for Correlated Titanium and Deuterium Depletion in the Galactic ISM
Abstract
Current measurements indicate that the deuterium abundance in diffuse interstellar gas varies spatially by a factor of 4 among sightlines extending beyond the Local Bubble. One plausible explanation for the scatter is the variable depletion of D onto dust grains. To test this scenario, we have obtained high signal-to-noise, high resolution profiles of the refractory ion Ti II along seven Galactic sightlines with D/H ranging from 0.65 to . These measurements, acquired with the recently upgraded Keck/HIRES spectrometer, indicate a correlation between Ti/H and D/H at the c.l. Therefore, our observations support the interpretation that D/H scatter is associated with differential depletion. We note, however, that Ti/H values taken from the literature do not uniformly show the correlation. Finally, we identify significant component-to-component variations in the depletion levels among individual sightlines and discuss complications arising from this behavior.
Accepted to the Astrophysical Journal Letters: December 28, 2004
1 INTRODUCTION
In standard big bang nucleosynthesis (BBN), deuterium is the most sensitive baryometer of the light elements (Schramm & Turner, 1998). Measurements of its primordial value in quasar absorption line systems have placed tight constraints on the baryonic mass density (Burles & Tytler, 1998; O’Meara et al., 2001; Kirkman et al., 2003). The inferred value is in impressive agreement with the value derived from CMB measurements of the WMAP (e.g. Spergel et al., 2003) and other microwave experiments lending confidence to both the deuterium measurements and BBN theory. In addition to its cosmological significance, deuterium is an important tracer of chemical evolution. Deuterium is astrated within stellar cores, and there are no known means of producing significant amounts of D other than BBN. The evolution of D/H, therefore, tracks the global history of the gas astration within a galaxy (e.g Chiappini, Renda, & Matteucci, 2002).
It is in this context that measurements of D/H within the Milky Way have impact: (1) the upper bound to the Galactic D/H value sets a lower limit to the primordial D/H value; and (2) a comparison of Galactic D/H with the primordial D/H value describes the chemical evolution history of the Galaxy. Since the first measurements of Galactic D/H with Copernicus (Rogerson & York, 1973), surveys for Galactic D/H have been pursued on each succeeding UV observatory bearing a high resolution spectrometer (e.g. Linsky et al., 1995; Jenkins et al., 1999; Hoopes et al., 2003; Wood et al., 2004). The most remarkable conclusion of these efforts is that beyond the Local Bubble the D/H values have significant scatter; D/H ranges from 5 to . This dispersion is larger than the estimated statistical error and is unlikely to be systematic error associated with the data analysis (see references in Table 1 for detailed and thorough analyses of the measurement uncertainties). At present, it seems that the D/H ratio has intrinsic scatter within the Milky Way.
Recently, observations with the Interstellar Medium Absorption Profile Spectrograph (IMAPS) and the FUSE Observatory have extended D/H measurements to large distances from the Sun and correspondingly higher values. Although only a handful of measurements exist to date, Wood et al. (2004) and others have noted that the few sightlines that probe the greatest distances (pc) have a central value and dispersion that are significantly smaller than sightlines at intermediate distances (20 pc pc). One possible interpretation of these trends is that D is significantly depleted onto dust grains (e.g. Jura, 1982). Draine (2004a, b) has examined the principal mechanisms of D adsorption and grain destruction and argues that it is at least plausible that D would be preferentially depleted. He proposed testing the depletion hypothesis by comparing the D/H values with abundances of refractory elements like Fe, Ni, and Ti (i.e. species that are highly prone to depletion onto grains) along the same sightlines.
| Target | Ori | Ori | HD 191877 | HD 195965 | BD+28∘4211 | Ori | Feige 110 |
|---|---|---|---|---|---|---|---|
| 1.71 | 2.01 | 6.22 | 6.60 | 13.01 | 2.53 | 13.01 | |
| Obs (UT) | 08Sep2004 | 08Sep2004 | 08Sep2004 | 08Sep2004 | 06Oct2004 | 08Sep2004 | 09Sep2004 |
| texp (s) | 9 | 13 | 1800 | 1200 | 1800 | 9 | 1800 |
| S/Na | 370 | 355 | 350 | 250 | 145 | 280 | 120 |
| D/Hb | |||||||
| Ref | 1 | 2 | 3 | 3 | 4 | 1 | 5 |
| Ti/H) |
We have initiated a program to obtain high signal-to-noise (S/N), high resolution observations of Ti II profiles for sightlines with accurate Galactic D/H measurements. Previous surveys of Ti have demonstrated that it is highly refractory, presumably because of its large condensation temperature (e.g. Stokes, 1978; Lipman & Pettini, 1995). Therefore, a measurement of Ti/H in the ISM assesses the depletion level along that sightline. Of additional importance, Ti+ is the dominant ion in H I regions. Unlike Na0 and Ca+ the ionization potential of Ti+ is Ryd and Ti+ is predominantly shielded from ionizing photons. Furthermore, Ti+ has a charge exchange reaction rate with hydrogen that is significantly greater than many other ions (e.g. Fe+,Si+; Kingdon & Ferland, 1996). We expect is less sensitive to photoionization effects and Ti II should trace the velocity profiles of H I and D I gas. Therefore, high resolution Ti II profiles are likely to be better suited than, e.g., Fe II, for constraining the fits of D I and assessing the likelihood of deuterium line saturation in high sightlines.
In this paper, we report on our first set of Ti II observations of seven sightlines. We measure the Ti+ column densities to assess the depletion levels along the sightlines and examine correlations with the observed D/H values. Finally, this Letter establishes a public database for Ti II measurements obtained by our group111http://www.ucolick.org/xavier/TiII/index.html. The data presented here, and all future observations, will be archived at this site, including the raw data and calibration frames. The data are freely available to other researchers.
2 Observations and Reduction
The seven sightlines presented here were observed on the nights of September 8 and 9 and October 6, 2004 UT with the recently upgraded HIRES spectrometer (Vogt et al., 1994) on the 10m Keck I telescope. The spectrometer now contains a three CCD mosaic with quantum efficiency at Å. Because the targets are bright, we obtained the data primarily during twilight. The first half of the first night was marred by poor observing conditions while the remainder of the time was clear with typical seeing of FWHM . The targets in September 2004 were observed through the B5 decker ( width; FWHM km s-1 resolution; slit length) while BD+28∘4211 was observed through the B1 decker ( width; FWHM km s-1 resolution; slit length). Table 1 summarizes the exposure times and data quality of the sample.
At the time of publication, a data reduction pipeline for the upgraded HIRES instrument was not available. Therefore, we reduced the two echelle orders containing the Ti II transitions with a set of in-house IDL routines. These routines subtracted the bias, interactively set a boxcar aperture, interactively determined a region for scattered light subtraction (sky background was minimal), and extracted a 1D spectrum. A variance array was calculated accounting for the read noise and assuming Gaussian statistics. Wavelength calibration was carried out by fitting a 3rd order polynomial to the arc lines identified in the 1D spectra extracted from a ThAr image using the same trace and aperture as the science extraction. The typical RMS deviation from the fit was less than 0.1 pixels (i.e. Å). Although we achieved a formal S/N ratio pix-1 for the brightest targets, the scatter around the stellar continuum significantly exceeds Gaussian statistics in the brightest sources. This is most likely due to noise in the combined flat field or perhaps small errors in the traces of the dispersed spectra. Throughout the analysis, we have augmented the variance arrays to match the empirical scatter measured in the stellar continuum.
All of the individual exposures were rebinned to a common wavelength scale with Å and a pixel size of 1.4km s-1 after correcting to vacuum wavelengths and the heliocentric velocity reference frame. Multiple exposures of the same object were compared to identify cosmic rays and then coadded after scaling to a common flux and weighting by the square of the median signal-to-noise. Finally, we normalized the data by fitting a high order polynomial to the unfluxed stellar continuum. Continuum normalization is generally the largest source of uncertainty in the analysis, especially for the weakest transitions.
3 Analysis
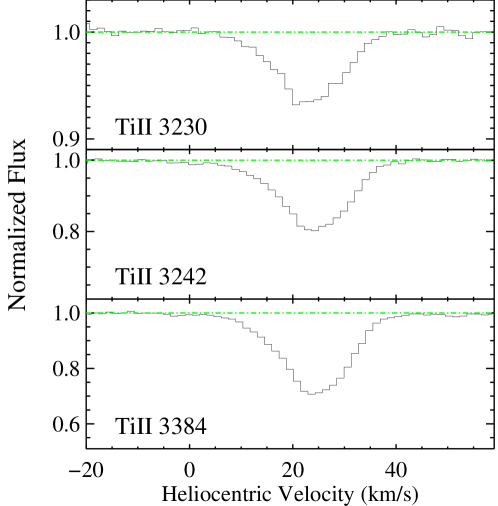
Figure 1 presents a velocity plot for the HD 191877 sightline. At the recorded S/N and resolution, it is straightforward to measure the Ti II ionic column densities. In the following, we assume that the majority of Ti+ is in the ground state. From our observations, we measure as a conservative upper limit to the state ( K). Provided the Ti II profiles have small optical depth, we can measure the Ti II column density by (i) summing the EW and assume the weak limit for the curve-of-growth (the values range from several to 30 mÅ); (ii) integrating the line profile with the apparent optical depth method (AODM; Savage and Sembach, 1991; Jenkins, 1996); and (iii) by fitting Voigt profiles to the data. All three techniques yield similar results; we have mainly used the AODM in this paper. The results for the three transitions222Assuming (Bizzarri et al., 1993; Pickering, Thorne, & Perez, 2001, 2002; Morton, 2003). for all of the sightlines are listed in Table 1. For all measurements we report uncertainties and the upper limits correspond to limits. The uncertainties include (in quadrature) statistical uncertainty from Poisson noise and error due to continuum placement. We estimate a 1 continuum error of 0.1 for all of the objects except Feige 110 (0.2) which corresponds to an approximately 0.5 mÅ error over the integrated profiles. Finally, we adopt a minimum error of 0.02 dex owing to systematic uncertainties related to data reduction (e.g. flat fielding).

Figure 2 presents (Ti/H) against the (D/H) values reported in the literature. The visual impression is suggestive of a correlation between the two quantities. The non-parametric Spearman and Kendall correlation tests reject the null hypothesis at the 96 and 95 c.l. respectively and indicate a positive correlation between the two quantities. This correlation provides preliminary evidence that the variation in Galactic D/H is related to the physical conditions that imply high depletion levels. Indeed, the results are consistent with the interpretation that low Galactic D/H values are due to an increased depletion of D onto grains.
Examining the figure, it is obvious that additional measurements of sightlines with large (D/H) value will be especially valuable for testing the correlation. Furthermore, one observes a large spread in Ti/H at low D/H. If confirmed by future observations, the spread in Ti/H would argue against a simple linear correlation between Ti/H and D/H. We note that two additional stars ( Pup, Vel) with (D/H) have Ti II column densities reported in the literature (Welsh et al., 1997). The inferred Ti/H value for Pup ((Ti/H) = ) follows the trend indicated in Figure 2. The upper limit to Ti/H ) for Vel, however, suggests the gas along this sightline is significantly depleted even though its D/H value is among the highest known. A similar conclusion may be drawn from the GHRS observations of Fe II by Fitzpatrick & Spitzer (1994) although line-saturation is a potential concern. Although the confirmation of a high depletion level toward Vel would raise concern, Draine (2004a) notes that the processes of D depletion are different from those for other ions, e.g., D may be depleted in polycyclic aromatic hydrocarbons while heavier elements are depleted by other types of dust grains. Therefore one need not expect a one-to-one correspondence between Ti/H and D/H. In the coming year, we plan to acquire Ti II observations along many additional sightlines to better constrain the slope and scatter of Ti/H vs. D/H.
We have also examined the correlation between Ti/H and the values of the sightlines. Because one observes a correlation between volume density and depletion level (e.g. Jenkins, 1987), one may expect a similar trend for . Furthermore, if photoionization is important along these sightlines its effects should correlate with . The Spearman and Kendall tests, however, reveal the null hypothesis is ruled out at only the and c.l. respectively. This follows the results from previous surveys of the Galactic disk Ti II (Stokes, 1978; Welsh et al., 1997) although Wakker & Mathis (2000) see a strong correlation in a set of clouds with much larger dynamic range in than the sightlines considered here.
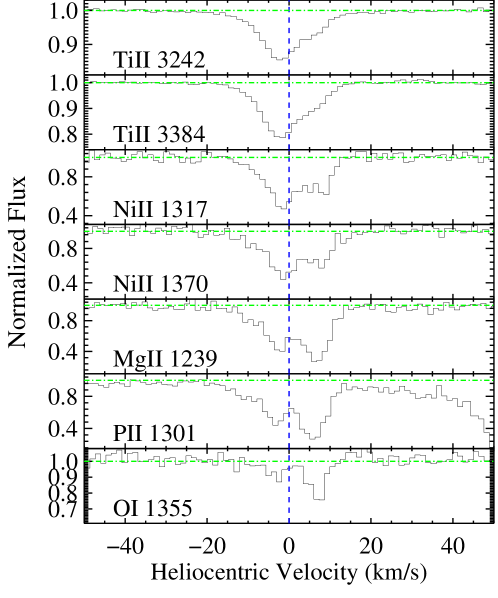
We wish to emphasize an important aspect of differential depletion in the analysis of Galactic D/H. In Figure 3, we present the Ti II profiles for the HD 195965 sightline against a series of UV transitions obtained with STIS on the Hubble Space Telescope. The UV data have higher resolution (FWHM km s-1 ) but lower S/N per resolution element than the optical observations. Examining the detailed component structure of the profiles, the refractory ions (e.g. Ti+, Ni+) have similar characteristics. Comparing against the non-refractory profiles (P+, O0), however, we identify the two main components but note that the relative abundances are significantly different. The Ti abundance relative to O is greater in the positive component than the negative component. It is also noteworthy that the Mg II profiles more closely track the non-refractory species even though Mg is depleted along the sightline.
This raises a number of concerns regarding the analysis and interpretation of D/H. First, variations in the depletion level on a given sightline would generally lead to a weaker correlation between any existing Ti/H vs. D/H correlation if one only considers the integrated values. By a similar token, one would tend to underestimate the magnitude of intrinsic scatter in D/H regardless of the physical mechanism responsible. Another complication is that it is unclear whether one should constrain the analysis of D in lower resolution data (e.g. FUSE observations) with the velocity profiles traced by the O I, Mg II, or Ti II profiles. Profiles of Fe II are likely to be similar to Ni II and Ti II and could also be confusing in analysis of D I. A useful exercise would be to quantitatively compare high resolution D profiles with both refractory and non-refractory transitions along sightlines where the depletion levels vary. We consider these issues and examine the systematic effects on the inferred D/H ratios in a future paper. Finally, we note that the D profile of at least one extragalactic sightline shows significantly different component structure than the corresponding metal-line profiles (Tytler et al., 1996). Although the physical origin is more likely related to differences in metallicity or the ionization state of the metals, one cannot rule out intrinsic scatter in D/H even in these low metallicity sightlines. This issue could be relevant in studies of D/H in damped Ly systems.
References
- Bizzarri et al. (1993) Bizzarri, A., Huber, M.C.E., Noels, A., Grevesse, N., Bereson, S.D., Tsekeris, P., & Lawler, J.E. 1993, A&A, 273, 707
- Burles & Tytler (1998) Burles, S. and Tytler, D. 1998, ApJ, 507, 732
- Chiappini, Renda, & Matteucci (2002) Chiappini, C., Renda, A., & Matteucci, F., 2002, A&A, 395, 789
- Draine (2004a) Draine, B. 2004a, in “Origin and Evolution of the Elements”, ed. A. McWilliam and M. Rauch (astro-ph/0312592)
- Draine (2004b) Draine, B. 2004b, FUSE Conference Proceeding, (astro-ph/0410310)
- Fitzpatrick & Spitzer (1994) Fitzpatrick, E.L. & Spitzer, L.Jr. 1994, ApJ, 427, 232
- Friedman et al. (2002) Friedman, S.D., et al. 2002, ApJS, 140, 37
- Hoopes et al. (2003) Hoopes, C.G., Sembach, K.R., Hébrard, G., Moos, H.W., & Knauth, D.C. 2003, ApJ, 586, 1094
- Jenkins (1996) Jenkins, E. B. 1996, ApJ, 471, 292
- Jenkins (1987) Jenkins, E.B. 1987, in Interstellar Processes ed. D.J. Hollenbach and H.A. Thronson, Jr. (Boston: D. Reidel Publishing Company), p. 533
- Jenkins et al. (1999) Jenkins, E.B., Tripp, T.M., Wozniak, P.R., Sofia, U.J., & Sonneborn, G. 1999, ApJ, 520, 182
- Jura (1982) Jura, M. 1982, in Advances in Ultraviolet Astronomy, ed. Y. Kondo, NASA CP-2238, p. 54
- Kingdon & Ferland (1996) Kingdon, J.B., & Ferland, G.J. 1996, ApJS, 106, 206
- Kirkman et al. (2003) Kirkman, D., Tytler, D., Suzuki, N., O’Meara, J.M., & Lubin, D. 2003, ApJS, 149, 1
- Laurent, Vidal-Madjar, & York (1979) Laurent, C., Vidal-Madjar, A., & York, D.G. 1979, ApJ, 229, 923
- Linsky et al. (1995) Linsky, J.L., Diplas, A., Wood, B.E., Brown, A., Ayres, T.R., & Savage, B.D. 1995, ApJ, 451, L335
- Lipman & Pettini (1995) Lipman, K. & Pettini, M. 1995, ApJ, 442, 628
- Morton (2003) Morton, D.C. 2003, priv. comm.
- O’Meara et al. (2001) O’Meara, J.M., Tytler, D., Kirkman, D., Nao, S., Prochaska, J.X., Lubin, D., & Wolfe, A.M. 2001, ApJ, 552, 718
- Pickering, Thorne, & Perez (2001) Pickering, J.C., Thorne, A.P., & Perez, R. 2001, ApJS, 132, 403
- Pickering, Thorne, & Perez (2002) Pickering, J.C., Thorne, A.P., & Perez, R. 2002, ApJS, 138, 247
- Rogerson & York (1973) Rogerson, J.B., Jr. & York, D.G.. 1976, ApJ, 186, L95
- Savage and Sembach (1991) Savage, B. D. and Sembach, K. R. 1991, ApJ, 379, 245
- Schramm & Turner (1998) Schramm, D.N. & Turner, S.M. 1998, Rev. Mod. Phys. 70,, 303
- Sonneborn et al. (2002) Sonneborn, G. et al. 2002, ApJS, 140, 51
- Spergel et al. (2003) Spergel, D. et al. 2003, ApJS, 148, 175
- Stokes (1978) Stokes, G.M. 1978, ApJS, 36, 115
- Tytler et al. (1996) Tytler, D., Fan, X.-M., & Burles, S. 1996, Nature, 381, 207
- Vogt et al. (1994) Vogt, S.S., Allen, S.L., Bigelow, B.C., Bresee, L., Brown, B., et al. 1994, SPIE, 2198, 362
- Wakker & Mathis (2000) Wakker, B.P. & Mathis, J.S. 2000, ApJ, 544, L107
- Welsh et al. (1997) Welsh, B.Y, Sasseen, T., Craig, N., Jelinsky, S., & Albert, C.E. 1997, ApJS, 112, 507
- Wood et al. (2004) Wood, B.E., Linsky, J.L., Hébrard, G., Williger, G.M., Moos, H.W., & Blair, W.P. 2004, ApJ, 609, 838