A Possible High Nova Rate for Two Local Group Dwarf Galaxies:
M32 and NGC 205
Abstract
We report the results of a preliminary nova survey of Local Group dwarf ellipticals. We used the 15’ field-of-view CCD camera on the 0.8 m telescope at the Tenagra Observatory to observe M32, NGC 205, NGC 147, and NGC 185 in their entirety every clear night over a 4.5 month interval and discovered one nova in M32 and a candidate nova in NGC 205. The nova in M32 was verified spectroscopically. The nova candidate in NGC 205 had an unusually low peak luminosity (M), and we were unable to obtain spectroscopic verification. Archival HST images provide us with a limit on the outburst amplitude for this object of 4.6 Vmag. These facts prompt us to consider the possibility that this object is not a genuine nova. We report a high bulk nova rate for M32 of yr-1 and, assuming the candidate nova is correctly identified, for NGC 205 of yr-1. If the NGC 205 variable is not a nova, we calculate an upper limit on the bulk nova rate for NGC 205 of 1.5 yr-1. We report upper limits on the bulk nova rates in NGC 147 of 2 yr-1 and NGC 185 of 1.8 yr-1 and a combined bulk nova rate for the four galaxies of yr-1 (2 yr-1 without the NGC 205 nova candidate). The bulk rates we report here are based on Monte Carlo simulations using nova maximum magnitudes and decline rates and individual epoch frame limits. From the Monte Carlo rates, integrated and extinction corrected V-band photometry, and (V-K)0 colors we derive a luminosity specific nova rate for M32 of 12.0 yr and for NGC 205 of 29.3 yr and for the combined 4 galaxies of 14.1 yr (7.0 yr without the NGC 205 nova candidate). The higher combined rate is 2.5 higher than expected from assuming a constant luminosity specific nova rate as a function of K-band luminosity as derived from more massive galaxies. If the higher rate is confirmed by surveys in subsequent seasons, it would imply that either dwarf ellipticals have a higher interacting binary fraction than their higher mass counter parts, or that the completeness is higher for these less complex systems and the nova rates for larger, more distant systems are systematically underestimated.
1 Introduction
Extragalactic novae are potentially important as tracers of close binary stars in other galaxies. Current estimates of the bulk nova rates in galaxies such as M31 (Shafter & Irby, 2001) of 37 yr-1 imply that in a few years the number of observed novae could be quite large for such a system. Novae represent an important complement to the increasing data on extragalactic X-ray binaries afforded by Chandra and XMM. The brightness of the nova outburst (MV of to at maximum) betrays their presence to beyond the Virgo cluster with current telescopes. By observing extragalactic novae it is possible to trace the frequency and distribution of the close binaries that produce them in many extragalactic environments, thus allowing an exploration of close binary populations and the factors that influence their formation.
One of the most basic investigations into these factors is to plot the normalized nova rate versus the luminosity of the host galaxy and see if any trend can be detected. Various versions of this plot have been produced over the years (della Valle et al., 1994; Shafter, Ciardullo, & Pritchet, 2000; Ferrarese, Côté, & Jordán, 2003), but systematic effects continue to dominate the published nova rates. We have found that nova rates are subject to biases that tend to underestimate the bulk rate for a given galaxy (Neill & Shara, 2004). Most severe of these biases is the one imposed by telescope scheduling, which, until recently, provided only short, widely spaced runs for sampling nova rates in external galaxies.
We have attempted to overcome this bias by using a dedicated telescope to observe the target galaxy in its entirety, every clear night for many months. Our first survey of this type was of M81 (Neill & Shara, 2004) and produced a bulk nova rate 40% higher than previous studies (Shafter, Ciardullo, & Pritchet, 2000). However, we also demonstrated the effects of dust in the disk on the detection of novae in the bulge, implying that our higher bulk rate could be still be low by up to a factor of 2.
Nearby dwarf ellipticals offer relatively dust-free targets that could potentially be surveyed for novae with close to 100% completeness. Yet, if one examines the plot of normalized nova rate versus galaxy luminosity, such as presented in the references above, it is clear that at the low luminosity end, there is much uncertainty. This is for obvious reasons. In particular, low luminosity systems produce few novae per year and so the sample is small. The low luminosity systems must be nearby and so are often very large and difficult to survey in their entirety (e.g. M33, LMC, SMC).
We took advantage of the availability of telescope time on an hourly basis, provided by the Tenagra observatory, to perform a comprehensive, nightly survey of four local group dwarf galaxies with the aim of refining the nova rates at the low luminosity end. We surveyed M32, NGC 205, NGC 147, and NGC 185 for over four months every clear night. We are also surveying the LMC with a different telescope, and will present the results from that survey in a subsequent paper.
These surveys will continue for several years and will provide accurate nova rates for the low luminosity systems, allowing us to determine if there is indeed a trend in nova rate with luminosity. In order to constrain binary formation and evolution theory, this kind of survey must be accompanied by comprehensive, densely time-sampled surveys of higher mass galaxies. Only by removing systematic biases can we determine if there is a universal nova rate per unit luminosity, or if the nova rate is influenced by the mass of the host galaxy.
2 Observations
We used the SITe based 1024x1024 pixel CCD camera on the Tenagra 0.8 m telescope for our observations of the local group dwarfs. This configuration yields a pixel scale of 0”.87 px-1 and a field size of 15’ on a side, allowing us to cover each galaxy in its entirety for each epoch of observation.
The majority of the survey observations were taken through a standard Johnson V filter. This filter was chosen to maximize the sensitivity of the telescope and detector combination. Once a nova was discovered, we initiated additional observations through the standard Johnson B filter to derive nova colors. Each individual exposure was 300s, except for M32 which required a shorter exposure time of 150s to avoid saturating the nuclear region. We attempted to have 15 minutes total exposure time per epoch. Most epochs reached this goal, with only a few having less exposure time. The seeing for our observations had a median of 2”.5 and ranged from 1”.7 to 4”.5.
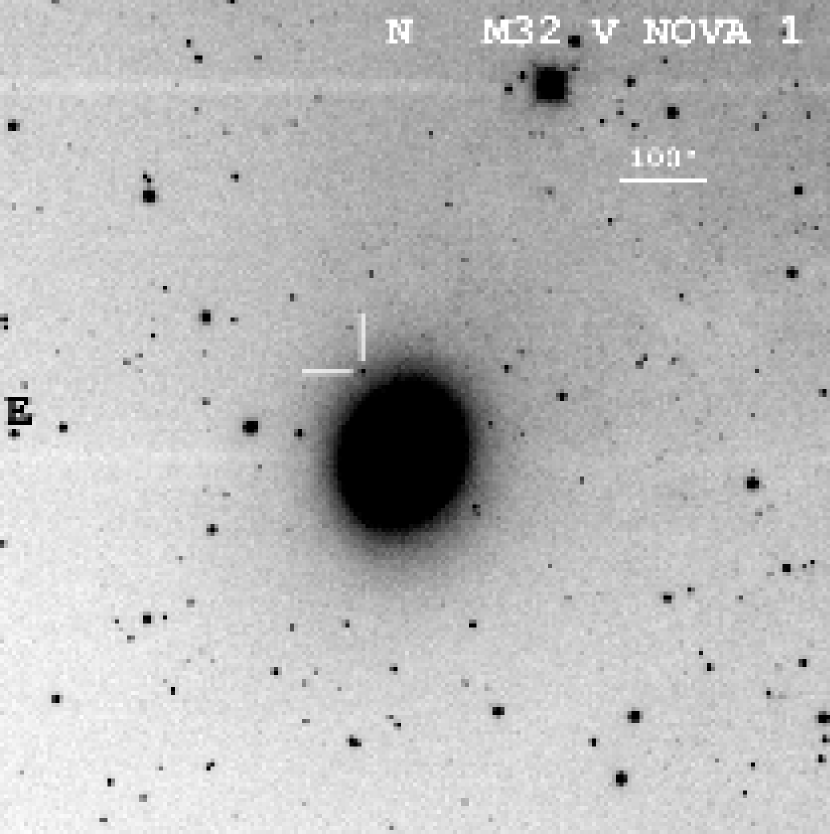
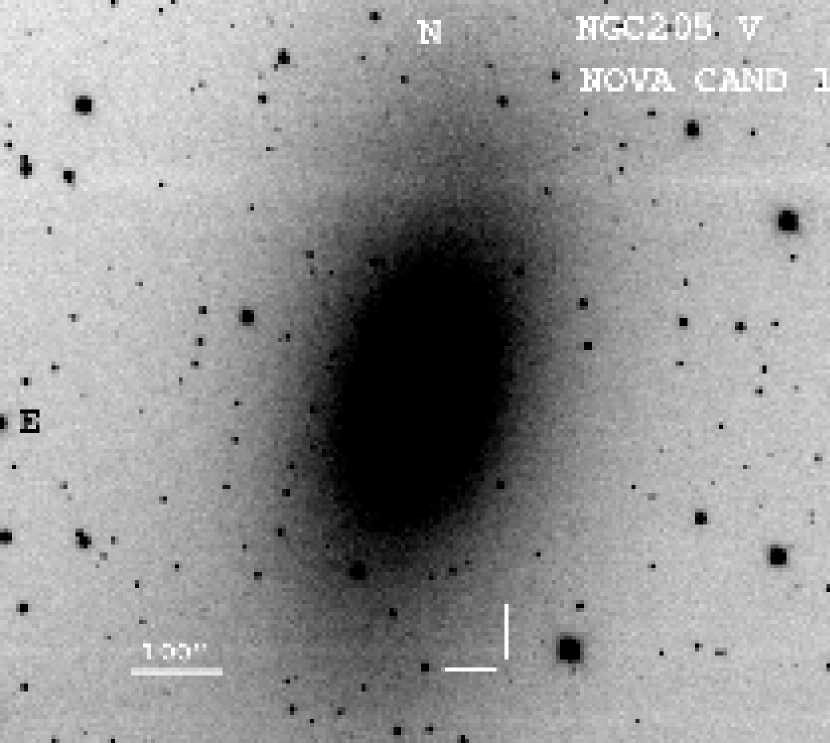
Our survey ran from October 04, 2003 (JD 2452916.8) to February 18, 2004 (JD 2453053.6) covering a total of 136.8 days. An additional epoch in the I-band was generously obtained for us by John Thorstensen using the Echelle direct CCD camera on the Hiltner 2.4m telescope. In addition, he was able to obtain two spectra using the Modspec on the 2.4m on JD 2453017.60 and two spectra on JD 2453022.60, allowing us to confirm the nature of the M32 nova. We were also fortunate that HST images were available in the archive of both nova positions111 Observations made with the NASA/ESA Hubble Space Telescope, obtained from the data archive at the Space Telescope Science Institute. STScI is operated by the Association of Universities for Research in Astronomy, Inc. under NASA contract NAS 5-26555.. For M32 nova 1 we used WFPC2 images taken on JD 2449622 (proposal ID 5464, PI Rich). For NGC 205 nova candidate 1 we used an ACS WFC image taken on JD 2452525 (proposal ID 9448, PI Ferrarese). We also used a 4m MOSAIC image from the NOAO science archive taken on JD 2452528 (PI Massey). Table 1 summarizes all the observations presented in this paper.
3 Reductions
All Tenagra exposures were bias subtracted and flat fielded using the standard tools in IRAF (Tody, 1986). The exposures for a given epoch (6 for M32, 3 for the others) were then registered and combined to produce a coadded image for each epoch using the following DAOPHOT programs (Stetson, 1987): DAOPHOT to measure the point sources, DAOMATCH and DAOMASTER to derive and refine the transformations, and MONTAGE2 to perform the registration and coaddition. The registration master was chosen to be the best coadded image from the entire set for a given galaxy based on measurements of the seeing in each coadded image over the entire survey. The coaddition process removed all but a few cosmic rays.
The HST images were downloaded from the archive in reduced form. The only processing that was required was to coadd the WFPC2 images to remove cosmic rays. The images were already registered, so this task was easily achieved using the STSDAS wfpc2 combine task. The image from the NOAO science archive required no processing.
The spectra were extracted using the IRAF apsum task, wavelength calibrated using calibration lamps and night sky lines, and flux calibrated using flux standard observations with the same configuration. The wavelengths are accurate to better than 1Å, but the fluxes are probably only good to about 20% due to unknown slit losses.
4 Nova Detection
The coadded Tenagra images were blinked against each other to detect changing point sources. Nova candidates were required to be observed in at least two epochs and to be missing on an epoch of sufficient depth coverage to confirm its transient nature. We also used the raw images for an epoch to confirm the presence of the candidate in each individual frame. As a further verification, we checked the images from the archives listed in Table 1, and images from the Digitized Sky Survey222 The Digitized Sky Survey was produced at the Space Telescope Science Institute under U.S. Government grant NAG W-2166. The images of these surveys are based on photographic data obtained using the Oschin Schmidt Telescope on Palomar Mountain and the UK Schmidt Telescope. The plates were processed into the present compressed digital form with the permission of these institutions..
For the regions of our target galaxies near the nuclei, where the intensity gradient makes detection more difficult, we used the spatial filtering technique described in Neill & Shara (2004), allowing us to detect novae to within 10” of the nuclei of M32 and NGC 205 and to within 2” of the centers of NGC 147 and NGC 185. This subtraction technique was performed on each coadded image after which they were blinked against each other. For each coadded image of each galaxy we determined the frame limit by using artificial stars and the exact techniques outlined above for detecting the novae.
5 Nova Photometry
Since crowding was not an issue, DAOPHOT aperture photometry was used to measure point source brightnesses in each coadded image. Variable seeing was accounted for by setting the measurement aperture radius in each image to 1/2 the FWHM of the stellar profile to maximize the signal-to-noise ratio. The FWHM was measured from a set of well exposed, isolated stars in each image.
Calibration required the use of a diverse set of references. For M32, we used the study of Magnier et al. (1992) which presents BVRI CCD photometry for 361,281 objects in the field of M31 and also includes M32. For NGC 205, the BVRI photometry published in Lee (1996) was used. NGC 147 and NGC 185 were both calibrated using V-band photometry presented in the study of Nowotny el al. (2003). These studies all made corrections for galactic extinction. In all cases, the epoch with the best photometric conditions was calibrated using stars in common with the references above and then all other epochs were calibrated to the reference epoch. The number of objects used in the calibrations were as follows: over 100 for M32, 8 for NGC 205, 21 for NGC 147, and 19 for NGC 185. In all cases we achieved a photometric accuracy of 0.1 magnitude or better in all filters.
We measured stars in the HST images using very small apertures (1.6px for the WFPC and 1.08px for the ACS). This avoided contamination from cosmic rays (in the ACS image) and contamination due to the crowding at faint magnitudes for both of these images. Instead of determining aperture corrections and using the standard photometric calibration, we chose to use calibrated reference stars to bootstrap the calibration of our observed magnitudes. We used the same references we used to calibrate the Tenagra images, with considerably fewer objects, due to their smaller fields of view. For M32, only one of the reference stars was available for photometric calibration, while for NGC 205 six stars were available. The NGC 205 calibration has an RMS scatter of 0.2 magnitudes in the V-band. We assume that the calibration for M32 has a similar error. We checked our calibration against the photometric calibrations from the HST image headers and they agree to within the uncertainties in determining the aperture corrections.
6 The Light Curves
Figure 3 presents the calibrated light curve for M32 nova 1, and Figure 4 presents the calibrated light curve for NGC 205 nova candidate 1. The frame limits are plotted as short horizontal lines with downward pointing arrows, while the open points with error bars are the observations from Tables 3 and 4.
A simple linear fit was made to the decline portion of each light curve in V to calculate the decline rate in day-1. The thin lines in Figure 3 and Figure 4 show the resulting fits. Table 5 presents the properties of the light curves including the rise time and decline rate for each object. The minimum magnitudes were determined from HST observations (see §7).
We calculated the average BV color of the novae over the time that they were observed in two colors and present the results in Table 5, column 5. For M32 nova 1, we used the 9 epochs for which B and V were observed on the same night. This gave BV = 0.140.08, which is typical of novae near maximum. Because of bad weather, and the faintness of NGC 205 nova candidate 1, we were unable to get simultaneous B and V measurements. The color we report was derived by using the one B measurement on MJD 53047 and subtracting the average of the two V points on MJD 53046 and MJD 53049. The resulting color for NGC 205 nova candidate 1 is redder than a typical nova (BV = 1.040.15), but this could easily be due to short timescale fluctuations during the decline phase.
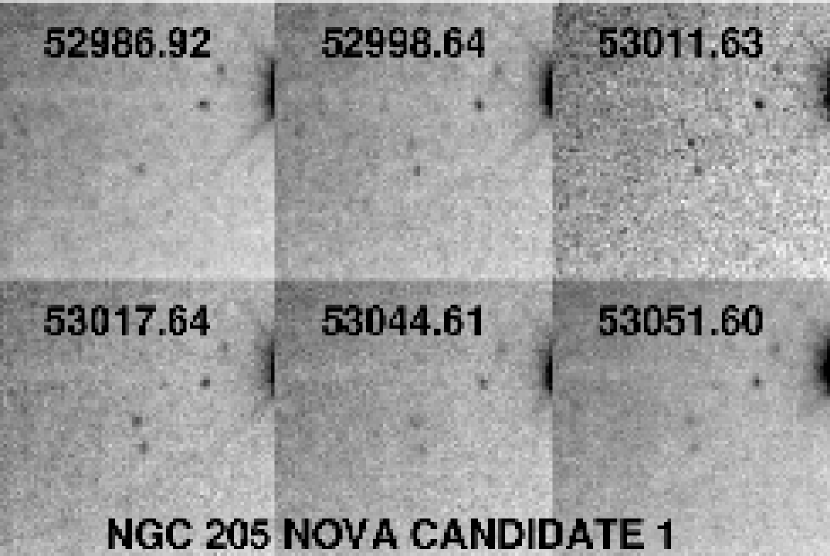
The light curve of the nova candidate in NGC 205 has a few unusual features. It has a long rise time, and it never reaches an intrinsic luminosity greater than M5.1, which is low for a nova. Bad weather produced less than optimal coverage near the peak and we had to conclude our survey before the candidate had completely faded. Classical novae have been observed to rise quite slowly (see, e.g., nova 29 in Arp 1956) and can have quite inhomogeneous light curves (Arp, 1956). If we missed the true peak of the candidate and it was only 0.5 mag higher this object would be in the range of the lowest luminosity novae. Also due to incomplete coverage of the decline portion, the decline rate for this candidate is uncertain and could have been much slower. To bolster the reality of this nova candidate we present a sample of zoomed V-band images in Figure 5 that span the light curve. Each image is labeled with the MJD and can be compared with photometry in Table 4.
7 Verifying the Novae
In order to have confidence in our derived nova rates for these galaxies, it is crucial that we be sure that the objects we discovered are indeed novae and not some other kind of variable. Spectroscopy is the best way to verify a nova because of the telltale broad H emission lines. Another way is to place a limit on the amplitude of the outburst.
7.1 Verifying M32 Nova 1
Our spectral observations of M32 nova 1 confirm that it is indeed a nova. They show broad H and H in emission with a velocity of expansion of 640 km s-1, typical of a slow classical novae. Figure 6 shows the spectrum taken on JD 2453017.60, roughly ten days after maximum. Emission lines of Fe II can be seen just red-ward of H which is also consistent with it being a typical slow nova. A spectrum taken five days later is nearly identical, an indication of the slow spectral evolution of this nova.
Because M32 is superposed on the outer disk of the larger M31, we also wanted to confirm that this nova did indeed originate in M32. We measured the systemic heliocentric radial velocity of the nova from the H lines and found it to have a velocity of 170 6 km s-1. This is consistent with the radial velocity of M32 (200 6 km s-1, Sandage & Tammann 1981), if we account for the velocity dispersion of M32 at a radius of 78”. The radial velocity of M31 is 297 1 km s-1 (Sandage & Tammann, 1981). The part of M31’s disk upon which M32 is superposed is where most of the disk’s rotation velocity would be transverse to the line of sight and therefore could not make up the difference in velocity between M31 and the nova. This, combined with the proximity of the nova to the nucleus of M32, argues against it originating in M31.
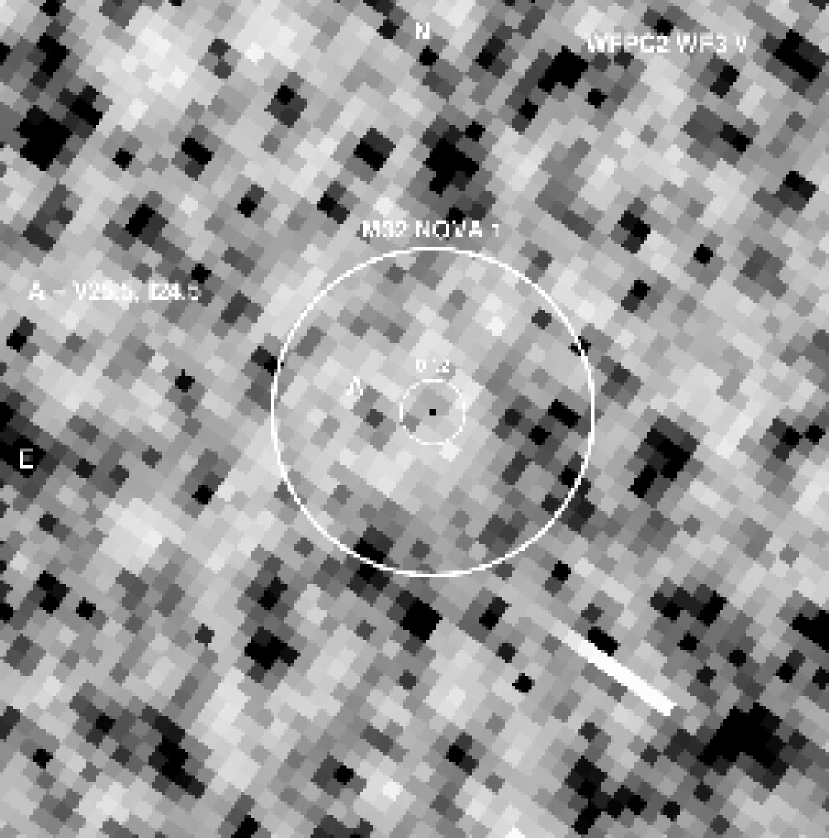
In addition to these spectral confirmations, we also put a limit on the nova outburst amplitude. To do this, we used the HST WFPC2 observations in V (F555W) taken nearly a decade prior to outburst. We also used the I (F814W) and F1042M images to verify that the progenitor was not a bright red variable. The nova position in all these filters was in the WFPC2 chip WF3.
There were not enough stars in common with our Tenagra observations to allow the precise determination of the position of the nova in the WF3 images directly. We solved this by using the 4m 8k MOSAIC image from the NOAO archive which went deep enough to pick up a significant number of stars from the WF3 images. First, we registered the MOSAIC image to the WF3 image using 17 stars in common with the IRAF geomap task. This produced a transformation fit with a root mean square (RMS) of 1.0 WF3 pixels. We refined this transformation locally, in the region of the nova, in the following way. We registered the MOSAIC image to the WF3 image using the above transformation. We then extracted a small subimage surrounding the position of the nova (75x87 WF3 pixels) in the MOSAIC and the WF3 image. The WF3 subimage was convolved with a Gaussian to match the point spread function (PSF) of the MOSAIC image. These two images were then cross correlated to detect any offset. An offset in x of 0.35 px, and in y of -0.70 px, was detected with an accuracy of 0.05 WF3 pixels, which improved the transformation locally by at least a factor of ten.
We then produced a transformation from each of 14 Tenagra images (with the nova well observed) to the MOSAIC image using over 400 stars in common. This produced transformations with a typical RMS of less than 0.001 MOSAIC pixels. We used the same cross-correlation technique described above but were unable to detect any local offset in these transformations. We transformed the nova positions to the MOSAIC coordinate system and then used the MOSAIC to WF3 transformation, plus the detected offsets, to put the nova positions in the WF3 coordinate system to better than 0.1 WF3 pixels. We then used an error weighted average of the 14 positions to get a final position in the WF3 images. This position had an RMS of 0.04 WF3 pixels.
Figure 7 shows the region in the WF3 V image surrounding the nova, with a field of view of 3 arcseconds on a side. We do not convincingly detect the progenitor of M32 nova 1. The star indicated by the letter A is at V of 25.5 and I of 24.5, but is well outside the position error circle defined by the RMS of the nova positions. We estimate that the progenitor of this nova was fainter than V of 26.0 at the epoch that these data were taken. This gives an amplitude of at least 8.7 magnitudes in V for the nova outburst. The WFPC2 I and F1042M images were well registered with the V image and nothing was detected in them at the position of the nova. We conclude, therefore, that M32 nova 1 could not be a bright red variable and is, indeed, a nova.
7.2 Verifying NGC 205 Nova Candidate 1
This variable presented more of a challenge. Its faintness precluded spectral observations with the MDM 2.4 m. In this case, the HST observations were examined in an attempt to bolster the nova classification by constraining the outburst amplitude. We were fortunate that the ACS WFC observations of this area included 19 to 21 stars that could be used to directly register the Tenagra images. We chose 5 of these images, in which the candidate was well observed, to register to the ACS image. Before centroiding objects in the ACS image, we convolved it with a Gaussian of appropriate width to bring the ACS resolution down to the resolution of the Tenagra images. The IRAF task geomap was used to calculate the transformations using a 2nd order polynomial including cross terms. The average RMS for the 5 transformations was 2 ACS pixels in x and y. We used these transformations to place the candidate in the ACS WFC image. We then calculated the error-weighted average position for the candidate ACS position which had an RMS of 6.4 ACS pixels. To check for local offsets we used two stars within 25” of the candidate that were visible in both the Tenagra and the ACS image. We checked the transformed positions of these stars and computed their error weighted average position, which had an RMS of 2.0 ACS pixels. These average positions showed no local offset with respect to the ACS to 0.5 ACS pixels. The larger scatter in the candidate positions is due to the faintness of the candidate compared with the stars we used for registration.
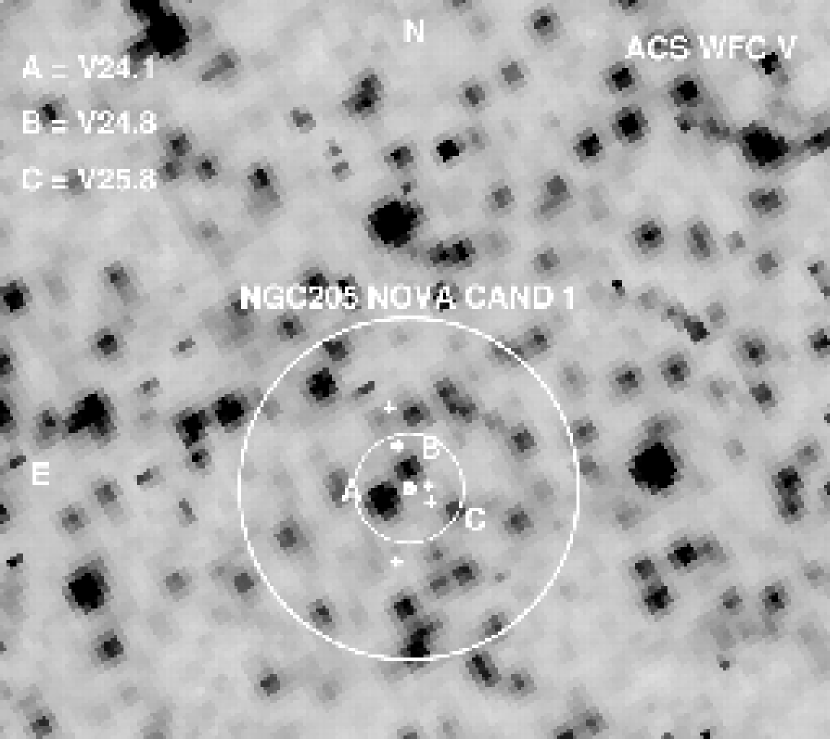
Figure 8 shows the position of the candidate nova in the ACS WFC V (F606W) image, with a 5 arcsecond field of view. The crosses mark the five transformed candidate positions and the smallest circle marks the error-weighted centroid of these positions. The next larger circle shows the RMS error circle for the nova candidate positions and the largest circle is 1 arcsecond in radius. The three stars within the RMS error circle have V magnitudes of 24.1, 24.8, and 25.8. The progenitor of the outbursting object we observed could conceivably be anywhere within the RMS error circle and therefore we place a lower limit on the outburst amplitude using the brightest of the three stars. This gives a limit of 4.6 Vmag for the outburst amplitude of the nova candidate. If star A were in fact the variable that produced our nova candidate detection it would have an absolute V magnitude in quiescence of at the distance of NGC 205.
There are few variables with amplitudes of 4.6 magnitudes or greater, but we must consider each in turn. The shape of the light curve eliminates background supernovae since the rise appears slower than the decline. The peak magnitude of is too high for a Mira-type variable in NGC 205 and is too low for a Hubble-Sandage variable in NGC 205. The light curve also eliminates a foreground dwarf nova since these exhibit rise rates much higher than we observe.
A more likely alternative to the nova classification is a microlensing event. The flattening of the light curve after the initial rise starting at JD 2453010 would argue against this classification, however the errors are too large and the coverage near the peak is not good enough to be sure. We must resort to a statistical argument to bolster the claim that this was not a lensing event.
In a recent paper reporting the results of a microlensing survey of M31, Uglesich et al. (2004) found 4 genuine events in 200 epochs over a 3 year campaign covering 560 arcmin2 with 1.3 m and 1.8 m telescopes. de Jong et al. (2004) report finding 14 microlensing candidate events in M31 in 100 epochs over a 2 year study covering 0.57 square degrees with a 2.5 m telescope. These studies were concentrated near the center of M31 and comprised a total of over 300 epochs. Our study covered 196 arcmin2 with a 0.8 m telescope and covered 90 epochs. Ignoring the effects of telescope size and the number of lenses and targets in the survey areas, we can divide out the areal coverage and number of epochs and compute that we would see about 1 event in our survey. A more realistic measure of the microlensing rate in our survey would have to account for the shallower frame limits provided by a smaller telescope and the much lower number of M31 halo lenses due to the distance from M31 (36.5 arcmin) and the much lower mass of NGC 205. These factors reduce the microlensing rate in our survey by over two orders of magnitude and make it very unlikely that the variable in NGC 205 is a microlensing event.
While the classification of the variable in NGC 205 is not ironclad, it appears that a classical nova is the most likely one. Because of the uncertainty, we will compute nova rates both with and without the nova candidate in the following sections.
8 The Nova Rate
A raw bulk nova rate for each galaxy can be obtained simply by dividing the observed number of novae that erupted during the survey by the time covered. This gives yr yr-1 for M32 and yr yr-1 for NGC 205 (this becomes an upper limit without the nova candidate). For NGC 147 and NGC 185 we can place a limit on the nova rate by saying that it is no greater than the inverse of the survey time. For NGC 147 this gives yr yr-1 and for NGC 185 this gives yr yr-1.
8.1 The Monte Carlo Approach
Shafter & Irby (2001) describe a Monte Carlo technique which uses the maximum magnitudes and decline rates of novae and their survey faint limit to find the most probable nova rate in their survey region. We used the V-band maximum magnitudes and decline rates reported in Arp (1956), and Rosino (1973), combined with our individual epoch frame limits, to perform a similar Monte Carlo experiment to derive nova rates for each galaxy we observed.
This technique makes many independent estimates of the observed nova rate in the given galaxy as a function of the true nova rate . For a given trial estimate of , the true rate, we choose a random set of novae (which specify the maximum magnitudes and decline rates of real novae) and outburst times and use the frame limits to calculate the number of observed novae, using the candidate criteria described above. We repeat this 105 times and record how many times we recover the number of nova candidates actually observed in that galaxy. The estimate of the true nova rate is then incremented and the process is repeated. This produces a probability distribution for in the given galaxy. The best estimate for is that which corresponds to the peak of this distribution.
Figure 9 shows the probability distributions for each galaxy. The shapes of the probability distributions depend on the number of novae observed in each galaxy and the temporal distribution and depths of the galaxy’s survey epochs. The range encompassing half of the probability distribution surrounding the peak is indicated by the solid horizontal lines and defines the error limits for the bulk nova rates reported in the figure. For NGC 205, we overplotted the ’no nova’ probability distribution as the thinner solid line.
Column 2 of Table 6 presents the results of the simulations for each of the galaxies. A total value for all the local group dwarf ellipticals surveyed is presented at the bottom of the table both with and without the nova candidate in NGC 205.
8.2 The Luminosity Specific Nova Rate
To facilitate the comparison of nova rates across a broad range of galaxy luminosities a suitable normalization must be found. The infrared is used as a measure of stellar mass to avoid large fluctuations due to a few bright blue stars. The 2MASS offers a consistent photometric system for this normalization, however Ferrarese, Côté, & Jordán (2003) found discrepancies between the K-band magnitudes from the 2MASS Large Galaxy Atlas (Jarrett et al., 2003) and those derived from integrated optical magnitudes and optical to infrared colors. We chose to use the integrated, extinction corrected V-band magnitudes from de Vaucouleurs et al. (1991) and (VK)0 colors from Aaronson (1978) and Frogel, Persson, Matthews, & Aaronson (1978) to perform our normalization.
Table 6 lists the relevant data and references for M81 and the four dwarf ellipticals of this study. We included the 2MASS K-band magnitudes, after correcting for galactic extinction, to compare with the K-band magnitudes derived from the optical magnitudes and colors. The difference is 0.36 mag for M32 and 0.29 mag for NGC 205, illustrating the discrepancy. No (VK)0 colors were available for NGC 147 and NGC 185, so we adjusted K2MASS,0 by the 0.2 magnitude systematic offset between the two systems found by Ferrarese, Côté, & Jordán (2003). To arrive at the LSNR, the bulk nova rates are divided by the K-band luminosities, expressed in 10.
We plot our results, and the result for M81 from Neill & Shara (2004), as open diamonds in Figure 10 along with data from Ferrarese, Côté, & Jordán (2003), Table 5, plotted as small filled circles. The two discrepant points for M33 are connected with a dotted line. The upper limits for NGC 147, NGC 185, and NGC 205 are plotted as short horizontal lines with a downward pointing arrow. The open triangle is the point from this study for all the dwarf ellipticals assuming the nova candidate in NGC 205 was misclassified. The horizontal dashed line is the average luminosity specific nova rate (LSNR) from Ferrarese, Côté, & Jordán (2003).
The LSNR for all the dEs that includes the nova candidate in NGC 205 of 14.1 yr is 2.5 higher than the constant LSNR derived in Ferrarese, Côté, & Jordán (2003) of 1.580.16 yr. The LSNR without the nova candidate in NGC 205 of 7.0 yr is only 1.1 higher. These numbers are suggestive of a possible increase in the nova rate for lower mass systems, but at this point no conclusions can be drawn. If a higher rate for the Local Group dEs is verified in future surveys there are two possible explanations. Either the interacting binary fraction is higher for these systems than for higher mass systems, or the completeness is higher due to their proximity and lack of dust.
9 Future Work
It is important to improve the statistics for these low mass, nearby systems. We will continue to monitor M32, NGC 205, NGC 147, and NGC 185 for several years. The nova candidate we discovered in NGC 205 would be the lowest luminosity nova ever seen, if verified. It is possible this nova candidate represents a population of low luminosity novae with M -5.0. The implication is that faint novae are being missed in surveys of more distant, larger, and dustier systems producing a systematic underestimate of the nova rates in these systems. It is crucial to continue to survey nearby systems where we can more easily detect these low luminosity novae and to acquire a spectrum during outburst of one of them to verify the nova classification.
Eliminating systematic errors in bulk nova rates is essential to using the LSNR vs. luminosity diagram to determine the factors that influence the formation and evolution of the close, interacting binaries that produce novae. With large-format cameras and the availability of service telescope time on a nightly basis, we can determine precise nova rates and distributions for these nearby small systems. We must also complement this with the best rates and distributions possible for larger, more distant systems. If the low luminosity nova candidate we discovered in NGC 205 represents a new nova population, we must be sure to sample this population in nova surveys of the larger, more distant systems. This will be observationally expensive.
10 Conclusions
1. Using the Monte Carlo technique we derive a bulk nova rate for M32 of 2 yr-1 and for NGC 205 of 2 yr-1. We could not verify the nova candidate in NGC 205 conclusively and so we also report upper limits on the bulk nova rates based on Monte Carlo simulations for NGC 205 of 1.5 yr-1, for NGC 147 of 2 yr-1, and for NGC 185 of 1.8 yr-1. We also calculated a combined bulk nova rate for the four dEs of 4 yr-1 (2 yr-1 without the NGC 205 nova candidate).
2. Using VT,0 magnitudes and (VK)0 colors to derive K-band luminosities to normalize these rates produces an LSNR for M32 of 12.0 yr, and for NGC 205 of 29.3 yr. We also report upper limits on the LSNR for NGC 205 of 22.0 yr without the nova candidate, for NGC 147 of 89.0 yr, and for NGC 185 of 67.0 yr. Using the combined bulk rate and the combined K-band luminosity of the four dEs we report an LSNR of 14.1 yr for the total (7.0 yr without the NGC 205 nova candidate). These total LSNRs are marginally higher than predicted by extrapolating a constant LSNR determined at high luminosities to low luminosities.
References
- Aaronson (1978) Aaronson, M. 1978, ApJ, 221, L103
- Arp (1956) Arp, H. C. 1956, AJ, 61, 15
- della Valle et al. (1994) della Valle, M., Rosino, L., Bianchini, A., & Livio, M. 1994, A&A, 287, 403
- de Vaucouleurs et al. (1991) de Vaucouleurs, G., de Vaucouleurs, A., Corwin, H. G., Buta, R. J., Paturel, G., & Fouque, P. 1991, Volume 1-3, XII, 2069 pp. Springer-Verlag Berlin Heidelberg New York
- Ferrarese, Côté, & Jordán (2003) Ferrarese, L., Côté, P., & Jordán, A. 2003, ApJ, 599, 1302
- Freedman et al. (2001) Freedman, W. L. et al. 2001, ApJ, 553, 47
- Frogel, Persson, Matthews, & Aaronson (1978) Frogel, J. A., Persson, S. E., Matthews, K., & Aaronson, M. 1978, ApJ, 220, 75
- Grillmair et al. (1996) Grillmair, C. J. et al. 1996, AJ, 112, 1975
- Han et al. (1997) Han, M., Hoessel, J. G., Gallagher, J. S., Holtsman, J., & Stetson, P. B. 1997, AJ, 113, 1001
- Jarrett et al. (2003) Jarrett, T. H., Chester, T., Cutri, R., Schneider, S. E., & Huchra, J. P. 2003, AJ, 125, 525
- de Jong et al. (2004) de Jong, J. T. A., et al. 2004, A&A, 417, 461
- Lee, Freedman, & Madore (1993) Lee, M. G., Freedman, W. L., & Madore, B. F. 1993, AJ, 106, 964
- Lee (1996) Lee, M. G. 1996, AJ, 112, 1438
- Magnier et al. (1992) Magnier, E. A., Lewin, W. H. G., van Paradijs, J., Hasinger, G., Jain, A., Pietsch, W., & Truemper, J. 1992, A&AS, 96, 379
- Neill & Shara (2004) Neill, J. D. & Shara, M. M. 2004 AJ, 127, 816
- Nowotny el al. (2003) Nowotny, W., Kerschbaum, F., Olofsson, H., & Schwarz, H. E. 2003, A&A, 403, 93
- Rosino (1973) Rosino, L. 1973, A&AS, 9, 347
- Sandage & Tammann (1981) Sandage, A. & Tammann, G. A. 1981, Carnegie Inst. of Washington, Publ. 635
- Schlegel, Finkbeiner, & Davis (1998) Schlegel, D. J., Finkbeiner, D. P., & Davis, M. 1998, ApJ, 500, 525
- Shafter, Ciardullo, & Pritchet (2000) Shafter, A. W., Ciardullo, R., & Pritchet, C. J. 2000, ApJ,530, 193
- Shafter & Irby (2001) Shafter, A. W. & Irby, B. K. 2001, ApJ, 563, 749
- Stetson (1987) Stetson, P. B. 1987, PASP, 99, 191
- Tody (1986) Tody, D. 1986, Proc. SPIE, 627, 733
- Uglesich et al. (2004) Uglesich, R. R., Crotts, A. P. S., Baltz, E. A., de Jong, J., Boyle, R. P., & Corbally, C. J. 2004, ApJ, 612, 877


| Epochs | Exp. | Start | End | Span | Novae | ||
|---|---|---|---|---|---|---|---|
| Galaxy | Filter | (N) | (s) | (MJD) | (MJD) | (days) | (N) |
| Tenagra 0.8m Observations | |||||||
| M32 | V | 90 | 900 | 52916.83 | 53046.60 | 129.8 | 1 |
| B | 14 | 900 | 53015.63 | 53037.64 | |||
| NGC 205 | V | 89 | 900 | 52916.83 | 53053.60 | 136.8 | 1 |
| B | 2 | 900 | 53047.61 | 53048.60 | |||
| NGC 147 | V | 78 | 900 | 52927.73 | 53042.62 | 114.9 | 0 |
| NGC 185 | V | 84 | 900 | 52927.79 | 53045.62 | 117.8 | 0 |
| MDM 2.4m Observations | |||||||
| M32 | I | 1 | 60 | 53014.70 | 1 | ||
| Spec | 2 | 960 | 53017.6 | 53022.6 | 5.0 | 1 | |
| HST WFPC2 Observations | |||||||
| M32 | F555W | 1 | 1600 | 49622.9 | 0 | ||
| F814W | 1 | 1200 | 49622.9 | 0 | |||
| F1042M | 1 | 3000 | 49622.9 | 0 | |||
| KPNO 4m Observations | |||||||
| M32 | V | 1 | 2400 | 52528.3 | 0 | ||
| HST ACS Observations | |||||||
| NGC 205 | F606W | 1 | 497 | 52525.8 | 0 | ||
| Position | |||||
|---|---|---|---|---|---|
| (J2000) | Nuclear Distance | ||||
| Galaxy | Object | RA | Dec | Detections | (arcsec) |
| M32 | Nova 1 | 00 42 44.991 | +40 53 04.76 | 33 | 78 |
| NGC 205 | Nova Cand 1 | 00 40 15.216 | +41 37 29.68 | 24 | 230 |
| Fr. Limit | ||||||||||
|---|---|---|---|---|---|---|---|---|---|---|
| Nova | MJD | Err() | MJD | Err() | MJD | Err() | ||||
| M32 1 | 52998.62 | 20.96 | ||||||||
| 53000.65 | 20.59 | |||||||||
| 53001.63 | 20.50 | |||||||||
| 53002.61 | 20.50 | |||||||||
| 53009.62 | 17.28 | 0.08 | 20.21 | |||||||
| 53010.62 | 17.40 | 0.08 | 19.28 | |||||||
| 53011.62 | 17.43 | 0.07 | 20.54 | |||||||
| 53013.62 | 17.45 | 0.08 | 20.63 | |||||||
| 53014.70 | 17.30 | 0.02 | ||||||||
| 53015.62 | 17.63 | 0.10 | 19.90 | 53015.63 | 17.70 | 0.07 | ||||
| 53016.60 | 17.59 | 0.09 | 20.85 | 53016.62 | 17.72 | 0.06 | ||||
| 53017.60 | 17.80 | 0.12 | 20.97 | 53017.62 | 17.87 | 0.07 | ||||
| 53018.62 | 19.24 | 53018.64 | 18.50 | 0.19 | ||||||
| 53020.60 | 18.13 | 0.15 | 20.44 | 53020.62 | 18.31 | 0.11 | ||||
| 53021.61 | 18.38 | 0.18 | 20.72 | 53021.63 | 18.56 | 0.11 | ||||
| 53022.60 | 18.19 | 0.18 | 20.88 | 53022.61 | 18.22 | 0.10 | ||||
| 53023.60 | 18.57 | 0.22 | 19.74 | 53023.61 | 18.69 | 0.18 | ||||
| 53031.61 | 18.77 | 0.26 | 19.84 | 53031.63 | 19.02 | 0.27 | ||||
| 53032.59 | 18.80 | 0.27 | 19.85 | 53032.60 | 19.05 | 0.24 | ||||
| 53033.60 | 18.80 | |||||||||
| 53034.59 | 18.85 | 0.39 | 19.34 | |||||||
| 53035.59 | 18.91 | 0.34 | 19.61 | |||||||
| 53037.61 | 19.19 | 0.56 | 19.12 | |||||||
| 53038.59 | 19.55 | 0.58 | 19.44 | |||||||
| 53042.60 | 19.25 | 0.52 | 19.66 | |||||||
| 53043.60 | 19.35 | 0.54 | 20.74 | |||||||
| 53044.60 | 19.27 | 0.53 | 20.71 | |||||||
| 53045.60 | 19.32 | 0.47 | 20.86 | |||||||
| 53046.60 | 19.27 | 0.54 | 20.81 |
| Fr. Limit | |||||||
|---|---|---|---|---|---|---|---|
| Nova | MJD | aaDerived from archival HST observations, see §7 | Err() | MJD | Err() | ||
| NGC 205 1 | 52986.92 | 21.45 | |||||
| 52987.63 | 20.38 | ||||||
| 52988.63 | 20.97 | ||||||
| 52989.64 | 19.87 | ||||||
| 52990.64 | 20.44 | ||||||
| 52991.63 | 20.63 | ||||||
| 52992.63 | 21.09 | 0.39 | 20.68 | ||||
| 52993.65 | 21.01 | 0.35 | 20.63 | ||||
| 52994.66 | 21.52 | 0.41 | 21.08 | ||||
| 52996.66 | 19.04 | ||||||
| 52998.64 | 20.71 | 0.20 | 21.07 | ||||
| 53000.67 | 20.63 | ||||||
| 53001.66 | 20.59 | ||||||
| 53002.64 | 20.45 | 0.22 | 20.50 | ||||
| 53009.63 | 20.23 | 0.25 | 20.17 | ||||
| 53010.63 | 20.23 | 0.31 | 19.99 | ||||
| 53011.63 | 19.99 | 0.13 | 20.54 | ||||
| 53013.64 | 20.19 | 0.17 | 20.55 | ||||
| 53016.64 | 20.24 | 0.17 | 20.73 | ||||
| 53017.64 | 20.02 | 0.11 | 20.93 | ||||
| 53021.65 | 20.01 | 0.13 | 20.63 | ||||
| 53022.64 | 20.04 | 0.13 | 20.84 | ||||
| 53023.64 | 19.59 | ||||||
| 53024.64 | 17.17 | ||||||
| 53031.66 | 19.46 | ||||||
| 53032.63 | 19.47 | 0.21 | 19.68 | ||||
| 53033.64 | 16.59 | ||||||
| 53034.61 | 19.33 | ||||||
| 53035.61 | 19.57 | ||||||
| 53037.62 | 19.05 | ||||||
| 53042.61 | 20.28 | 0.26 | 20.11 | ||||
| 53043.61 | 20.18 | 0.18 | 20.63 | ||||
| 53044.61 | 20.22 | 0.17 | 20.78 | ||||
| 53045.61 | 20.61 | 0.20 | 21.02 | ||||
| 53046.62 | 20.39 | 0.20 | 20.83 | ||||
| 53047.61 | 21.50 | 0.24 | |||||
| 53048.60 | 21.10 | 0.21 | |||||
| 53049.60 | 20.54 | 0.23 | 20.97 | ||||
| 53050.60 | 19.26 | ||||||
| 53051.60 | 20.39 | 0.18 | 21.06 | ||||
| 53052.60 | 20.50 | 0.23 | 20.68 | ||||
| 53053.60 | 20.52 | 0.20 | 20.96 |
| Decline | |||||||||
|---|---|---|---|---|---|---|---|---|---|
| Max | MinaaDerived from archival HST observations, see §7 | Ampl. | Baseline | Rise Time | Baseline | Pts | Rate | ||
| Object | () | () | () | BV | (days) | (days) | (days) | (N) | ( day-1) |
| M32 Nova 1 | 17.3 | 26.0 | 8.7 | 0.140.08 | 37 | 6 | 37 | 22 | 0.065 |
| NGC 205 Nova Cand 1 | 19.47 | 24.1 | 4.6 | 1.040.15 | 61 | 40 | 21 | 10 | 0.046 |
| Bulk Nova RateaaNova rate references: M81 - Neill & Shara (2004), others - this study | VT,0bbfrom de Vaucouleurs et al. (1991) | (V - K)0ccColor references: M81 - Aaronson (1978), others - Frogel, Persson, Matthews, & Aaronson (1978) | KV,(V-K) | K2MASS,0ddfrom Jarrett et al. (2003), but corrected for reddening using the formula A(K) 0.085A(B) from Schlegel, Finkbeiner, & Davis (1998) with A(B) values from de Vaucouleurs et al. (1991) | (mM)0eeDistance references: M81 - Freedman et al. (2001), M32 - Grillmair et al. (1996), NGC 205 - Lee (1996), NGC 147 - Han et al. (1997), and NGC 185 - Lee, Freedman, & Madore (1993) | LK | LSNR | |
|---|---|---|---|---|---|---|---|---|
| Galaxy | (yr-1) | (mag) | (mag) | (mag) | (mag) | (mag) | () | (yr) |
| M81 | 33 | 6.57 | 3.170.1 | 3.400.1 | 3.8020.018 | 27.800.08 | 12.41.5 | 2.6 |
| M32 | 2 | 7.84 | 3.130.1 | 4.710.1 | 5.0720.017 | 24.430.1 | 0.1670.023 | 12.0 |
| NGC 205 | 2 | 7.97 | 2.120.2 | 5.850.2 | 5.5640.045 | 24.600.3 | 0.06820.0267 | 29.3 |
| 0ffThese are the values assuming that the variable in NGC 205 is not a nova | 22ffThese are the values assuming that the variable in NGC 205 is not a nova | |||||||
| NGC 147 | 0 | 8.93 | 6.90.2ggEstimated from K2MASS,0 and subtracting the 0.2 systematic offset found by Ferrarese, Côté, & Jordán (2003) | 7.1370.063 | 24.390.05 | 0.02240.0047 | 89 | |
| NGC 185 | 0 | 8.55 | 6.30.2ggEstimated from K2MASS,0 and subtracting the 0.2 systematic offset found by Ferrarese, Côté, & Jordán (2003) | 6.4950.051 | 23.960.21 | 0.02690.0082 | 67 | |
| LGdEs | 4 | 0.2840.036 | 14.1 | |||||
| 2ffThese are the values assuming that the variable in NGC 205 is not a nova | 7.0ffThese are the values assuming that the variable in NGC 205 is not a nova |