Indirect Evidence for WIMP Annihilation
from Diffuse Galactic Gamma Rays
Abstract
The EGRET excess in the diffuse galactic gamma ray data above 1 GeV shows all the features expected from Dark Matter WIMP Annihilation: a)it is present and has the same spectrum in all sky directions, not just in the galactic plane. b) The intensity of the excess shows the profile expected for a flat rotation curve outside the galactic disc with additionally an interesting substructure in the disc in the form of a doughnut shaped ring at 14 kpc from the centre of the galaxy. At this radius a ring of stars indicates the probable infall of a dwarf galaxy, which can explain the increase in DM density. From the spectral shape of the excess the WIMP mass is estimated to be between 50 and 100 GeV, while from the intensity the halo profile is reconstructed. Given the mass and intensity of the WIMP’s the mass of the ring can be calculated, which is shown to explain the peculiar change of slope in the rotation curve at about 11 kpc. These signals of Dark Matter Annihilation are compatible with Supersymmetry and have a statistical significance of more than in comparison with a fit of the conventional galactic model to the EGRET data. The statistical significance combined with all features mentioned above provide an intriguing hint that the EGRET excess is indeed a signal from Dark Matter Annihilation.
1 Introduction
Cold Dark Matter (CDM) makes up 23% of the energy of the universe, as deduced from the WMAP measurements of the temperature anisotropies in the Cosmic microwave Background, in combination with data on the Hubble expansion and the density fluctuations in the universe [1]. The Dark Matter (DM) has to be much more widely distributed than the visible matter, since the rotation speeds do not fall off like , as expected from the visible matter in the centre, but stay more or less constant as function of distance. For a ”flat” rotation curve the DM has to fall off slowly, like , instead of the exponential drop-off for the visible matter. The fact that the DM is distributed over large distances implies that its properties must be quite different from the visible matter, since the latter clumps in the centre owing to its rapid loss of kinetic energy by the electromagnetic and strong interactions after infall into the centre. Since the DM apparently undergoes little energy loss, it can have at most weak interactions. In addition its mass is probably large, as deduced from the formation of stars as soon as a few hundred million years after the Big Bang. This time scale of star formation could be deduced from the polarization of the Cosmic Microwave Background, which is thought to originate from Compton scattering of the CMB on the electrons from the ionized plasma in stars[1]. Such an early formation of stars can only be explained, if the DM became non-relativistic in the early universe and started to cluster by gravity after decoupling from other particles roughly 10-9 s after the Big Bang. The baryonic matter fell then into these potential wells of DM after decoupling from the photons 380.000 years after the Big Bang. Given its weak interactions and heavy mass the DM particles are generically called WIMP’s, Weakly Interacting Massive Particles.
According to the rules of particle physics weakly interacting particles can annihilate, yielding predominantly quark-antiquark pairs in the final state, which hadronize into mesons and baryons. The stable decay and fragmentation products are neutrinos, photons, protons, antiprotons, electrons and positrons. From these, the protons and electrons disappear in the sea of many matter particles in the universe, but the photons and antimatter particles may be detectable above the background, generated by particle interactions. Such searches for indirect Dark Matter detection have been actively pursued, see e.g the review by Bergstrm[2] or more recently by Bertone, Hooper and Silk [3].
The present analysis on diffuse galactic gamma rays differs from previous ones by considering simultaneously the complete sky map and the energy spectrum, which allows us to constrain both the halo distribution and the WIMP mass. The WIMP annihilation cross section from cosmology is discussed in Section 2, while the constraints on the mass and the DM halo profile from the EGRET excess are discussed in Section 3, followed by the expectation from Supersymmetry in Section 4. The summary is given in Section 5.
2 DM annihilation cross Section from WMAP and photon flux
In the early universe all particles were produced abundantly and were in thermal equilibrium through annihilation and production processes. At temperatures below the mass of the WIMP’s the number density drops exponentially. The annihilation rate drops exponentially as well, and if it drops below the expansion rate, the WIMP’s cease to annihilate. They fall out of equilibrium (freeze-out) at a temperature of about [4] and a relic cosmic abundance remains.
For the case that is energy independent, which is a good approximation in case there is no coannihilation, the present mass density in units of the critical density is given by [5]:
| (1) |
One observes that the present relic density is inversely proportional to the annihilation cross section at the time of freeze out, a result independent of the WIMP mass (except for logarithmic corrections). For the present value of the thermally averaged total cross section at the freeze-out temperature of must have been around .
From this cross section the differential gamma flux in a direction forming an angle with the direction of the galactic center can be calculated:
| (2) |
where is the branching ratio into the tree-level annihilation final state, while is the differential photon yield for the final state . The WIMP mass density enters critically in the prediction for the flux, since the number of WIMP pairs is equal to . The factor is the boost factor, which represents the local enhancement of the number density with respect to the average by the expected clustering of DM. For the present analysis is assumed to be the same in all directions , although near the centre of the galaxy the DM clusters may have been tidally disrupted by the flyby of nearby stars, thus reducing the boost factor towards the centre. However, this will only modify the density profile near the centre and not affect the overall analysis. Since the average of can be significantly larger than the boost factor can enhance the flux by one or two orders of magnitude[6].
As mentioned above and discussed further in the section on Supersymmetry, the dominant final state is always into quark pairs. These quarks will be mono-energetic, since the non-relativistic WIMP’s annihilate practically at rest. Therefore one has to consider only one final state and the corresponding gamma spectrum from mono-energetic quarks is well known from electron-positron colliders222The annihilation is preferentially into heavy b-quarks, which yield a slightly harder gamma spectrum than the light quarks. This is the spectrum, which will be used. In case of light quarks the fit to the data would require a somewhat heavier WIMP mass to obtain the same spectrum., so in principle the only free parameters left are the WIMP mass, the halo profile, i.e. the distribution of the DM density in space and the boost factor. The EGRET data are precise enough to determine these.
3 Indirect Dark Matter Detection
The neutral particles play a very special role for indirect DM searches, since they point back to the source. The charged particles change their direction by the interstellar magnetic fields, energy losses and scattering. Therefore the gamma rays provide a perfect means to reconstruct the intensity (halo) profile of the DM by observing the intensity of the gamma ray emissions in the various sky directions. Of course, this assumes that one can distinguish between the gamma rays from DMA the ones from the background, which is possible because of the different energy spectra: the gamma rays from the mono-energetic quarks from DMA produce a significantly harder spectrum than the gammas from nuclear interaction, which are produced by the interactions between quarks with a steeply falling power law spectrum ().
The spectral shape of the gamma rays from either the backgrounds or the mono-energetic quarks are well known from accelerator experiments and can be obtained from the well-known PYTHIA code for quark fragmentation[7].
A very detailed gamma ray distribution over the whole sky was obtained by the Energetic Gamma Ray Emission Telescope EGRET, one of the four instruments on the Compton Gamma Ray Observatory CGRO, which collected data during nine years, from 1991 to 2000. The EGRET telescope was carefully calibrated in the energy range of 0.1 to 30 GeV, but using Monte Carlo simulations the energy range was recently extended up to 120 GeV[8] with a correspondingly larger uncertainty, mainly from the self-vetoing of the detector by the back-scattering from the electromagnetic calorimeter into the veto counters for high energetic showers.
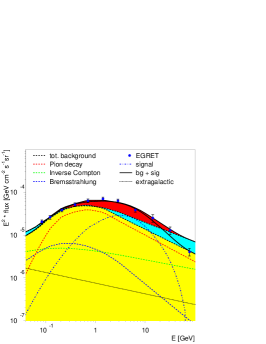
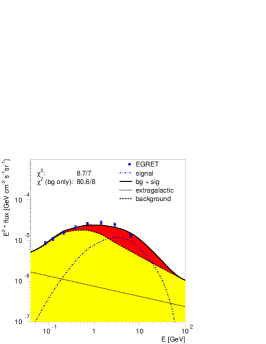
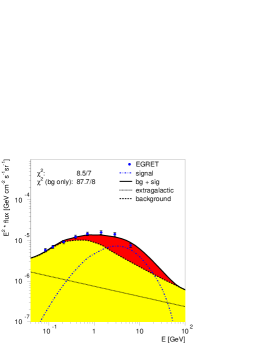
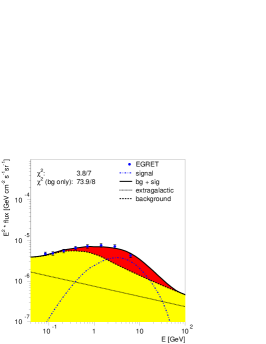
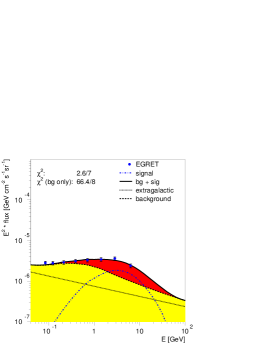
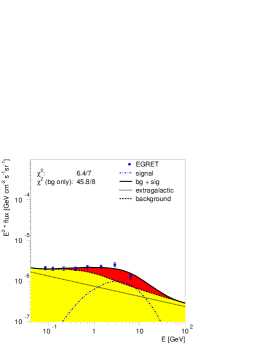
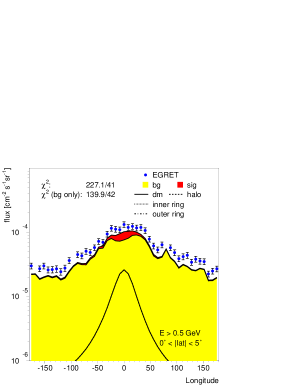
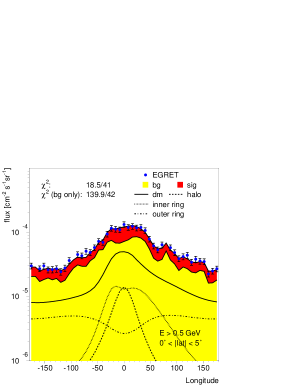
It was already noticed in 1997 that the EGRET data showed an excess in the galactic disk[9] of gamma ray fluxes for energies above 1 GeV if compared with conventional galactic models and repeated later for all sky directions[8]. This analysis was repeated recently[10, 11] using a different analysis technique on the publicly available EGRET data, namely by comparing the data not with the absolute fluxes from galactic models, but only with the shape of the gamma energy spectra from the galactic background, which is much better known and allows to take the strongly correlated systematic normalization errors between the different energy points of the spectrum into account. Simultaneously to the galactic background the shapes of Dark Matter Annihilation and the extragalactic background are fitted. Fitting these three contributions yielded astonishingly good fits with the free normalization of the background agreeing reasonably well with the absolute predictions of the galactic models[12, 13] for the energies between 0.1 and 0.5 GeV. Above these energies a clear contribution from Dark Matter annihilation is needed, but the excess in different sky directions can be explained by a single WIMP mass and a single boost factor, as shown in Fig. 1 for 6 different sky directions.
Alternative explanations for the excess have been plentiful. Among them: locally soft electron and proton spectra, implying that in other regions of the galaxy the spectra are harder, thus producing harder photon spectra.

A summary of these discussions have been given by Strong et al.[8], who find that hard proton spectra are incompatible with the antiproton yield and hard electron spectra are incompatible with the EGRET data up to 120 GeV, which they analyzed. However, they find that by modifying the electron and proton injection spectra simultaneously, they can improve the description of the data, as noted also recently by Kamae et al.[14].
The problem with these ”solutions” is that they give a too large (small) contribution at low (high) gamma ray energies, i.e. the shape of the energy spectra is not well reproduced. But it is exactly the shape, which was well measured by EGRET, because the quoted normalization errors of 15% are common to all energy points. If one calculates the probability of the ”optimized” model, taking the correlations between the energy points into account, the probability is below 10-14! Two other arguments, independent of the EGRET errors, against ”optimized” models are: 1) the energy loss time of protons above 10 GeV is above yrs, i.e. longer than the lifetime of the universe. Therefore it is hard to image that protons, accelerated in the centre of the galaxy by the many supernovae there, would have a significant different spectrum after diffusion to the solar neighbourhood in about yrs, a time much shorter than the energy loss time 2) if the proton spectrum is nevertheless inhomogeneous over our galaxy, it is very surprising that the excess has the same energy shape towards the outer galaxy, where there are practically no supernovae and towards the centre of the galaxy. An alternative way of formulating this problem: if the EGRET excess can be explained prefectly in all sky directions by a gamma contribution originating from mono-energetic quarks, it is very difficult to replace such a contribution by an excess of quarks (or electrons) with a power law spectrum.
To exemplify these problems we consider the shape of the background from a recent analysis by Kamae et al.[14]. They use a harder proton spectrum than locally observed (a power law with index 2.5 instead of 2.7 observed locally) and an updated pp cross section including diffractive scattering and scaling violation. They claim this can describe the EGRET data towards the galactic centre. However, there is a clear overshoot at low energies. Fitting only their shape to the EGRET data, i.e. with a free normalization, still leaves a significant excess, as shown in the left panel of Fig. 1. Here the upper edge of the medium shaded (blue) area corresponds the hardest possible spectrum from Kamae et al.[14] with the power index of 2.5, while the lower edge corresponds to the conventional GALPROP model[8]. Note that the hard spectrum overshoots the highest EGRET point, which was not yet available during the analysis by Kamae et al. In summary, also for the “conventional” explanations[8, 14] the fit to all sky directions can be much improved, if DM is added, since then both the low and high energy range can be perfectly described. Thus different backgrounds just change the normalization of the DM contribution.
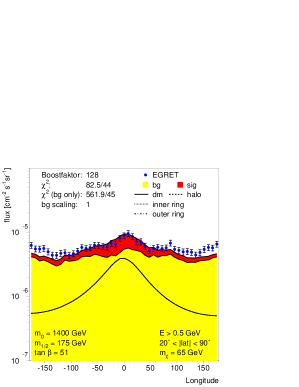
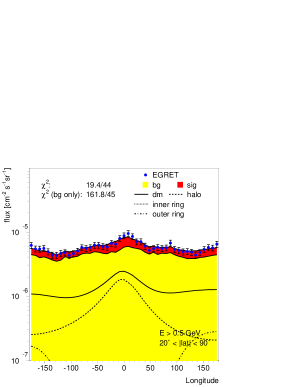
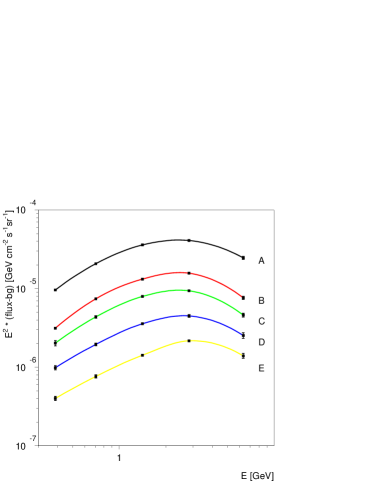
The quality of the EGRET data is better appreciated if one plots only the statistical errors. Fig. 2 shows the excess for five different sky regions: only at high latitudes the errors start to be visible. The curves are just spline fits through the data and were used to determine the systematic point-to-point errors by leaving a given energy point out of the fit and determine its variance. The point-to-point error is about 7% for most energy points. In the previous plot the WIMP mass was kept constant at 65 GeV. The right hand side of Fig. 2 shows the plot for a WIMP mass of 100 GeV, which clearly overshoots the high energy data. Therefore a rough estimate of the WIMP mass from the EGRET excess is between 50 and 100 GeV.
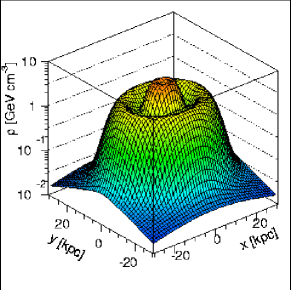
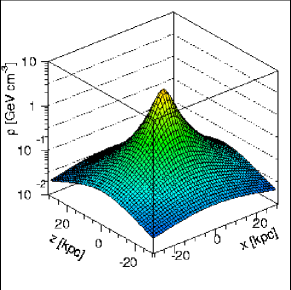
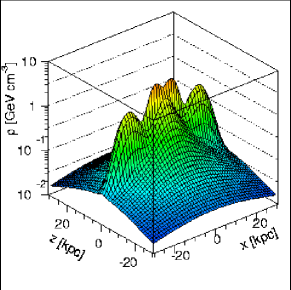
From the excess in the various sky directions one can obtain the halo profile under the assumption that the clustering of the DM is similar in all sky directions. The result is surprising: in addition to the profile expected for a flat rotation curve the EGRET excess show a substructure in the form of toroidal rings at 4 and 14 kpc, as shown in Fig. 3: on the left hand side the contribution from the profile is shown, while for the right hand side the ring structure is added. The need for these additional rings is most easily seen by comparing the longitudinal profiles in the galactic plane and towards the galactic poles. As shown in Fig. 4 the pole regions are described reasonably well without rings, but for the galactic plane the profile only describes the data towards the centre. For the larger latitudes one needs the rings, as indicated by the right top panel. Note that for each bin only the flux integrated for data above 0.5 GeV has been plotted. The normalization of the background has been obtained from a fit to the flux integrated between 0.1 and 0.5 GeV.
The position and shape of the inner ring coincides with the ring of molecular hydrogen. Molecules form from atomic hydrogen in the presence of dust or heavy nuclei. So a ring of neutral hydrogen suggests an attractive gravitational potential. The position and shape of the outer ring coincides with the ring of stars, discovered in 2003 by two independent groups[15, 16]. This ring is thought to originate from the infall of a dwarf galaxy, so additional DMA is expected there.
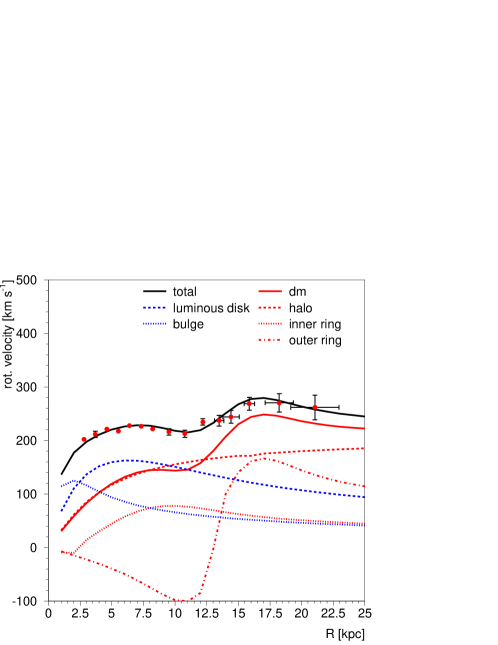
To prove that the enhanced gamma ray density is indeed connected to non-baryonic mass the rotation curve was reconstructed from the excess of the diffuse gamma rays in the following way: since the flux determines the number density of DM for a given boost factor and since the mass of each WIMP is between 50 and 100 GeV, one can determine the mass in the ring and consequently predict the rotation curve333For the outer ring a total DM mass of a few times solar masses was found in comparison with about solar masses in the form of stars.. The two ring model describes the peculiar change of slope at 11 kpc well, as shown in Fig. 5. The contributions from each of the mass terms have been shown separately. The basic explanation for the negative contribution from the outer ring is that a tracer star at the inside of the ring at 14 kpc feels an outward force from the ring, thus a negative contribution to the rotation velocity. It has often been argued that the outer rotation curve cannot be taken seriously, because the errors are large due to the fact that the absolute values of the rotation velocities strongly depend on the value of , the distance between the solar system and the galactic centre. This is true, as shown by Honma and Sofue[17], but they show that the change in slope at about 1.3 is independent of . In addition, it has been argued that the inner and outer rotation curve are difficult to compare, since the methods are completely different. The methods are indeed different, but the first 3 data points from the outer rotation curve (between 8 and 11 kpc) show the same slope as the ones from the inner rotation curve, so there seems to be no systematic effect related to the different methods.
4 Comparison with Supersymmetry
Supersymmetry [18] presupposes a symmetry between fermions and bosons, which can be realized in nature only if one assumes each particle with spin j has a supersymmetric partner with spin ( for the Higgs bosons). This leads to a doubling of the particle spectrum. Obviously SUSY cannot be an exact symmetry of nature; or else the supersymmetric partners would have the same mass as the normal particles. The mSUGRA model, i.e. the Minimal Supersymmetric Standard Model (MSSM) with supergravity inspired breaking terms, is characterized by only 5 parameters: . Here and are the common masses for the gauginos and scalars at the GUT scale, which is determined by the unification of the gauge couplings. Gauge unification is still possible with the precisely measured couplings at LEP [19]. The ratio of the vacuum expectation values of the two Higgs doublets is called and is the trilinear coupling at the GUT scale. We only consider the dominant trilinear couplings of the third generation of quarks and leptons and assume also to be unified at the GUT scale. The absolute value of the Higgs mixing parameter is determined by electroweak symmetry breaking, while its sign is taken to be positive, as preferred by the anomalous magnetic moment of the muon [19].
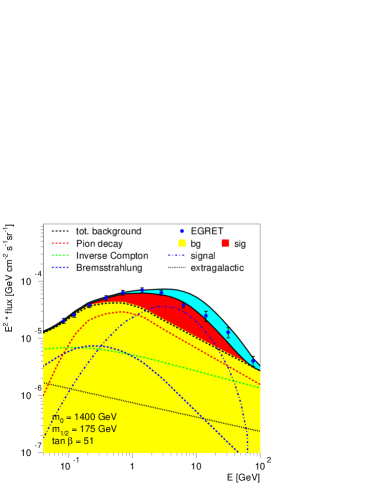
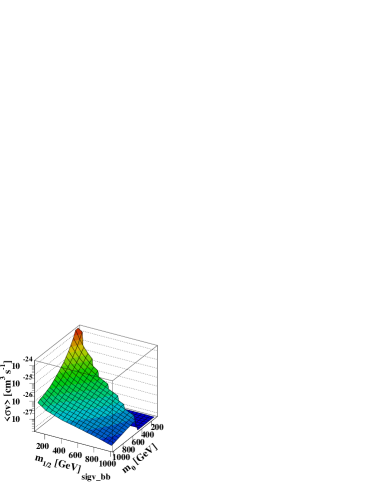
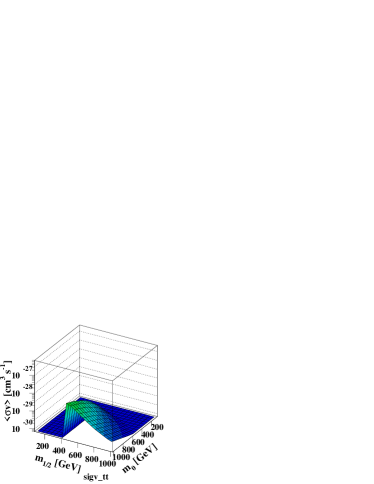
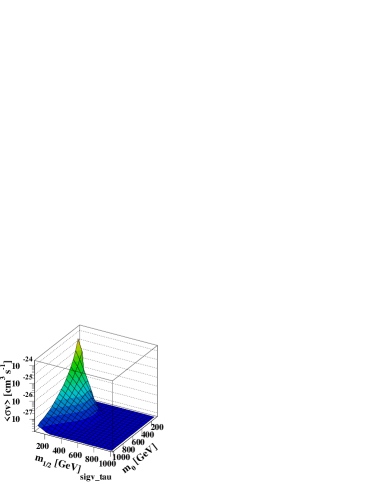
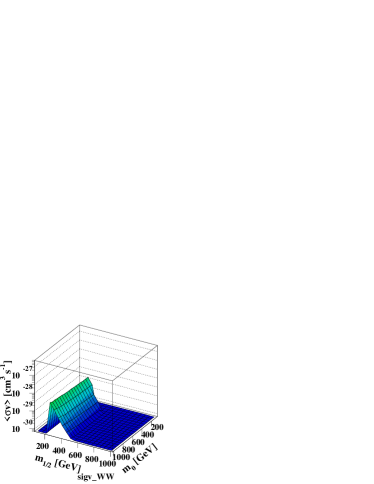
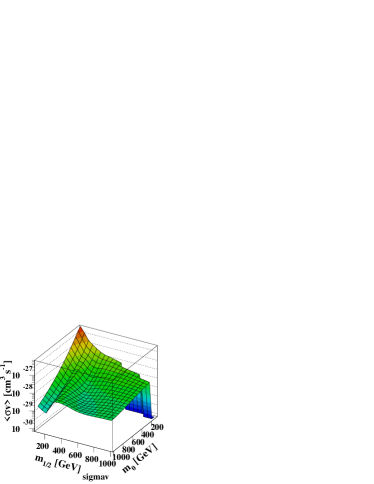
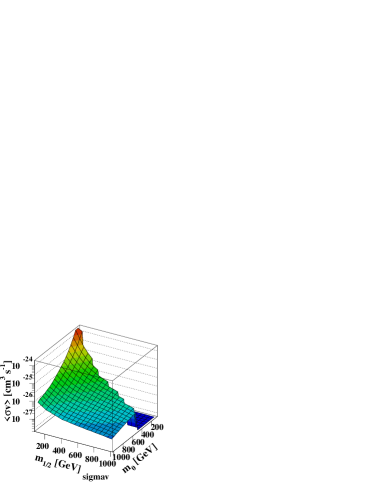
The lightest supersymmetric particle (LSP) is stable, if the multiplicative quantum number R-parity, which is +1 for SM particles and -1 for SUSY particles, is conserved. Non-conservation of R-parity would lead to rapid proton decay[18]. The LSP is a perfect candidate for Dark Matter and it can self annihilate into fermion-antifermion pairs by Higgs or Z-exchange in the s-channel or sfermion, chargino and neutralino exchange in the t-channel. The dominant first three possibilities have amplitudes proportional to the fermion mass, so heavy final states are preferred. For values of the annihilation cross sections into quarks are indeed of the order of magnitude required by WMAP, as shown in Fig. 6. For GeV, corresponding to a neutralino mass of about 70 GeV, as required by the EGRET data, the scalar masses have to be in the TeV range for a thermally averaged annihilation cross section , as required by Eq. 1.
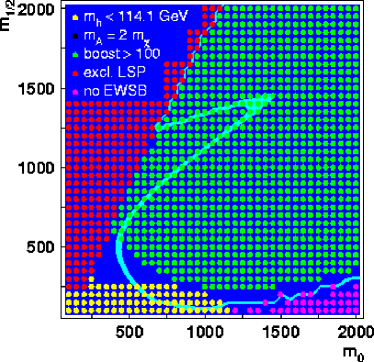
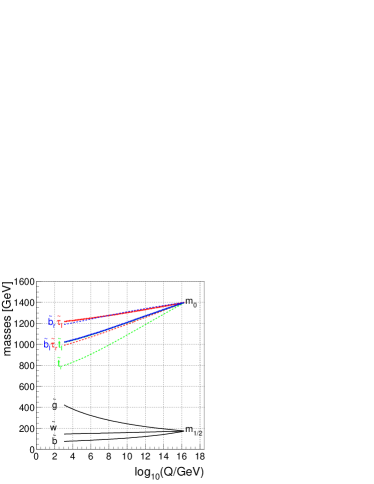
This point of parameter space respects in addition all constraints from the direct searches on Higgs and charginos and electroweak precision observables, as shown in Fig. 7. The relic density has been calculated with the program MicroMegas[20]. If is small compared with the lightest lepton (usually the stau) can be lighter than the neutralino, which happens in the left top corner on the left hand side of Fig. 7. In the region adjacent to it the stau cannot decay fast into a neutralino and tau, in which case a stau and neutralino can annihilate into a tau plus photon. This coannihilation reduces the relic density to values required by the WMAP data, but these regions require large boost factors, since in the present galaxy the NLSP’s have decayed and only the self annihilation contributes. The regions, where the boost factors are above 100 are shown in Fig. 7 together with the regions where the annihilation cross section is consistent with the WMAP data. For boost factors below 100 only two regions are allowed: one around GeV and one around GeV. Only the latter is compatible with the EGRET excess. It requires to be above 1 TeV, which yields squark and slepton masses above 1 TeV. The gluinos and charginos are relatively light, as shown on the right hand side of Fig. 7. It should be noted that the EGRET data combined with the WMAP cross section select basically a single point in parameter space. Compared with scans over the multidimensional SUSY parameter space, even with millions of points, it is very easy to miss such a single point, as demonstrated by recent scans[21, 22], which missed the EGRET point.
5 Summary and Outlook
In summary, the EGRET data shows an intriguing hint of DM annihilation, since it explains many unrelated facts simultaneously:
a) An excess of diffuse galactic gamma rays which shows a spectrum consistent with the expectation from WIMP annihilation into mono-energetic quarks.
b) The excess is present in all sky directions with the same spectrum, thus excluding that it originates from anomalous contributions in the centre of the galaxy.
c) The excess shows a strongly increased intensity at positions where extra DM is expected, namely at two doughnut shaped structures at radii of 14 and 4 kpc from the centre of the galaxy. At 14 kpc one has observed a ring of stars thought to originate from the infall of a dwarf galaxy, while at 4 kpc one finds an enhanced concentration of molecular hydrogen thought to form from atomic hydrogen in the presence of dust or heavy nuclei, which can be collected in the gravitational potential of a ring of DM.
d) The enhanced excess of gamma rays cannot be due to additional gas in these rings as proven by the rotation curve calculated from the gamma ray excess: the mass in the rings perfectly describe the hitherto unexplained change of slope in the rotation curve at a distance of about 11 kpc. The amount of visible matter is far too low to have such an impact on the rotation curve.
In this analysis only the known spectral shapes of the various processes with arbitrary normalizations are fitted, so the analysis becomes largely model independent. Interestingly, the normalization factors come out to be in excellent agreement with expectations, both for the WIMP signal and the background.
Alternative models trying to explain the EGRET excess have to assume that the locally measured fluxes of protons and electrons are not representative for our galaxy, in which case these spectra outside our local bubble can be tuned to obtain the more energetic gamma rays needed for the EGRET excess, although these models provide significantly worse fits to the data, if one takes the strong correlations in the errors between the different energy bins into account. In addition such models cannot explain simultaneously the stability of the ring of stars at 14 kpc and the change of slope in the rotation curve at kpc.
The results mentioned above make no assumption on the nature of the Dark Matter, except that its annihilation produces hard gamma rays consistent with the fragmentation of mono-energetic quarks between 50 and 100 GeV. WIMP masses in this range and the observed WIMP self annihilation cross section are consistent with WIMP’s being the Lightest Supersymmetric Particle predicted in the Minimal Supersymmetric Model with supergravity inspired symmetry breaking, called the mSUGRA model.
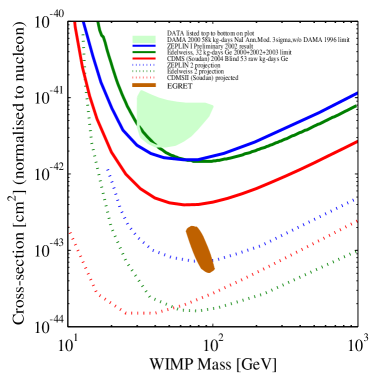
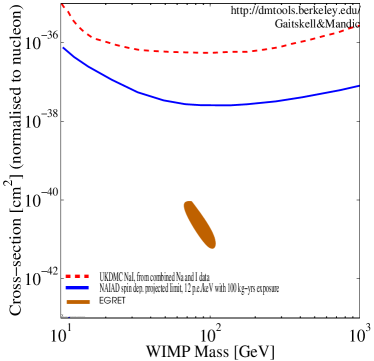
Within this supersymmetric model one finds a spin-independent cross section for elastic scattering of a WIMP on a proton of about , which is within reach[23] of future experiments as shown in Fig. 8. This elastic scattering cross section was calculated with Darksusy[24].
Direct and indirect detection experiments do not prove the supersymmetric nature of the WIMP’s. If the WIMP’s are indeed the lightest supersymmetric particle, then this will become clear at the future LHC collider under construction at CERN in Geneva, where supersymmetric particles of the mass range deduced from the EGRET data should be observable from 2008 onwards, if they exist.
The statistical significance of the EGRET excess of at least 10 combined with all features mentioned above provides an intriguing hint that DM is not so dark, but visible by its annihilation.
I thank my close collaborators A. Gladyshev, D. Kazakov, C. Sander and V. Zhukov for their contributions to this interesting project. Furthermore I thank V. Moskalenko, A. Strong and O. Reimer for numerous discussions on galactic gamma rays.
This work was supported by the DLR (Deutsches Zentrum für Luft- und Raumfahrt) and a grant from the DFG (Deutsche Forschungsgemeinschaft, Grant 436 RUS 113/626/0-1).
References
-
[1]
D.N. Spergel et al, 2003, ApJS, 148, 175;
C.L. Bennett et al., 2003, ApJS, 148, 1; See also: http://map.gsfc.nasa.gov/m_mm/pub_papers/firstyear.html - [2] L. Bergstrm, Rept. Prog. Phys. 63 (2000) 793 [arXiv:hep-ph/0002126].
- [3] G. Bertone, D. Hooper and J. Silk, arXiv:hep-ph/0404175.
- [4] E. Kolb, M.S. Turner, The Early Universe, Frontiers in Physics, Addison Wesley, 1990.
- [5] G. Jungman, M. Kamionkowski and K. Griest, Phys. Rep. 267 (1996) 195.
- [6] V. Dokuchaev, these proceedings. V. Berezinsky, V. Dokuchaev and Y. Eroshenko, Phys. Rev. D 68, 103003 (2003); [arXiv:astro-ph/0301551].
- [7] T. Sjöstrand, P. Eden, C. Friberg, L. Lönnblad, G. Miu, S. Mrenna and E. Norrbin, Computer Phys. Commun. 135 (2001) 238.
- [8] A. W. Strong, I. V. Moskalenko and O. Reimer, Astrophys. J. 613, 962 (2004); [arXiv:astro-ph/0406254].
- [9] Hunter, S. D. et al., Astrophysical Journal 481, 205 (1997)
- [10] W. de Boer, M. Herold, C. Sander, V. Zhukov, A. V. Gladyshev and D. I. Kazakov, arXiv:astro-ph/0408272.
- [11] W. de Boer, arXiv:hep-ph/0408166.
- [12] A. W. Strong and I. V. Moskalenko, Astrophys. J. 509, 212 (1998); [arXiv:astro-ph/9807150].
- [13] I. V. Moskalenko and A. W. Strong, Astrophys. Space Sci. 272 (2000) 247; [arXiv:astro-ph/9908032].
- [14] T. Kamae, T. Abe and T. Koi, arXiv:astro-ph/0410617.
- [15] B. Yanny et al., Astrophys. J. 588 (2003) 824 [Erratum-ibid. 605 (2004) 575]; [arXiv:astro-ph/0301029].
- [16] R. A. Ibata, M. J. Irwin, G. F. Lewis, A. M. N. Ferguson and N. Tanvir, Mon. Not. Roy. Astron. Soc. 340 (2003) L21; [arXiv:astro-ph/0301067].
- [17] M. Honma and Y. Sofue, Publ. of the Astronomical Society of Japan, v.48, p.L103-L106; arXiv:astro-ph/9611156.
-
[18]
Reviews and original references can be found in:
W. de Boer,
Prog. Part. Nucl. Phys. 33 (1994) 201 [arXiv:hep-ph/9402266];
H.E. Haber, Lectures given at Theoretical Advanced Study Institute, University of Colorado, June 1992, Preprint Univ. of Sante Cruz, SCIPP 92/33; see also SCIPP 93/22;
Perspectives on Higgs Physics, G. Kane (Ed.), World Scientific, Singapore (1993);
A.B. Lahanus and D.V. Nanopoulos, Phys. Rep. 145 (1987) 1;
H.E. Haber and G.L. Kane, Phys. Rep. 117 (1985) 75;
M.F. Sohnius, Phys. Rep. 128 (1985) 39;
H.P. Nilles, Phys. Rep. 110 (1984) 1;
P. Fayet and S. Ferrara, Phys. Rep. 32 (1977) 249. - [19] W. de Boer and C. Sander, arXiv:hep-ph/0307049 and references therein.
- [20] G. Blanger, F. Boudjema, A. Pukhov and A. Semenov, Comp. Phys. Commun. 149 (2002) 103 [arXiv:hep-ph/0112278] and arXiv:hep-ph/0210327 and http://wwwlap.in2p3.fr/lapth/micromegas.
- [21] J. R. Ellis, S. Heinemeyer, K. A. Olive and G. Weiglein, arXiv:hep-ph/0411216.
- [22] L. Roszkowski, Pramana 62 (2004) 389 [arXiv:hep-ph/0404052].
- [23] The curves were calculated with the interactive web-based program on http://dmtools.berkely.edu.
- [24] P. Gondolo, J. Edsjo, P. Ullio, L. Bergstrom, M. Schelke and E. A. Baltz, JCAP 0407 (2004) 008 [arXiv:astro-ph/0406204] and http://www.physto.se/~edsjo/darksusy/.