Dwarf Seyfert 1 Nuclei and the Low-Mass End of the Relation
Abstract
To examine the relationship between black hole mass and host galaxy velocity dispersion for low black hole masses, we have measured the velocity dispersions of 15 Seyfert 1 galaxies from the catalog of Greene & Ho (2004). These Seyferts were selected from the Sloan Digital Sky Survey to have estimated black hole masses below . The data are consistent with a straightforward downward extrapolation of the local relation, indicating that this correlation extends over a range of more than four orders of magnitude in black hole mass. The rms scatter of the sample about the extrapolated relation is 0.57 dex, consistent with the expected scatter of single-epoch mass estimates for Seyfert 1 galaxies.
Subject headings:
galaxies: active — galaxies: kinematics and dynamics — galaxies: nuclei — galaxies: Seyfert1. Introduction
The correlation between black hole mass and stellar velocity dispersion in nearby galaxies (the relation) is the foundation upon which our understanding of supermassive black hole demographics is built (Ferrarese & Merritt, 2000; Gebhardt et al., 2000a; Tremaine et al., 2002). To date, however, our knowledge of the relation is largely limited to galaxies with massive bulges, velocity dispersions of km s-1, and . Elucidating the demographics of lower-mass black holes, below , can address key questions regarding the formation environments of massive black holes: for example, is there a minimum galaxy mass or velocity dispersion below which black holes are unable to form or grow (Bromley, Somerville, & Fabian, 2004)? Are black holes easily ejected from dwarf galaxies by gravitational recoil following black hole mergers (Merritt et al., 2004)? Extending the local black hole mass function to masses below would also aid in prediction of event rates for black hole mergers detectable by LISA (e.g., Wyithe & Loeb, 2003).
If black holes do exist in the centers of dwarf galaxies and very late-type spirals, then the subset that are undergoing accretion can potentially be detected as active galactic nuclei (AGNs). However, very few AGNs have been identified with black hole masses below or in host galaxies with km s-1. These include NGC 4395 (Kraemer et al., 1999; Filippenko & Ho, 2003), POX 52 (Barth et al., 2004), possibly NGC 4051 (Shemmer et al., 2003), and a few other narrow-line Seyfert 1 galaxies (Botte et al., 2004b; Grupe & Mathur, 2004). The first systematic survey for AGNs with low-mass black holes was recently carried out by Greene & Ho (2004) (hereinafter GH), who examined the Sloan Digital Sky Survey (SDSS) Data Release One (DR1) archives to find 19 Seyfert 1 galaxies having estimated black hole masses below .
The stellar velocity dispersions for the GH sample cannot be determined from the SDSS spectra, because the instrumental dispersion of km s-1 sets a practical lower limit to the range of velocity dispersions that can be measured, and in most cases the spectra are dominated by AGN emission. Here, we present new measurements of the stellar velocity dispersions for 13 galaxies from this sample and two additional Seyferts we identified from SDSS DR2 meeting the same selection criteria: SDSS J080907.58+441641.4 and SDSS J215658.30+110343.1.
2. Data and Measurements
| Object | Exposure | S/N | Line Strength | (Mg) | (Ca II) | FWHM(H) | ) | ||
|---|---|---|---|---|---|---|---|---|---|
| (s) | (km s-1) | (km s-1) | (km s-1) | (5100 Å) | |||||
| GH01 | 0.077 | 2982 | 17 | 950 | 43.1 | 6.28 | |||
| GH02 | 0.030 | 6000 | 21 | 690 | 41.9 | 5.16 | |||
| GH03 | 0.102 | 3000 | 10 | 820 | 42.9 | 6.01 | |||
| GH04 | 0.043 | 2700 | 32 | 760 | 42.8 | 5.87 | |||
| GH05 | 0.074 | 3600 | 26 | 720 | 43.1 | 6.04 | |||
| GH06 | 0.100 | 1800 | 10 | 1240 | 42.9 | 6.37 | |||
| GH07 | 0.094 | 3600 | 17 | 1140 | 43.0 | 6.37 | |||
| GH10 | 0.081 | 1800 | 29 | 720 | 43.3 | 6.18 | |||
| GH11 | 0.081 | 1800 | 19 | 2110 | 43.2 | 7.04 | |||
| GH13 | 0.126 | 1800 | 12 | 980 | 43.3 | 6.45 | |||
| GH14 | 0.028 | 1800 | 14 | 770 | 41.9 | 5.26 | |||
| GH16 | 0.069 | 1100 | 19 | 1170 | 42.5 | 6.04 | |||
| GH17 | 0.099 | 3500 | 20 | 930 | 43.1 | 6.26 | |||
| GH18 | 0.183 | 3600 | 12 | 1770 | 43.1 | 6.81 | |||
| GH19 | 0.036 | 3600 | 20 | 1890 | 41.7 | 5.89 | |||
| 0809+4416 | 0.054 | 3600 | 22 | 1100 | 42.8 | 6.19 | |||
| 2156+1103 | 0.108 | 3600 | 34 | 780 | 43.5 | 6.39 |
Note. — Object names are those given in the Greene & Ho (2004) catalog. S/N is the mean signal-to-noise ratio per pixel in the ESI spectrum in the spectral region around Mg used to measure . “Line Strength” gives the strength of stellar absorption features in the AGN spectrum relative to those in the template stars, over the blue fit region. FWHM(H) is the width of the broad component of H, as determined by multi-Gaussian model fits. The AGN continuum luminosity (5100 Å)] is from Greene & Ho (2004); is in units of erg s-1. The luminosities are corrected for Galactic extinction and are calculated for a cosmology with km s-1 Mpc-1, , and .
2.1. Observations and Data Reduction
The observations were obtained during the nights of 2003 November 24, 2004 February 15–17, and 2004 October 9–10 UT at the Keck II telescope, using the ESI spectrograph (Sheinis et al., 2002). A 075 slit width was used, giving an instrumental dispersion of km s-1. The spectra cover the wavelength range 3800–10900 Å across ten echelle orders, at a uniform scale of 11.5 km s-1 pixel-1. For each observation, the slit was oriented at the parallactic angle. Flux standards and red giant stars (G8III–K5III) for use as velocity templates were observed each night during twilight. Spectra were extracted with a 1″ extraction width, and wavelength- and flux-calibrated using standard techniques.
2.2. Stellar Velocity Dispersions
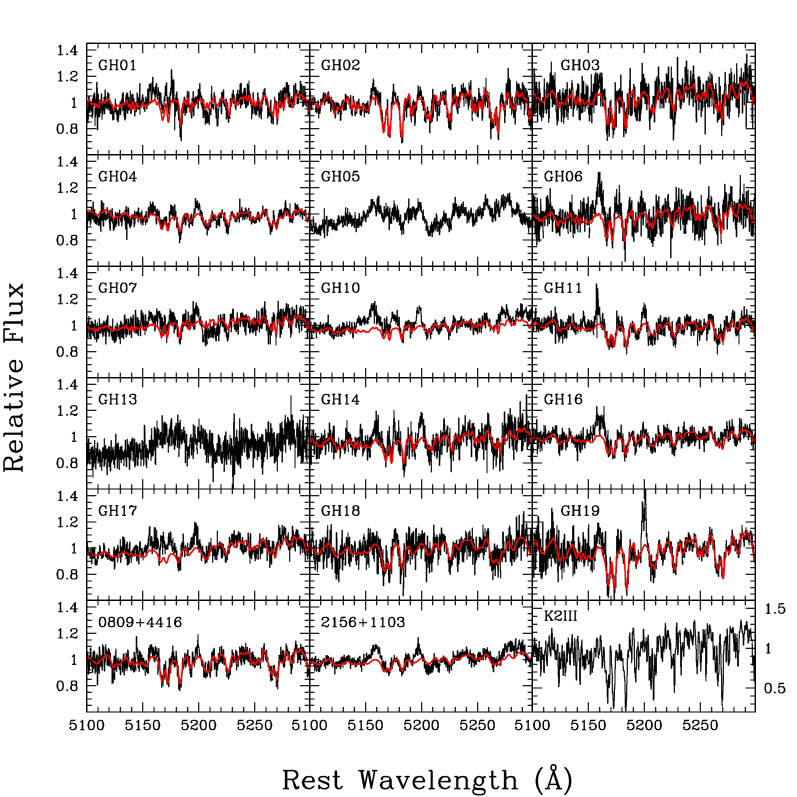
We measured the stellar kinematics by fitting broadened stellar spectra to the galaxy spectra, following techniques described by Barth, Ho, & Sargent (2002). A Gaussian velocity broadening function was assumed, and the fits included both an additive featureless continuum component and a multiplicative low-order polynomial that can compensate for reddening in the galaxy spectrum. Fits were performed in two spectral regions: Å, which includes Mg, Fe5270, and numerous weaker features; and Å, covering the Ca II near-infrared triplet. The exact fitting region was tailored for each galaxy to fit within a single echelle order and to exclude emission lines such as [N I] and [Fe VII] . The measurement uncertainty was taken to be the sum in quadrature of the fitting uncertainty from the best-fitting template and the standard deviation of results from all templates. A minimum of six template stars were used for each measurement. We note that the problem of template mismatch in the Mg/Fe abundance ratio, which is often noticeable in high-dispersion galaxies (Barth, Ho, & Sargent, 2002), does not significantly affect this sample.
We were able to determine velocity dispersions for 13 of the 15 objects we observed from the GH sample, as well as the two new SDSS objects, using the Mg spectral region. The other two galaxies were dominated by AGN emission and no useful results could be recovered from the template fitting. For 7 galaxies we were able to measure from the Ca II triplet region as well; the results are generally consistent with the Mg results but have larger uncertainties because of the smaller spectral region used for the fitting. Thus, we use the Mg measurements as the best estimates of the stellar velocity dispersions. The fitting results are listed in Table 1 and illustrated in Figure 1. (The figure displays, for clarity, only a portion of the fitting region.)
We are unable to determine whether the measured velocity dispersions are dominated by light from bulges, disks, or nuclear star clusters, since in most cases the galaxies are only marginally resolved in the SDSS images. High-resolution imaging with the Hubble Space Telescope (HST) would clarify the host galaxy morphologies and would also make it possible to examine the behavior of the relation for this sample.
2.3. Black Hole Masses
Black hole masses were derived by GH from the SDSS spectra using the empirical relations from Kaspi et al. (2000). These relations combine the broad-line region (BLR) radius (derived from the nonstellar 5100 Å continuum luminosity) and broad-line width to obtain a virial estimate of the central mass. Single-epoch virial estimates of based on this technique are thought to have a random scatter of roughly a factor of 3, based on the consistency of the masses with the relation and other tests (e.g., Gebhardt et al., 2000b; Ferrarese et al., 2001; Vestergaard, 2002; Nelson et al., 2004; Onken et al., 2004). While FWHM(H) is most commonly used as a measure of the velocity distribution of the BLR, the H emission lines in the SDSS spectra have low S/N and GH used FWHM(H) as a surrogate.
The high S/N and spectral resolution of the ESI data make it possible to perform decompositions of the H+[N II] lines that are more accurate than the previous measurements from SDSS spectra. Following the methods used by GH, we fit H+[N II] using a multi-Gaussian model. All three narrow components (H and [N II] ) were constrained to have the same velocity width, and the wavelength separation and intensity ratio of the [N II] lines were fixed at their laboratory values. Two Gaussians were required to fit the broad component of H adequately for most galaxies. In most cases our results for FWHM(H) are similar to those of GH, but in a few cases such as GH11 the ESI spectrum yields a substantially larger width, which we attribute to the difficulty of deblending the line profiles in SDSS spectra having weak broad components and only marginally resolved narrow lines. The difference in linewidths could also be due in part to intrinsic variability. The statistical uncertainties on FWHM(H) from the profile fits are small, typically only km s-1, while the true uncertainties on the linewidths are dominated by systematics including starlight subtraction errors, and we estimate these uncertainties to be of order 10% in FWHM(H). We also measured the H linewidths using a double-Gaussian model to represent the broad component. For three objects the broad H line did not have sufficient S/N to obtain a meaningful fit, and in one object (GH11) broad H was not detected at all. We do not find any systematic trend for H to be significantly broader than H, and we use the H lines to determine because their higher S/N enabled us to measure the linewidths in a consistent manner for the entire sample.
Since the Keck spectra were observed and extracted through a small aperture and the slit losses are unknown, we continue to use the GH measurements of the AGN continuum luminosity obtained from the SDSS spectra. These may slightly overestimate the true AGN luminosity because of residual starlight in the SDSS spectra. HST -band imaging of this sample would be the best way to obtain more accurate luminosities.
Single-epoch virial mass estimates for black holes in AGNs are subject to potentially significant systematics, due to uncertainties in both the slope of the BLR radius-luminosity relation () and the normalization factor in the virial relation . The radius-luminosity relation is not well determined for erg s-1, and this presents particular problems for our sample since it is necessary to extrapolate this relation to luminosities as low as erg s-1. Following Kaspi et al. (2000) and Vestergaard (2002) we use ; setting instead (e.g., Shields et al., 2003) would raise the masses by 0.3 dex on average. To obtain virial masses, we use the recent calibration of from Onken et al. (2004) and Peterson et al. (2004), which was derived by scaling the black hole masses of reverberation-mapped Seyferts to fit the relation. This calibration increases the black hole masses by 0.27 dex relative to masses derived for the assumption of isotropic orbits of BLR clouds (e.g., Kaspi et al., 2000), and shifts the sample to systematically higher masses than those originally given by GH. The revised masses are listed in Table 1.
3. Discussion
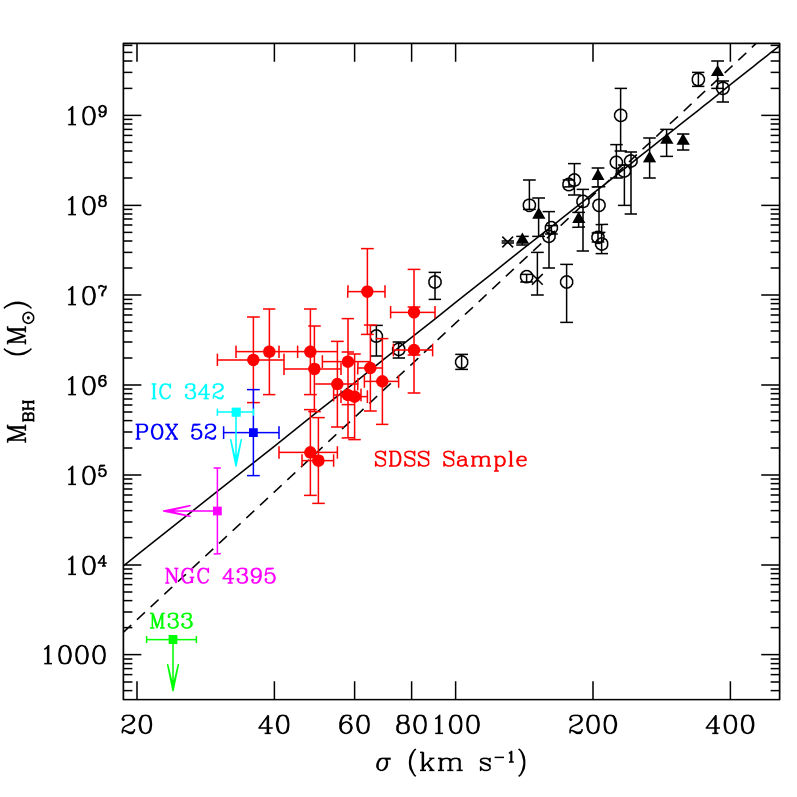
Figure 2 displays the relation for AGNs with low black hole masses as well as for nearby galaxies with direct dynamical measurements of . For the SDSS sample, NGC 4395, and POX 52, the vertical error bars represent a factor of 3 uncertainty in , corresponding to the expected level of random scatter for single-epoch measurements. Overall, the SDSS AGNs lie close to the relation extrapolated to low masses. Compared to the Tremaine et al. (2002) relation with power-law slope 4.02, the SDSS galaxies have a mean offset of 0.23 dex in and an rms scatter of 0.56 dex. The mean offset and rms scatter are 0.64 dex and 0.85 dex, respectively, relative to the steeper relation of Merritt & Ferrarese (2001) with slope 4.72. (The mean offset from the Tremaine et al. relation would be dex if we used the virial relations from Kaspi et al. 2000 rather than the Onken et al. calibration.) The scatter of 0.56 dex relative to the shallower relation is only slightly larger than the scatter of 0.4–0.5 dex for AGNs with reverberation-based black hole masses (Onken et al., 2004; Nelson et al., 2004). This overall consistency suggests that both the BLR radius-luminosity relation and the relation can reasonably be extrapolated to black holes in the range , well below the mass scales in which these correlations have been calibrated.
Given the systematic uncertainties involved in deriving single-epoch virial masses for these objects and the substantial scatter, we do not attempt to fit the slope of the relation based on the new data. Nevertheless, our results may be useful as a constraint on models making specific predictions for the low-mass end of the relation. For example, the hierarchical black hole growth scenario of Granato et al. (2004) predicts that the slope should substantially steepen below km s-1 as supernova feedback becomes more efficient at slowing the AGN fueling rate. The low-mass AGN sample does not show such behavior.
We cannot rule out the possibility that the GH sample is only the upper envelope of the population of black holes in low-mass galaxies. The selection technique used by GH is only possible for broad-lined AGNs, and the probability of detecting a galaxy as an AGN in the SDSS archive depends on the AGN luminosity, which in turn depends on . This potentially biases the sample towards preferential detection of AGNs with the highest-mass black holes for a given . There are still few direct constraints on the masses of black holes in inactive dwarf ellipticals or late-type spirals, and the case of M33 demonstrates that some late-type galaxies may not contain a black hole at all (Gebhardt et al., 2001). Dynamical searches for low-mass black holes should be continued whenever feasible in order to obtain an unbiased sample of detections or upper limits in this mass range.
Based on their broad-line widths of km s-1, the GH objects can be classified as narrow-line Seyfert 1 galaxies (NLS1s). Our observations provide new data to test recent claims regarding the relation of NLS1s. Using [O III] emission-line velocity dispersions as a surrogate for stellar velocity dispersions, Grupe & Mathur (2004) found that ROSAT-selected NLS1s lie below the relation, typically by an order of magnitude, and concluded that NLS1s are “young” AGNs with undermassive black holes. We find, on the contrary, that the low-mass NLS1 galaxies in the GH sample do not deviate significantly from the local relation. The use of [O III] emission-line velocity dispersions by Grupe & Mathur (2004) in place of stellar velocity dispersions may be the cause of this discrepancy. As recently shown by Botte et al. (2004a), NLS1s apparently deviate from the Nelson & Whittle (1996) empirical trend for Seyferts to have similar stellar and emission-line velocity dispersions. We will examine the relation between the stellar and emission-line velocity dispersions for the GH sample in a future paper, in the context of a larger sample of Seyfert galaxies covering a wide range of black hole masses.
4. Conclusions
We have measured the stellar velocity dispersions of 15 Seyfert 1 galaxies selected from the SDSS to have low-mass black holes based on their broad-line widths and nonstellar continuum luminosities. The velocity dispersions for this sample are small, ranging from 36 to 81 km s-1, and the results are consistent with a simple extrapolation of the relation to low masses. This initial view of the demographics of low-mass black holes in AGNs implies a remarkable continuity in the growth and evolution of black holes and their host galaxies for ranging from to over . Further refinement of the black hole mass estimates is possible if reverberation mapping can be successfully carried out for AGNs having ; this may be the best prospect for a definitive measurement of the slope for low-mass black holes.
References
- Barth et al. (2004) Barth, A. J., Ho, L. C., Rutledge, R. E., & Sargent, W. L. W. 2004, ApJ, 607, 90
- Barth, Ho, & Sargent (2002) Barth, A. J., Ho, L. C., & Sargent, W. L. W. 2002, AJ, 124, 2607
- Böker, van der Marel, & Vacca (1999) Böker, T., van der Marel, R. P., & Vacca, W. D. 1999, AJ, 118, 831
- Botte et al. (2004a) Botte, V., Ciroi, S., Di Mille, F., Rafanelli, P., & Romano, A. 2004a, MNRAS, in press (astro-ph/0410374)
- Botte et al. (2004b) Botte, V., Ciroi, S., Rafanelli, P., & Di Mille, F. 2004b, AJ, 127, 3168
- Bromley, Somerville, & Fabian (2004) Bromley, J. M., Somerville, R. S., & Fabian, A. C. 2004, MNRAS, 350, 456
- Ferrarese & Merritt (2000) Ferrarese, L. & Merritt, D. 2000, ApJ, 539, L9
- Ferrarese et al. (2001) Ferrarese, L., Pogge, R. W., Peterson, B. M., Merritt, D., Wandel, A., & Joseph, C. L. 2001, ApJ, 555, L79
- Filippenko & Ho (2003) Filippenko, A. V., & Ho, L. C. 2003, ApJ, 588, L13
- Gebhardt et al. (2000a) Gebhardt, K., et al. 2000a, ApJ, 539, L13
- Gebhardt et al. (2000b) Gebhardt, K., et al. 2000b, ApJ, 543, L5
- Gebhardt et al. (2001) Gebhardt, K., et al. 2001, AJ, 122, 2469
- Granato et al. (2004) Granato, G. L., De Zotti, G., Silva, L., Bressan, A., & Danese, L. 2004, ApJ, 600, 580
- Greene & Ho (2004) Greene, J., & Ho, L. C. 2004, ApJ, 610, 622 (GH)
- Grupe & Mathur (2004) Grupe, D., & Mathur, S. 2004, ApJ, 606, L41
- Kaspi et al. (2000) Kaspi, S., Smith, P. S., Netzer, H., Maoz, D., Jannuzi, B. T., & Giveon, U. 2000, ApJ, 533, 631
- Kraemer et al. (1999) Kraemer, S. B., Ho, L. C., Crenshaw, D. M., Shields, J. C., & Filippenko, A. V. 1999, ApJ, 520, 564
- Merritt & Ferrarese (2001) Merritt, D. & Ferrarese, L. 2001, ApJ, 547, 140
- Merritt et al. (2004) Merritt, D., Milosavljević, M., Favata, M., Hughes, S. A., & Holz, D. E. 2004, ApJ, 607, L9
- Nelson et al. (2004) Nelson, C. H., Green, R. F., Bower, G., Gebhardt, K., & Weistrop, D. 2004, ApJ, 615, 652
- Nelson & Whittle (1996) Nelson, C. H., & Whittle, M. 1996, ApJ, 465, 96
- Onken et al. (2004) Onken, C. A., Ferrarese, L., Merritt, D., Peterson, B. M., Pogge, R. W., Vestergaard, M., & Wandel, A. 2004, ApJ, 615, 645
- Peterson et al. (2004) Peterson, B. M., et al. 2004, ApJ, 613, 682
- Sheinis et al. (2002) Sheinis, A. I., Bolte, M., Epps, H. W., Kibrick, R. I., Miller, J. S., Radovan, M. V., Bigelow, B. C., & Sutin, B. M. 2002, PASP, 114, 851
- Shemmer et al. (2003) Shemmer, O., Uttley, P., Netzer, H., & McHardy, I. M. 2003, MNRAS, 343, 1341
- Shields et al. (2003) Shields, G. A., Gebhardt, K., Salviander, S., Wills, B. J., Xie, B., Brotherton, M. S., Yuan, J., & Dietrich, M. 2003, ApJ, 583, 124
- Tremaine et al. (2002) Tremaine, S., et al. 2002, ApJ, 574, 740
- Vestergaard (2002) Vestergaard, M. 2002, ApJ, 571, 733
- Wyithe & Loeb (2003) Wyithe, J. S. B., & Loeb, A. 2003, ApJ, 590, 691