The Rest-frame Optical Properties of SCUBA Galaxies
Abstract
We present optical and near-infrared photometry for a sample of 96 dusty, far-infrared luminous galaxies. We have precise spectroscopic redshifts for all these galaxies yielding a median redshift of . The majority, 78, are submillimeter-detected galaxies lying at –3.6, while the remaining 18 are optically-faint Jy radio galaxies at –3.4 which are proposed to be similarly luminous, dusty galaxies whose dust emission is too hot to be detected in the submillimeter waveband. We compare the photometric and morphological properties of these distant, ultraluminous galaxies to local samples of dusty, luminous galaxies. We confirm that spectroscopically-identified far-infrared luminous galaxies at display a wide variety in their optical-near-infrared and near-infrared colors, with only a modest proportion red enough to classify as unusually red. We show that on average luminous, high-redshift dusty galaxies are both brighter and redder in restframe optical passbands than comparable samples of UV-selected star forming galaxies at similar redshifts. Archival HST ACS imaging of 20 of our galaxies demonstrates both morphological indications of mergers and interactions, which may have triggered their luminous far-infrared activity, and structured dust distributions within these galaxies. We derive a near-infrared Hubble diagram for far-infrared luminous galaxies. This shows that this population is typically fainter than high luminosity radio galaxies at similar redshifts and exhibit significantly more scatter in their -band magnitudes. The restframe optical luminosities of the far-infrared luminous population are comparable to those of local ultraluminous infrared galaxies, although their far-infrared luminosities are several times higher. The typical extinction-corrected optical luminosity of the high-redshift population, assuming passive evolution, provides a good fit to the bright end of the luminosity function of luminous spheroidal galaxies seen in rich clusters at intermediate redshifts. This adds to the growing body of evidence showing that these high redshift, far-infrared luminous sources identify star-formation and AGN fueling events in the early life of massive galaxies in the Universe.
Subject headings:
cosmology: observations — infrared: galaxies — galaxies: evolution — galaxies: formation1. Introduction
Ten billion years ago, at a redshift of , the Universe was a much more active place. This is the era of the peak activity in quasars (Boyle et al. 2000) and recent surveys suggest it coincides with the peak activity in other galaxy populations. These include surveys for star forming galaxies selected either photometrically in their restframe UV continuum light (Shapley et al. 2001; Steidel et al. 2004) or in their restframe optical continuum light (Franx et al. 2003; Daddi et al. 2003, 2004; Cimatti et al. 2004), or through their intense far-infrared/radio emission (Chapman et al. 2003a). Taken together, the results from these surveys provide a well-stocked, rich and apparently disparate zoo of galaxies and AGN at this epoch. This enables us to investigate the relationships between these different populations through direct comparison of their physical properties, such as space densities, masses, clustering strength, stellar ages and luminosities. In this way we can test whether these different classes represent, for example, a mass sequence, or whether they are different stages in the life of a single population, similar to the unification schemes which have been suggested to connect local ultraluminous infrared galaxies (ULIRGs) and QSOs (Sanders et al. 1988).
This paper focuses on determining the photometric properties in the restframe optical wavebands of a large sample of far-infrared luminous galaxies at with complete redshift coverage (Chapman et al. 2003a, 2004a, 2004b). These high-redshift, far-infrared luminous galaxies are selected using two independent selection criteria. The larger subsample is based on a spectroscopic survey for optically-faint, radio-selected sources with submillimeter (submm) fluxes above 5 mJy (Chapman et al. 2003a, 2004a). These are “classical” submm (or SCUBA) galaxies – SMGs – which appear to be a population of highly obscured starbursts and starburst/AGN at high redshifts (Bertoldi et al. 2000; Smail et al. 2002b; Ivison et al. 2002; Webb et al. 2003; Chapman et al. 2003a, 2004a; Borys et al. 2004; Dannerbauer et al. 2004) and are thought to be intimately linked with the formation of massive galaxies (Frayer et al. 1998, 1999, 2004; Gear et al. 2000; Lutz et al. 2001; Genzel et al. 2003; Blain et al. 2004a; Greve et al. 2004a). The second, smaller, subsample are similarly optically-faint, Jy radio sources (OFRGs) with spectroscopic redshifts which place them at comparable redshifts to the SMGs, but with limits on their submm flux which preclude them being luminous submm sources (Chapman et al. 2004b). Although they are undetected in the submm waveband, these galaxies are still proposed to be luminous far-infrared sources, but with higher characteristic dust temperatures than those exhibited by the submm-detected population (Blain et al. 2004b; Chapman et al. 2004b). This proposal will be tested through measurement of the mid-infrared properties of these galaxies with the Spitzer Space Telescope (Spitzer) in the near future. Even if this claim proves to be erroneous their inclusion in our analysis does not qualitatively change any of the conclusions in this paper.
The selection function for this far-infrared luminous sample is very broad and so to relate their properties to those of the populations of galaxies and AGN selected via different techniques, we must have redshift information. With this we can isolate those galaxies in the relevant redshift range and simply compare their observed properties to other populations at these redshifts, including BX/BM galaxies (Steidel et al. 2004), very red near-infrared galaxies at (Franx et al. 2003) or QSOs (Boyle et al. 2000). We are particularly interested in testing the relationship between these populations by comparing their stellar masses, as well as testing the possible connection between SMG/OFRG and the formation phase of the luminous, evolved elliptical galaxies which populate high-density regions out to at least . For galaxy populations at these tests can be done using characteristics derived from the restframe optical properties of the galaxies – which are accessible in the near-infrared wavebands from the ground. Further progress will come from space-based, mid-infrared observations with Spitzer. These have the ability to probe the restframe near-infrared emission from these galaxies, providing an even more reliable measure of the luminosities of their stellar populations.
In this paper we collect optical and near-infrared photometry for a sample of 96 submm- or radio-selected, far-infrared luminous galaxies with precise spectroscopic redshifts. We use these data to discuss the restframe optical continuum properties of these galaxies and compare them to similar observations of both low- and high-redshift galaxy populations. We use our near-infrared photometry to estimate the likely optical luminosities and model their colors to derive a typical age and dust extinction for the population as a whole. We then examine the evolution of these galaxies to determine the properties of possible descendents at lower redshifts.
The paper is structured as follows: §2 details our observations and their reduction, while §3 analyses these and gives the results derived from these data. §4 discusses these results and summarises our main conclusions. We assume through out a cosmology with , and .
2. Observations and Reduction
Our analysis uses new near-infrared imaging in conjunction with archival observations and published optical and near-infrared photometry to produce a catalog of optical/near-infrared colors for spectroscopically-identified submm and radio-selected sources from the surveys of Chapman et al. (2003a, 2004a, 2004b). These surveys cover seven fields: CFRS 03, Lockman Hole, HDF-North, SA 13, CFRS 14, ELAIS-N2 and SA 22, and we discuss the data available for each fields below. We supplement these with photometry of the five well-studied submm galaxies with redshifts in the SCUBA cluster lens survey (Smail et al. 2002b), as given by Frayer et al. (2004).
2.1. Ground-based Optical and Near-infrared Imaging
- and -band photometry (in 4′′-diameter apertures) is available for the sources in the ELAIS-N2 and the Lockman Hole fields from Ivison et al. (2002) and we adopt the same large photometric aperture for this work. The choice of aperture size is driven by our desire to obtain representative colors for the entirety of these extended (median optical size of 2.3′′, see §3) and sometimes morphologically-complex galaxies (Chapman et al. 2003b). There are two penalties for this choice: first, the apparent point-source sensitivity in the aperture is brighter than it would otherwise be, and second in about 15% of cases our photometry might suffer from contamination by, probably unrelated, bright galaxies. Where contamination may have occured we flag these objects in our catalog. However, we have retained these objects in our analysis as we have confirmed that their presence does not affect any of our qualitative conclusions.
For several of the submm sources in CFRS 03 and CFRS 14 fields /-band photometry published in Webb et al. (2003) and Clements et al. (2004) (but using 3′′-diameter apertures). We have remeasured the photometry for these sources (and our new radio sources and submm IDs in these fields) in 4-′′ diameter apertures. In addition, for the remaining fields without published photometry (HDF, SA 13 and SA 22) we have measured the 4-′′ diameter photometry off new and available archival imaging. We now discuss this imaging on a field-by-field basis.
![[Uncaptioned image]](/html/astro-ph/0412574/assets/x3.png)
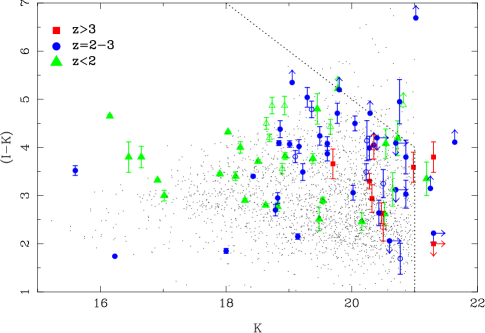
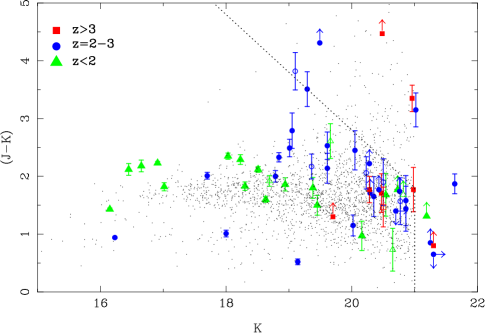
Fig. 2 — A – color–color plot for the SMG and OFRG galaxies in our spectroscopic sample and the lensed SMGs with redshifts from Frayer et al. (2004). The OFRGs are plotted with open symbols and all the points are coded in terms of their redshifts. We also indicate the classification scheme proposed by Bergstrom & Wiklind (2004) to distinguish between extremely red galaxies which are red by virtue of either dust (active star-forming galaxies with redder colors) or passive, evolved stellar populations (which have bluer colors) at . Note that this only applies to the SMG/OFRG in our lowest redshift slice. Those SMG/OFRG at with colors sufficiently red to place them in the extremely red object (ERO) class are roughly equally divided between these two photometric classes – underlining the difficulty of using simple schemes to attempt to disentangle the complex mix of obscured and unobscured activity within the most luminous galaxies at high-.
For all of our spectroscopic sample in the ELAIS-N2 and the Lockman Hole fields we rely on the - and -band imaging published by Ivison et al. (2002). For the CFRS 03 field we have retrieved and rereduced the -band imaging used by Webb et al. (2003) from the CFHT archive. New /-band observations of the Lockman Hole and CFRS 03 fields were obtained with the wide-field WIRC2 near-infrared imager (Eikenberry et al. 2004) on the Palomar Hale 5-m on the nights of 2004 January 6–8. The seeing was 0.9–2.0′′ and the exposure times were 3.3-ks for the -band and 6.6-ks in the -band, in non-photometric conditions. Nevertheless, the wide-field of view of WIRC2 () makes it relatively simple to derive zero-points for these exposures from 2MASS stars in these regions. We estimate the precision of the zero-points to be mag based on the scatter between stars and the typical depth of these observations as and ().
New /-band imaging of the CFRS 14 and SA 13 fields was also taken with the WIRC2 imager on the nights of 2004 January 8–9. The total exposure times are 11.4-ks in and 3.3-ks in -band for CFRS 14 and 14.0-ks in and 10.5-ks in -band for SA 13. The conditions were non-photometric but again the data can be reliably calibrated from 2MASS stars serendipitous lying within the large WIRC2 field to a precision of mag. The 3- limiting magnitudes of these observations were and .
In the HDF we make use of panoramic -band imaging obtained by Bundy et al. (2004) using WIRC2, as well as new -band observations with the same instrument. The acquisition and reduction of the -band data are described by Bundy et al. (2004). The observations comprise three pointings completely covering the GOODS HDF-N axis with per pointing exposure times of 15 ks and seeing of 0.9′′ in . We automatically aligned and mosaiced these images using starlink ccdpack routines and combined them with the publically-accessible image provided by Capak et al. (2003) after suitable normalisation. The -band imaging for this field was obtained on 2004 January 6–7 with WIRC2, under non-photometric conditions and with 1.5′′ seeing. Three pointings were obtained which cover the bulk of the SMG/OFRGs in this region, each with a total integration time of 11.6-ks in . Again the observations were mosaiced using starlink ccdpack. The zero points of both the and -band images are transformed onto the 2MASS photometric system and yield 3- limits in our 4′′ photometric aperture of and .
In addition to the WIRC2 observation listed above, we also obtained pointed high-resolution - and -band imaging of selected SMG/OFRGs from UKIRT. These observations cover targets in the CFRS 03, SA 13 and SA 22 fields and were obtained on the nights of 2003 February 26, August 27–31 and in queue-observing on the nights of 2003 September 8–9, 16–17 and 28 using the UFTI near-infrared imager or the UIST near-infrared imaging spectrograph. The typical exposure times are 4.8-ks in and 3.2-ks in with 0.5–0.6′′ seeing and resulting 3- limiting magnitudes for point sources of and .
Finally, we obtained - and -band imaging of the SA 22 field using IRIS2 on the AAT (Tinney et al. 2004). These observations were kindly undertaken by Dr. Mark Sullivan on the nights of 2003 September 7–9. These data consist of 7.2-ks in and 3.6-ks in covering a field in 1.5–1.9′′ seeing and provide 3- limits of and .
All the observations employ multiple short exposures (sometimes coadded on-chip) on a dithered grid to construct a running sky-flat, which along with suitable dark exposures is used to remove instrumental and sky structure from the final images. Typical per-frame exposure times were s in and s in the -band for the Palomar observations, 90 s in and 120 s in for UKIRT and s in and 60 s in -band on the AAT. The Palomar observations were reduced in a standard manner with custom-written iraf scripts, while the UKIRT and AAT observations were reprocessed with the relevant orac-dr pipelines.
For our optical coverage we use the published -band photometry from Ivison et al. (2002) in the Lockman and ELAIS-N2 fields, while -band imaging for the HDF comes from the Suprimecam images published by Capak et al. (2003). The SA 13 optical images are also taken with Suprimecam and were retrieved from the Subaru archive and reduced with the nekosoft software pipeline (Yagi 1998). We also employ -band imaging of SA 22, CFRS 03 and CFRS 14 taken with the LFC camera on the Palomar Hale 5-m and reduced with the iraf mscred package. Calibration in all cases comes from observations of Landolt (1992) standard stars. Astrometry of all of the optical (and near-infrared) imaging was tied to the USNO catalog using interactive fits within the starlink gaia tool. These astrometric solutions provide rms fits to the positions of the USNO stars in all frames.
We measure 4′′-diameter aperture magnitudes for all the SMGs and OFRGs from Chapman et al. (2003, 2004a, 2004b) lying within our imaging after correcting for significant seeing differences between the passbands. We use this photometry to provide both total colors and magnitudes for the galaxies and list the latter in Table 1, along with the source ID, redshifts from Chapman et al. (2003, 2004a, 2004b) and any identifiers from previous studies. The apertures were centered on the positions of the radio sources, but were allowed to shift by upto 1′′ to reflect the possible positional mismatch between the optical/near-infrared and radio astrometry in each field.
We illustrate the distribution of the SMG/OFRG sample on the – and – color-magnitude planes in Fig. 1 and contrast this with the color-magnitude distribution of the general field galaxy population taken from a -selected survey in the HDF-N (Bundy et al. 2004). In Fig. 2 we show a similar comparison of the – color-color plane for the SMG/OFRG and the field population.
![[Uncaptioned image]](/html/astro-ph/0412574/assets/x5.png)
Fig. 4 — A comparison of the half-light distribution for the SMG/OFRG sample at –3.0 lying in the GOODS field with the distribution for the optically-selected galaxy population at a comparable redshift, , from Ferguson et al. (2004). The top axis shows the actual scale sizes adopting an average angular scale of 8.3 kpc arcsec-1. The SMG/OFRG sample clearly have much larger UV-extents than a typical galaxy selected at these redshifts from a magnitude-limited sample.
2.2. HST Optical Observations
In addition to the ground-based imaging discussed above, we have also included in our analysis morphological information from higher resolution imaging of a subset of our sample from Hubble Space Telescope (HST). This comprises multicolor ACS imaging of 20 galaxies from the spectroscopic SMG and OFRG samples of Chapman et al. (2003a; 2004a; 2004b) which serendipitously fall within the GOODS HDF-N field.
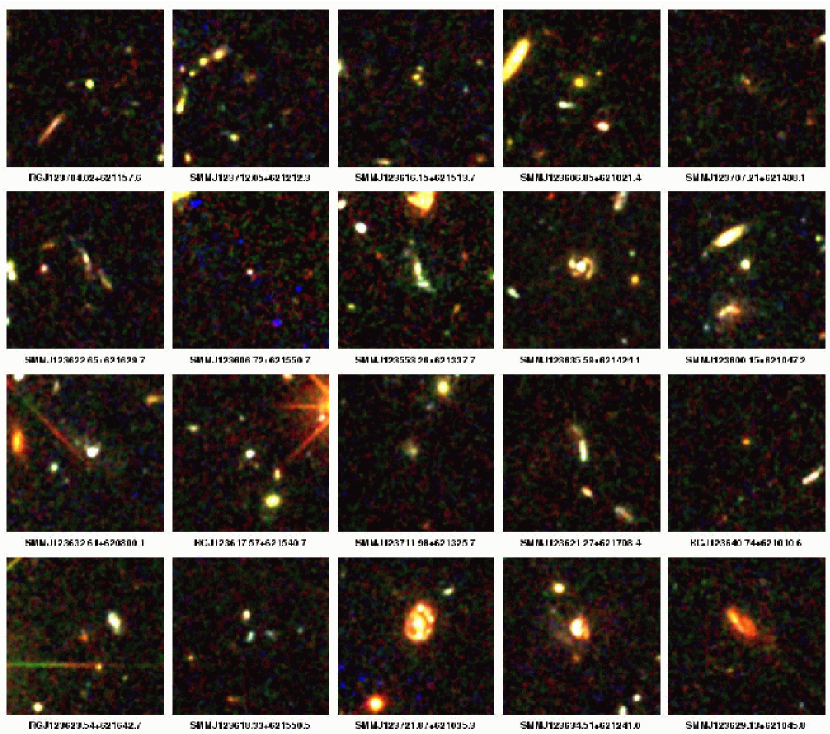
The 5-epoch GOODS ACS F435W (), F606W () and F775W () images were downloaded from the ST-ECF mirror of the GOODS website. More details of the acquisition and reduction of these data is given in Giavalisco et al. (2004). We extract regions centered on the 20 SMGs and OFRGs lying within the GOODS HDF-N imaging. We rebin these images to a scale of 0.15′′ pixel-1 and then convolve them with a 0.3′′ FWHM Gaussian to enhance low surface brightness features before constructing ”true” color images which are shown in Fig. 3.
In total in the final sample we have 73 SMGs, 18 OFRGs and 5 lensed SMGs, all with redshifts. For these we have -band coverage of 89 galaxies, with -band detections or limits for 63 of the galaxies in the combined sample. In addition we have high-resolution HST imaging of 20 galaxies observed with ACS by GOODS.
The selection function for our combined sample is complicated, combining as it does submm, radio, optical photometric and spectroscopic and near-infrared photometric selection limits. The easiest of these selection criteria to describe is that associated with the near-infrared imaging: which provides median 3- limits of and .
The radio-selected SMG sample is defined by a minimum 850-m flux of mJy and a 1.4-GHz flux of greater than Jy (Chapman et al. 2004a). Previous studies have shown that 60–70% of a submm sample flux limited at 5 mJy is detectable above our radio flux limit (e.g. Ivison et al. 2002). The radio limit places a joint restriction on the highest redshift and coldest dust temperature for SMGs detectable in this survey. SMGs with characteristic dust temperatures around 40 K begin to fall below our radio flux limit at , with colder SMGs missed at lower redshifts. The evolutionary models discussed by Chapman et al. (2004a) suggest that the radio-selected sample is likely to be 50% incomplete at . As we are only considering SMGs with measured redshifts we need to include the selection function from the spectroscopic identifications. Again, Chapman et al. (2004a) show that the bulk of the incompleteness in the spectroscopic follow-up (25% unidentified) likely arises from galaxies at –1.8, along with weak-lined, faint continuum sources over the full redshift range surveyed.
The OFRG sample from Chapman et al. (2004b) is defined by the absence of detectable 850-m emission (2.5- limit of mJy) from optically-faint, apparently star-forming Jy radio sources (, SJy) at . The star-formation classification is based on their restframe UV spectral properties. At their redshifts the radio-far-infrared correlation implies that these galaxies will have bolometric luminosities of . As Chapman et al. (2004b) discuss the lack of detectable submm emission from these luminous galaxies is most likely explained by their hot characteristic dust temperatures (see also Blain et al. 2004a). The OFRGs thus likely complement the SMG population, sampling the properties of similarly far-infrared luminous galaxies with somewhat hotter dust temperatures.
The combination of selection criteria means that we do not describe the sample as “complete” in any formal sense, rather, it is representative of the properties of a large fraction of the most far-infrared luminous galaxies at –3. In particular, we note that our sample is likely to be incomplete for the optically faintest SMG/OFRGs () due to our spectroscopic survey limit. This may include the reddest examples of the population brighter than our nominal near-infrared magnitude limit of . We attempt to quantify the possible biases from our selection criteria in the next section.
Before combining the three samples we check for differences in their photometric properties, finding median -band magnitudes of for the SMGs, for the OFRG and for the lensed SMGs (corrected to the source plane). Similarly the median for the SMGs, for the OFRG and for the lensed SMGs, while the median colors are: , and . Thus the median properties differ by less than 2- for the three samples and so we feel it is justifiable to combine the samples to study the photometric properties of luminous, dusty galaxies at high redshift. Nevertheless, we distinguish the OFRG and SMG samples in the plots so that the reader can judge the behaviour of the separate populations. The combined sample has , and . Removing all those galaxies which could be affected by photometric contamination changes these median magnitudes/colors by less than 0.3 .
3. Analysis and Results
3.1. Color-magnitude and color-color distributions
Our photometry for 96 SMG/OFRGs (Table 1) with complete redshift information allows us to study the restframe optical properties of a large sample of confirmed high-redshift dusty, luminous galaxies for the first time (c.f. Smail et al. 2002; Frayer et al. 2004). We show the color-magnitude plots for the sample in Fig. 1 and note that there is no strong trend of apparent color with redshift, once the selection boundaries imposed by the depth of our available imaging are taken into account.
The primary selection criteria for inclusion in our sample is detectable submm/radio emission ( mJy and/or Jy). The only other major selection criterion which censors the characteristics of the galaxies we can study are those that affect the measurement of a redshift. As discussed above there are two classes of SMG/OFRG for which it is more difficult to obtain spectroscopic redshifts, and hence maybe under-represented in our sample: both galaxies at –1.8, from which no strong emission or absorption features fall in the sensitive range of the LRIS spectrograph; and galaxies without emission lines at very faint magnitudes, (see also Chapman et al. 2003a, 2004a).
To determine how these selection criteria may have affected the optical-near-infrared photometric properties of our sample we begin by comparing the -band magnitudes and colors of our spectroscopic sample (Fig. 1), with those for the counterparts of a flux-limited submm survey which have been precisely located from their radio emission. This will highlight any biases which arise from our requirement for a spectroscopic redshift. Ivison et al. (2002) identify counterparts to submm sources with typical fluxes of 850m fluxes of mJy and for those with robust radio IDs (which comprise –70% of the whole submm population at this depth) they find that the fraction of the population with is 85%. Similarly, looking at the fraction of the population with unusually red colors, they find: % are extremely red objects (ERO)s with . This fraction rises to % with , while only 6% are blank (defined as and ). In comparison, for our spectroscopic sample we find that 90% are detected with , % of these have and % have . These contrast with fractions of 3% and 12% respectively seen in the general field population at the same median magnitude. Thus we have a lower fraction of the very reddest galaxies, but we appear to fairly sample those SMG’s with . We conclude that our spectroscopic sample of SMGs is broadly representative of the whole radio-identified submm population.
Comparing our colors to those measured for the counterparts in a purely submm-flux-limited sample is much more uncertain as in the absence of either a radio or an ERO counterpart it is difficult for such surveys to reliably identify the correct counterpart. Webb et al. (2003) show that % of their secure sample in the CFRS 03 and CFRS 14 (which includes SMGs both with and without radio counterparts) have (and % have ). In comparison, Ivison et al. (2002) quote a fraction of ERO counterparts of 22–27% in their full submm catalog, with between 6–43% blank.555Note that it has been suggested that a fraction of the radio-blank submm sources may be spurious, Greve et al. (2004b). Hence we conclude that if our sample is biased against optical/near-infrared–faint counterparts, then this bias is no worse than for a radio-identified sample.
There are two published analyses of the near-infrared colors of SMGs (Fig. 1): Frayer et al. (2004) and Dannerbauer et al. (2004). These studies provide photometry on small samples of lensed SMGs and radio/mm-identified MAMBO sources. We combine these two small samples and determine a median color of , with % having and , and % with . This compares with just % (4/61) with and % (11/61) with in our spectroscopic sample (and 8% and 15% respectively for the field population). The spectroscopic sample thus tends to be bluer than this faint, approximately flux-limited submm sample, although the small size of the latter means these difference are not significant.
![[Uncaptioned image]](/html/astro-ph/0412574/assets/x7.png)
Fig. 6 — The variation of apparent -band magnitude in a fixed 4′′ ( kpc) diameter aperture with redshift for the SMGs and OFRGs in our sample. We also plot the -band photometry of local ULIRGs from the 1-Jy sample of Kim et al. (2002) and for more distant systems from the sample of FIRST/IRAS galaxies of Stanford et al. (2000). In addition we show the compilation of -band photometry on powerful radio galaxies collected by Willott et al. (2003). Finally, we plot the expected variation with redshift for a non-evolving galaxy (where , Kochanek et al. 2001), and the best fit relation for the powerful radio galaxy sample from Willott et al. (2003).
We can also use our near-infrared imaging to determine whether we could select the counterparts to the SMG/OFRG in our sample, without the need for detectable radio emission. We find that our SMG/OFRG galaxies are either the brightest -band source within an 8′′-diameter region around their position (a typical error box for a submm source), or if not the brightest then typically the reddest galaxy in (Webb et al. 2003; Borys et al. 2004). For example of the 25 SMG/OFRG galaxies in the GOODS HDF-N field, 16 are associated with the brightest -band galaxy within 8′′, while the remaining 9 are on average mags redder in than any equally bright or brighter companions (with only 3/25 or 12% being bluer). We caution that our spectroscopic sample will tend to have brighter counterparts (in all bands) compared with a purely submm-selected sample. Hence, unfortunately, this approach does not provide an unambigious identification of the true counterparts to complete samples of submm sources. Moreover, as we show below, the counterparts across our sample already span magnitudes in their -band brightness – hence the identity of the true counterpart will always remain ambigious. In part this reflects the fact that the -band emission from these galaxies is only weakly coupled to their far-infrared emission, in contrast to their radio emission which arises from a closely related process. Recent mid-infrared observations from Spitzer suggest that this may also prove to be a useful waveband for obtaining complete identifications of counterparts to submm/mm sources (Ivison et al. 2004; Egami et al. 2004).
The distribution of our SMG/OFRG sample on the – color-color plane (Fig. 2) follows the same color-color distribution as the general field population, with a tendency for redder colors in both and . Such color-color plots have been discussed as a tool to distinguish different classes of EROs (Pozzetti & Mannucci 2000; Bergstrom & Wiklind 2004) and have been tested with submm and radio-selected samples (Webb et al. 2003; Dannerbauer et al. 2004; Smail et al. 2002b). The proposed classification boundary between the passive and dusty populations appears to split the current sample, rather than confining it to the dusty-side of the classification region. As our SMG/OFRG sample are selected to be far-infrared luminous systems, it seems unlikely that their colors are dominated by old, passive stellar populations. Rather, we view this failure as an indication that simple two-color classification schemes may be ineffective for isolating dusty EROs due to the complex mix of obscured and unobscured emission in these systems. We emphasize that this failure persists when we just isolate those SMG/OFRG EROs at (c.f. Bergstrom & Wiklind 2004). We also reiterate that only a modest fraction of SMG/OFRGs have red enough colors, –30% with , to be judged to be unusual (Smail et al. 1999a; Webb et al. 2004) and hence this type of classification scheme is only of limited use for the SMG/OFRG population.
3.2. Morphological properties
We show true color representations of 20 galaxies from our sample which lie within the GOODS-N field in Fig. 3. These are derived from the HST ACS images of this field. This sample spans –3.6 and contains 11 SMG/OFRG’s with but no galaxies with : SMM J123712.05 with and RG J123640.74 with are the reddest in the sample. Four of these systems have estimated bolometric luminosities in excess of L⊙.
We can use the high-resolution optical imaging to classify the morphologies of these reliably-identified dusty, galaxies and contrast these with conclusions from similar studies with much less robust counterparts (e.g. Smail et al. 1998). We find that just over half of the sample (50–60%) are apparently multi-component or disturbed systems, suggestive of mergers or interactions. However, we caution that the presence of highly-structured dust within these galaxies might mimic such structural pecularities (see Fig. 4 and also Smail et al. 1999b). 25% of the remaining SMG/OFRG are peculiar, including two face-on spirals, one of which has a ring; and only 15% are regular/normal. Of the apparently multi-component systems, half contain at least one component which is an obvious disk galaxy.
The median angular scale of these galaxies is kpc arcsec-1 and it varies by only % over their redshift range, from 8.2 kpc arcsec-1 at up to 8.5 kpc arcsec-1 at and then dropping back to 7.4 kpc arcsec-1 at . Hence the changing apparent size of these galaxies either reflects variations in their true physical extents, or surface brightness dimming. There is clearly a trend for smaller systems at higher-redshifts, however, the scatter at a fixed redshift is at least as large as the variation due to this trend. The median apparent size of the whole sample is , measured at a fixed isophote (2.5 of the sky) along the major axis of the objects in the combined images. Using their redshifts we calculate that this corresponds to an average physical size of kpc. We also measure the half-light radii of the SMGs in an analogous manner to that used by Ferguson et al. (2004), on the same HST data, and compare these to their distribution for the general optically-selected population at (using the 15 galaxies in our sample with –3 – giving a similar average redshift for the subsample). We show this comparison in Fig. 4, which demonstrates that the average SMG/OFRG in our sample at is roughly twice as large as a typical optically-selected galaxy from a similar magnitude-limited sample at this epoch.
Our results on the morphologies and sizes of the submm population echo those of Chapman et al. (2003b) – who concluded from their sample of 13 submm-selected galaxies with STIS or WFPC2 imaging, that 83% have irregular morphologies and just 17% had regular structure (this is almost identical to the % and % for our sample). Chapman et al. (2003b) also compared the UV sizes of their SMGs to samples of LBGs and magnitude-matched optically-selected galaxies and suggested that the SMGs were larger than either of these comparison samples. The availability of redshifts for our sample has allowed us to demonstrate that these dusty, luminous systems are on average twice as large as the typical galaxy at their epoch.
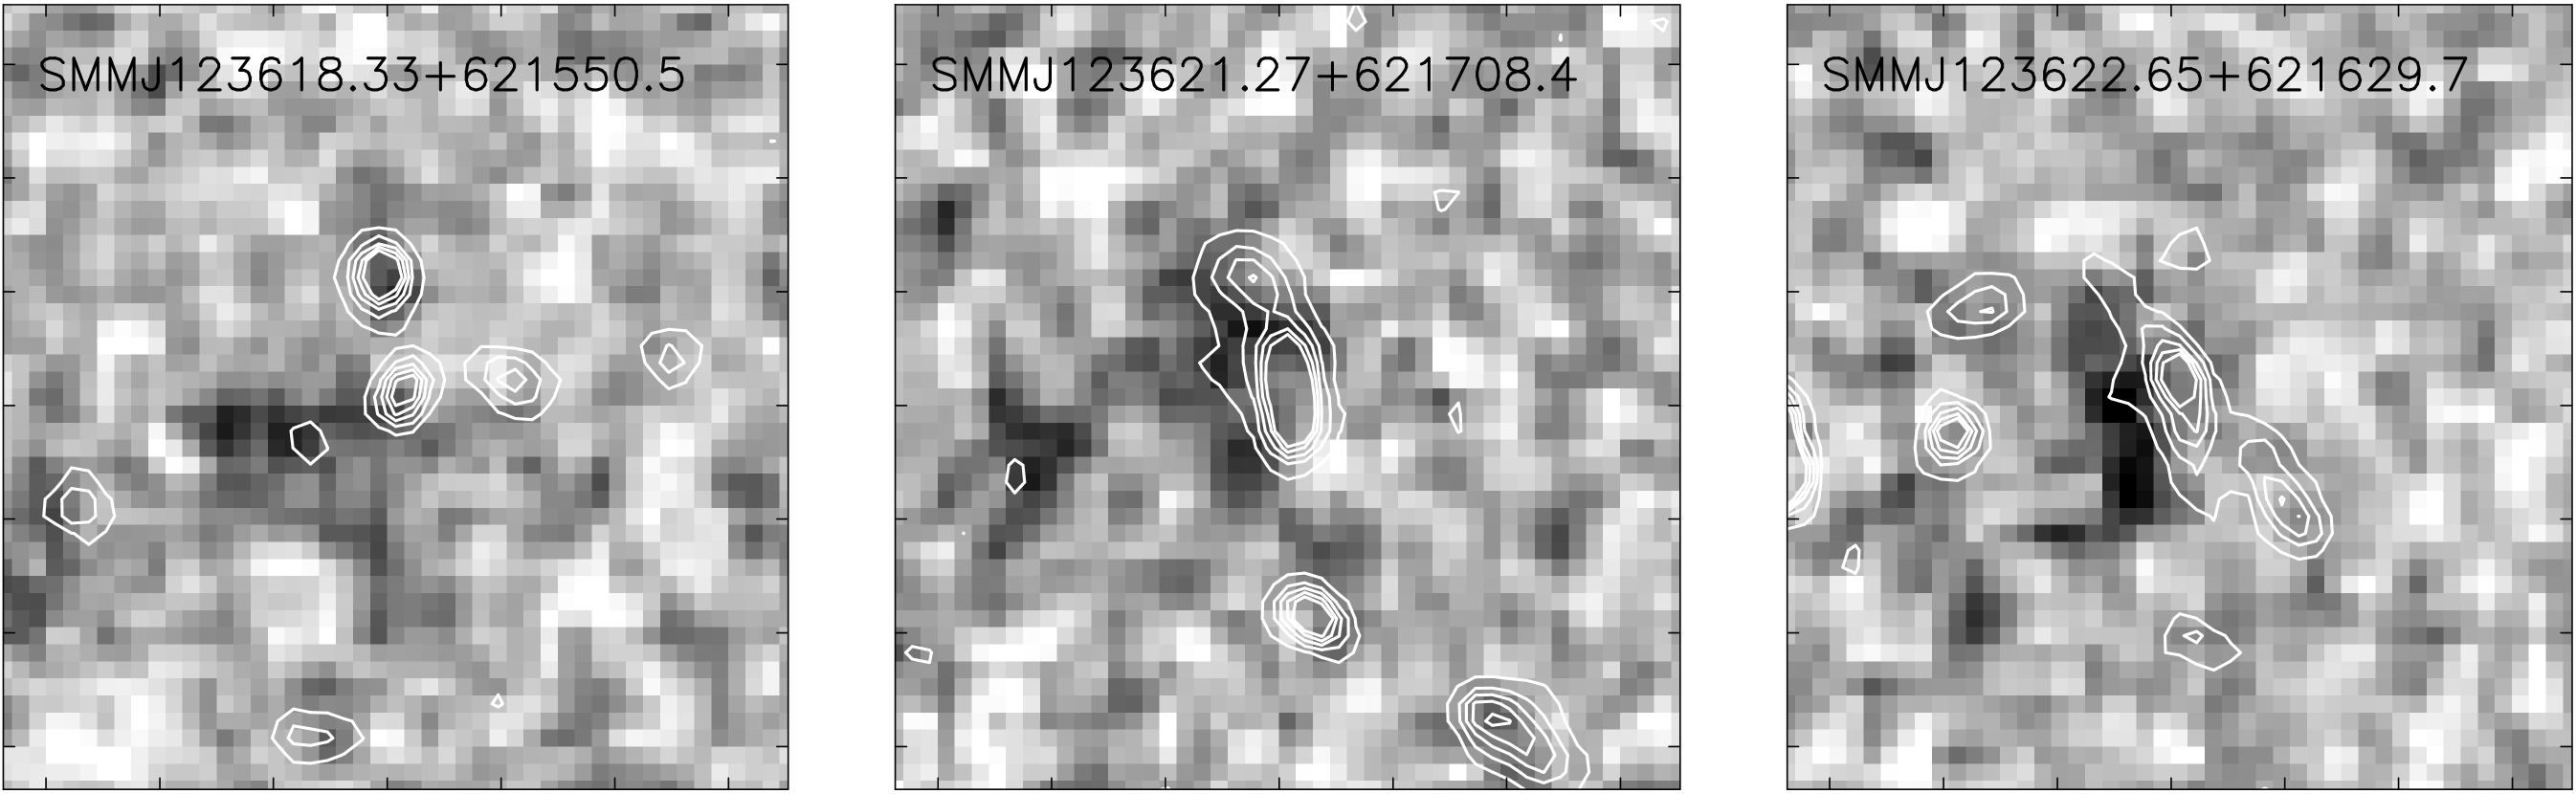
We have also compared the observed -band and optical morphologies of all the galaxies in the GOODS HDF-N region to search for more obscured components within these systems. We find that % (3/18) of the sample display near-infrared morphologies which strongly deviate from those seen in the optical. We show these three galaxies in Fig. 5 – where we see that there are extremely red components within some of these systems, with , on scales from 5–20 kpc. We also find evidence for dust extinction within some of the systems, which may help to explain the apparently disturbed, multi-component structures of these galaxies. The near-infrared morphologies of some of our SMG/OFRGs show strong similarities to those of high-redshift luminous radio galaxies (Pentericci et al. 2001), hinting at a similar mode of triggering for the activity in these two populations. The presence of very red components on scales within some SMG/OFRGs underlines the need for large-aperture photometry to derive reliable colors for the whole system (c.f. Dannerbauer et al. 2004). We will discuss the internal structure of the SMGs on kpc scales in a future paper using a sample of HST NICMOS and ACS imaging of galaxies from our spectroscopic SMG/OFRG sample.
3.3. Magnitude–redshift and color–redshift distributions
We now begin to investigate the variation of galaxy properties with redshift within our sample. We show in Fig. 6 the -band Hubble diagram for our sample of dusty, luminous galaxies and compare this to the behaviour of local and more distant ULIRGs, as well as samples of powerful, high-redshift radio galaxies.
We note that we see no trend of -band magnitude with within the SMG/OFRG sample. This is at odds with Smail et al. (2002b), who suggested galaxies which were fainter submm sources might also be fainter in -band (but see Webb et al. 2003). However, we caution that our current sample is restricted in the brightness of the counterparts by the need to measure a spectroscopic redshift and hence is not ideal for performing this test. In particular, the 5-mJy submm flux limit for our SMG sample means that we have only marginal overlap with the flux regime studied by Smail et al. (2002).
Turning back to the – relation in Fig. 6, and discarding the two bright -band counterparts which are obvious broad-line AGN, we see that the bright wing of the SMG/OFRG distribution matches that traced by high-redshift luminous radio galaxies, roughly corresponding to . However, in contrast to the tight radio galaxy distribution, the SMG/OFRG sample spans 4–5 magnitudes range in -band brightness at a fixed redshift, and roughly tracks the predicted locus of an unevolving elliptical galaxy. The large variation in the -band magnitudes of SMG/OFRG is perhaps unsurprising given that many of these galaxies appear to be multi-component systems, with strong internal extinction and young starburst ages (Smail et al. 2003a).
![[Uncaptioned image]](/html/astro-ph/0412574/assets/x8.png)
Fig. 7 — The distribution of SMG/OFRG on the – plane. We compare this to the predicted colors as a function of redshift of three local ULIRGs derived from their observed restframe UV SEDs by Trentham et al. (1999). We see that there is a wide range in apparent colors of SMG/OFRG at a fixed redshift, in line with that expected from the restframe UV colors of local ULIRGs. We believe the diversity of colors probably reflects a wide range of internal obscuration and mix of components within these galaxies – the presence of multiple components and highly-structured dust is also indicated by the UV and near-infrared morphologies of these galaxies (Figs. 3 & 5). We scale the size of each point with the reddening-corrected absolute -band magnitude of the galaxy, assuming a constant star formation rate model. For completeness we note that there is no significant correlation of median colors with 850-m flux and no correlation of 850-m flux with redshift (Chapman et al. 2004a).
We fit a simple polynomial relation to the variation of -band apparent magnitude with redshift for the SMG/OFRG sample (having removed the two obvious luminous AGN at ) and derive a best-fit relation of with a scatter of mags around this.666Removing those objects whose photometry may be contaminated by near neighbors does not significantly reduce the scatter in this fit. Similarly, removing SMM J030238.62+001106.3, the outlier at /, only reduces the scatter to mags. We believe that the redshift for this source probably refers to an unrelated foreground dwarf galaxy, with the true SMG counterpart being even fainter and at . This scatter is 60% higher than that seen in the luminous radio galaxy population at similar redshifts (Willott et al. 2003). The SMG/OFRG sample also shows an offset of from the radio-galaxy – relation of Willott et al. (2003) – indicating that the SMG/OFRG are intrinsically less luminous in the restframe -band than powerful radio galaxies at the same redshift. Applying the reddening estimates from the photometric modeling (§3.5) reduces the scatter in the SMG/OFRG – relation by 10–20%: although the fainter galaxies tend to be bluer in at a fixed- (Fig. 7) and so have lower estimated reddenings. Looking at the scatter around this fit for the 11 galaxies with bolometric luminosities of and -band coverage, we find only a marginally smaller dispersion mags. If we fit the polynomial to just these 11 galaxies the dispersion of the fit drops marginally to mags, but a Monte Carlo simulation indicates that this reduction in scatter is not statistically significant, with the fits for 17% of random samples of 11 SMG/OFRGs from our catalog showing dispersions below 0.74 mags (c.f. Serjeant et al. 2003). A definitive conclusion about the tightness of the – relation for the most luminous galaxies will have to await a larger and more homogeneous sample than either of those used so far.
We can also invert the -band Hubble diagram and ask how precisely we could estimate the redshifts for an SMG/OFRGs given an apparent -band magnitude. We determine a simple linear relation with with (again after discarding the two bright AGN). Hence near-infrared photometry provides only a very crude measure of the redshift for SMG/OFRG.
Finally, we look at the variation in the optical-near-infrared colors of the sample with redshift. As Fig. 7 shows, we find no discernable trends in the median (or ) with , with the gradients of fits to the median values of three bins with equal numbers of galaxies consistent with zero. The trends of color with redshift are roughly bracketed by the predicted tracks for three local ULIRGs from Trentham et al. (1999), once allowance is made for our likely incompleteness for the reddest galaxies (§3.1). However, there is a substantial fraction of the population which are even bluer in than the bluest of the three ULIRGs observed by Trentham et al. (1999), although this is hardly surprising given their small sample. We attribute the wide variation in restframe UV–optical colors of SMG/OFRGs to differing levels of obscuration and mixes of unobscured and obscured components within the galaxies. In part this variety may come about as a result of different ages for the activity within the systems, with systems becoming less obscured as they age, or by differences in the porosity of the obscuring material brought about through the actions of winds and outflows. Less-obscured channels would provide an essential conduit for the escape of the Ly emission frequently identified in the spectra of this purportedly dusty population (Chapman et al. 2003, 2004a, 2004b).
3.4. Comparison to other high- populations
Recently a number of studies have been published dealing with the colors of faint field galaxies. A central claim of this work is that photometric selection in this color, specifically , is a reliable a route to identify galaxies at (Franx et al. 2003; Daddi et al. 2003). The % (11/61) of the SMG/OFRG with in our sample have median properties of and , with one example at and the remaining ten at –2.62. This confirms that, at least for these dusty, active galaxies, a cut at can cleanly select high- counterparts to SMG/OFRGs. For comparison a selection leads to 30% of the sample at –1.5.
To estimate how large a fraction of the photometrically-selected population consists of SMG/OFRG we first estimate the median submm flux for this subsample, finding mJy. Submm sources with this flux density have a corresponding surface density of arcmin-2 and hence the spectroscopic fraction in our sample has an effective surface density of arcmin-2, representing only about 6% of the overall population with . The proportion of submm-bright galaxies may correspond to at most 10% of this photometric class, suggesting that the overlap between the photometrically-selected sample and SMG/OFRGs is at best modest (see also Dannerbauer et al. 2004). A similar analysis of UV-selected high-redshift samples by Chapman et al. (2000), confirms that extreme near-infrared colors do not appear to isolate the far-infrared luminous fraction of the high-redshift galaxy population. However, given their apparently large stellar masses (and strong clustering, Daddi et al. 2003) it seems likely that the passive and recently star-forming galaxies with very red near-infrared colors at could be immediate descendents of the short-lived SMG/OFRG population.
![[Uncaptioned image]](/html/astro-ph/0412574/assets/x9.png)
Fig. 8 — The restframe SEDs of those SMG/OFRGs which are detected in both the - and -bands (73% of those with -band observations). These are arbitrarily normalised based on their monochromatic flux at 0.5 m. We show the SEDs of the individual galaxies and also the median of these as a function of wavelength, along with the 1- scatter on this estimate. The median SED shows a very red continuum shape with a discontinuity in the continuum slope around m. We compare this to two simple model SEDs: for an evolved stellar population, a luminous local elliptical galaxy; and a dusty star-burst, based on a 100-Myr old constant star formation model with from Leitherer et al. (1999). The dusty, young star-forming galaxy appears to provide a better match to the observed SED and suggests that the discontinuity in the continuum slope is associated with the Balmer break (highlighted by the shaded region).
We can also compare the photometric properties of our SMG/OFRG sample with samples of UV-selected star-forming galaxies identified at similar redshifts: the Lyman-break galaxies (LBGs). For a sample of 18 SMG/OFRGs cut in redshift to match the redshift distribution and median redshift of LBGs in Shapley et al. (2001), –3.4, we find , and . By comparison, Shapley et al. (2001) LBG’s have (), after transforming from using appropriate for galaxies with their observed colors at , and . Hence the SMG/OFRGs lying within the redshift range of the classical LBG selection are typically twice as bright in the -band (restframe -band) and slightly redder in their restframe UV and optical colors. However, we note that our radio-selected sample would be incomplete for the faintest SMGs if there is a strong correlation between -band and radio luminosities, leading to the detected SMGs being brighter, but bluer, than would be seen in a pure submm-selected sample.
The classical LBG samples lie at somewhat higher redshifts than the majority of our SMG/OFRG sample (this may in part be responsible for the poor overlap between these two populations, Chapman et al. 2000). Recent work by Steidel et al. (2004) has extended their photometric selection techniques to lower redshifts, –2.6, giving a better match for comparison to the bulk of the SMG/OFRG population. These “BX/BM” samples (mean ) are brighter and redder than the LBG population: (for ) (adopting ). The equivalent measurements for the 57 SMGs/OFRGs at –2.6 (mean ) in our sample are and . Again we find that the SMG/OFRG are both brighter and redder than the UV-selected population at . The difference in -band magnitude amounts to roughly a factor of two difference between the typical restframe -band luminosities of these two populations. Without more information it is impossible to determine whether this results from the larger stellar masses of the SMG/OFRG sample, or to a strong contribution to their restframe -band fluxes from the H line which will fall in the observed -band at their typical redshifts. Swinbank et al. (2004) discuss near-infrared spectroscopy of a sample of SMG/OFRG and conclude that the H line typically contributes only about 10% of the broad-band flux and so we suggest that the difference in mean -magnitude probably reflects the brighter continuum luminosity of the SMG/OFRG galaxies. Similarly, it is unlikely that emission-line contributions strongly skew the observed colors of the SMG/OFRG, suggesting that the SMG/OFRG have redder continua than the average BX/BM galaxy – although without more detailed modeling it is impossible to tell whether this is due to either more evolved stellar populations or dust reddening. Mid-infrared photometry of spectroscopically-identified SMG/OFRG from Spitzer should provide a powerful tool to distinguish between these alternative explanations.
![[Uncaptioned image]](/html/astro-ph/0412574/assets/x10.png)
Fig. 9 — The ratio of restframe -band luminosity to far-infrared luminosity as a function of far-infrared luminosity for the SMG/OFRG sample. We also show the distribution of the local ULIRGs in the 1-Jy ULIRG sample of Kim et al. (2002) and the luminous infrared galaxy sample of Veilleux et al. (1995), converted from and respectively to using median colors of and corresponding to SEDs with their observed colors at .
3.5. Simple photometric modeling
To try to constrain the extinction and ages of the activity in the SMG/OFRG population we have sought to exploit the combination of broad-band photometry and redshifts available for our sample. We start by simply plotting the restframe spectral energy distributions (SEDs) of the 46 galaxies with - and -band detections in Fig. 8. If the galaxies have similar restframe SEDs then their spread in redshift enables us to recover information about the SED shape on a finer scales than provided by the broadband colors. We have therefore also calculated the median restframe SED of this population and show this in Fig. 8. The median SED shows a red continuum from –0.7 m, with an apparent break to a steeper continuum slope below m. We compare this to the SED of an evolved stellar population and a young, highly-reddened star forming galaxy from starburst99 (Leitherer et al. 1999). The continuum slope in the red and the position of the break in slope are both more consistent with the dusty, starburst model – with the discontinuity in the continuum slope arising from the Balmer break. However, we caution that the -band lies at m at the median redshift of our sample and hence the strength of the apparent discontinuity may change if we included those galaxies with only limits on their -band fluxes.
To provide a more quantitative analysis of the colors of SMG/OFRGs we have fitted the observed photometry of the galaxies at their observed redshifts using hyper-z (Bolzonella et al. 2000) to derive reddening estimates for the stellar populations in these systems, assuming that they are dominated by young starbursts (consistent with their intense far-infrared emission and the median SED derived above). For the underlying star formation histories we adopt either a single burst or constant star formation rate (SFR) model and a Calzetti reddening law with . We use a likelihood ratio test to select the best-fitting model at the known redshift, indicating that 66% are better fit by the instantaneous burst models. We derive a mean age of the stellar populations in the SMG/OFRG sample of Myr and a mean reddening of . This reddening is consistent with the range measured for the nuclear regions of local ULIRGs (Scoville et al. 2000). We also find, as expected, that the derived reddening correlates with at a fixed redshift and that the best fit ages are older at lower redshifts.
While the photometry for the majority of SMG/OFRGs are well fit by these simple models, with 85% having probabilities for the fits of %, we caution that the constraints on individual galaxies are very weak and so in our discussion we will focus on the ensemble properties of the sample (although we stress that the availability of precise redshifts removes much of the ambiguity in this analysis). We also note that the worst-fitting sources include several bright AGN and that the galaxies with poorly-fit SEDs are uniformly distributed across the fields in our survey. To investigate the systematic errors in these estimates we fit either just a single burst model or a constant SFR model and derive mean ages and reddenings of Myrs and or Myrs and respectively. The relatively old ages for the single burst model are inconsistent with the detection of strong far-infrared emission from star formation in these galaxies, and so we interpret them rather as an indication of past star formation activity within these galaxies (on 100’s Myr timescales). For this reason we prefer to use the reddenings and luminosities derived from the constant star formation model fits in the analysis that follows.
To attempt to compare the results of this modelling between populations, we have also applied this same fitting technique to the photometry of the LBGs in Shapley et al. (2001). Here we derive a mean age of Myr and a mean extinction of . Restricting ourselves to only a constant SFR model and requiring that the derived ages are in excess of 10 Myrs, we measure a mean age of Myrs and reddening of , roughly consistent with the Myrs and determined from a more careful analysis of their colors by Shapley et al. (2001). As we noted earlier, Steidel et al. (2004) have already shown that LBGs are bluer/fainter in their restframe than the BX/BM population – so it would be informative to repeat this comparison when near-infrared photometry becomes available for the latter.
Given the uncertainties in this analysis and our limited dataset we conclude that the restframe UV/optical emission from the SMG/OFRG population is dominated by the light from a highly reddened and very young stellar population, with an age of just a few 100’s Myrs and typical continuum extinction corresponding to a factor of obscuration at 1500Å. We estimate the reddening for the SMG/OFRG to be at least twice that of the LBGs we have analysed, and perhaps more as a result of the degeneracy in the fits between older ages and increased reddening. This indicates that the redder optical/near-infrared colors we measured in §3.4 for the SMG/OFRG sample result from stronger extinction compared to the LBGs and BX/BM populations. Correcting for this stronger extinction would suggest that the SMG/OFRG’s have dust-corrected, restframe optical luminosities at least five times brighter than typical BX/BM or LBG systems.
![[Uncaptioned image]](/html/astro-ph/0412574/assets/x11.png)
Fig. 10 — The absolute restframe -band magnitudes of SMGs and OFRGs with redshifts lying in –2.5 (beyond which our -band imaging becomes increasingly incomplete for counterparts with ). We overplot fits to the data points (shown as filled symbols) for both Schecter and Gaussian function fits. For the Schechter function fit we derive and . From a Gaussian fit we estimate and . We also show the restframe -band luminosity function derived for LBGs by Shapley et al. (2001) and that of local ULIRGs from the 1-Jy sample. These demonstrate that the typical SMG/OFRG has a similar restframe optical luminosity to ULIRGs at (although it is several times brighter in the far-infrared) and has a characteristic luminosity which is brighter than the somewhat higher-redshift LBG population (correcting for dust extinction will exacerbate this difference).
We can also test the consistency of the estimated ages and luminosities by determining whether it is possible to form the observed stellar population given the estimated star formation rate for the galaxies within the proposed timescale. We take the median -band luminosity from the hyper-z SED fits and correct this on a case-by-case basis with the estimated reddening for each galaxy, giving us a median dereddened -band luminosity of LL⊙. For a system with a constant star formation rate and an age of a few 100’s Myrs we require an SFR of 1000 M⊙ yr-1 (for stars more massive than 1 M⊙) to build up this luminosity. The median far-infrared luminosities of the SMG/OFRG sample is corresponding to an SFR of M⊙ yr-1 for stars more massive than M⊙. This suggests that the star formation activity in the average SMG/OFRG is more than sufficient if it was maintained at the current level to produce the observed optical luminosities within the last 100 Myrs. However, we feel it is more likely that the activity is episodic, probably comprising short Myr bursts spread over several 100’s Myrs. Such behaviour would be consistent with that expected from merger-driven starbursts (Mihos & Hernquist 1996), as well as the apparent masses of black holes seen in some SMGs (Smail et al. 2003a, 2003b).
We can also use the estimated mass-to-light ratios of young starbursts derived using starburst99 (Leitherer et al. 1999) to estimate a minimum stellar mass for these systems: this gives an average mass to light ratio of M for a system with either a constant SFR over a few 100 Myrs or a Myr starburst. Applying this to our reddening-corrected median -band luminosity, we estimate that the typical SMG/OFRG contains M⊙ of young stars, in addition to any underlying older, more evolved population. Furthermore, millimeter-wave CO mapping of a handful of SMGs (Frayer et al. 1998, 1999; Neri et al. 2003) indicates that the median gas mass in submm-luminous galaxies is of order M⊙. This suggests that many of our SMG/OFRG retain enough gas to continue forming stars at the current rate for a similar length of time to their current ages. Combining the stellar and gas masses gives a typical baryonic mass for an SMG in our sample of M⊙. This is comparable to the stellar mass of an L∗ galaxy at the present-day (Cole et al. 2001), indicating that over half our sample are likely to leave descendents at the present-day (Genzel et al. 2003).
3.6. Comparison to ULIRGs
There is a class of obscured, active galaxies at relatively low redshifts which have almost comparable far-infrared luminosities to those estimated for the SMG/OFRG population: the ULIRGs. If we can demonstrate that SMG/OFRGs share the same properties as ULIRGs, then we can use the much more detailed observational information available on the latter to infer more about the processes which may operate in the more distant population.
To compare the properties of the SMG/OFRG sample with similarly luminous low-redshift galaxies we begin by using the restframe -band luminosities from the photometric modeling described in the previous section. We stress that at the typical redshift of our SMG/OFRG sample the restframe -band is straddled by our observed photometry making this estimate of their optical luminosities relatively straightforward. We plot the ratio of the -band and far-infrared luminosities for our sample as a function of their far-infrared luminosities in Fig. 9. We compare this distribution to the equivalent measurements for the samples of ULIRGs from Kim et al. (2002) and luminous infrared galaxies from Veilleux et al. (1995). For comparison, the median far-infrared luminosities are L⊙ for the 1-Jy sample, converted to our cosmology, L⊙ for –2.5 SMG/OFRG and L⊙ for the full SMG/OFRG sample. Together these samples exhibit a broad trend of lower LV/LFIR at higher luminosities, which has been interpreted as a signature of an increasing fraction of highly obscured star formation in more active systems (e.g. Serjeant et al. 2003).
As expected, the lower luminosity (usually lower redshift) systems within the SMG/OFRG sample are distributed within the broad correlation seen in the local far-infrared-selected samples, indicating that these galaxies are likely to be entirely analogous to similarly luminous, low redshift systems selected from IRAS surveys.
The more typical, higher luminosity and higher redshift, SMG/OFRG extend the trends seen in the lower-luminosity samples to lower LV/LFIR in more luminous galaxies, although with two orders of magnitude scatter at a fixed luminosity. To quantify the trend we see, we calculate the median LLFIR of the –2.5 SMG/OFRG (LL) and for the IRAS 1-Jy sample of Kim et al. (2002), LL, showing that the SMG/OFRG are roughly four times more obscured than local ULIRGs (Fig. 9).
We have also used the restframe -band absolute magnitudes for the SMG/OFRG to construct a luminosity function for an approximately volume-limited sample of SMG/OFRG brighter than at –2.5. This is shown in Fig. 10 and exhibits a steep rise at , with a decline at which we attribute to incompleteness. We compare it to the equivalent distribution for the 1-Jy sample of local ULIRGs (Kim et al. 2002), which has a median absolute -band magnitude of , converted from using a typical color of suitable for a galaxy SED at with . The galaxies in the –2.5 SMG/OFRG sample have an almost identical median absolute magnitude: . Thus the absolute -band luminosities of the local ULIRGs and the distant SMG/OFRG are very similar (Fig. 10), indicating that the factor of four difference in their LV/LFIR ratios (Fig. 9) is most likely due to the higher far-infrared luminosities of the distant galaxies. This is consistent with a constant star formation efficiency for low- and high-redshift starbursts (c.f. Baugh et al. 2004), given the factor of 3 times higher gas fractions and larger gas masses seen in the distant SMG/OFRGs (Frayer et al. 1999; Neri et al. 2003).
3.7. Evolution of SMGs
As the final step in our analysis we wish to understand the evolution of SMG/OFRG to the present day. To do this we take one extreme scenario – and assume that the star formation activity we see is the last major event in these galaxies and that their subsequent evolution can be approximated by passive evolution. We can then employ simple stellar evolution models to predict the likely luminosity function of this population at lower redshifts and compare that to possible descendent populations. As we discussed in §3.5, the large gas reservoirs detected in SMGs through their CO emission suggests that these galaxies retain enough gas to modestly increase their stellar masses. However, for the purposes of this simple discussion we will ignore any additional sources of new stars.
To quantify our discussion, we use the characteristics of the SMG/OFRG sample from our earlier analysis. We correct the restframe -band luminosities of the galaxies using their individual estimates of from the constant SFR fits and derive a reddening-corrected absolute magnitude of for a sample with a median redshift of . The luminosity-weighted ages we derived from our hyper-z fits were a few 100’s Myr, consistent with the expected ages of the starbursts in these massive galaxies from dynamical arguments. We now turn to the pegase spectral modeling package (Fioc & Rocca-Volmerange 1997) to estimate the restframe -band fading of a system with a constant star formation for –500 Myrs (bracketing the likely range in ages), which is terminated at that point and is observed 5.3 Gyrs later (corresponding to the time between and ). We find that the stellar populations are expected to fade by between and magnitudes and so we take as representative. Thus, the typical SMG/OFRG will have at assuming there are no subsequent star formation events.777We have chosen to undertake this comparison with clusters as the passive galaxies populating the faint end of the luminosity function in more local clusters may be built up through a different process, involving passive fading or more active threshing/harassment of mid-/late-type disk galaxies accreted by the clusters since –1 (Dressler et al. 1997; de Lucia et al. 2004; Kodama et al. 2004). Hence this comparison is most easily achieved with a distant cluster where the luminous elliptical population can be more easily isolated.
The proposed evolution of the luminosity function for SMG/OFRGs is illustrated in Fig. 11. This shows the observed restframe -band absolute magnitude distribution of the SMG/OFRG sample, the same distribution corrected on an object-by-object basis for the estimated reddening, and then finally this distribution faded by 4 magnitudes to represent the passive evolution from to . The final distribution is compared to that of morphologically-classified spheroidal galaxies (almost all of which are ellipticals) in three clusters from the study of Ellis et al. (1997) (with arbitrary normalisation). This comparison suggests that in this simple evolutionary picture the SMG/OFRG population can adequately match the bright end of the luminosity function of spheroidal galaxies seen in cluster environments. This is clearly highly speculative, but taken in conjunction with the large stellar masses we derive for these galaxies, their large dynamical masses (Swinbank et al. 2004; Neri et al. 2003; Greve et al. 2004a) and their strong clustering (Blain et al. 2004a), it provides circumstantial evidence for the association of the SMG/OFRG with the early formation of the most luminous () spheroidal galaxies.
![[Uncaptioned image]](/html/astro-ph/0412574/assets/x12.png)
Fig. 11 — This plot shows the observed restframe -band luminosity function for the –2.5 SMG/OFRG sample along with a best-fit Gaussian function, the same distribution corrected for reddening using the individual extinction corrections estimated from the hyper-z fits to their colors, also overlayed with its best-fit Gaussian function and finally this same functional fit, after fading by magnitudes corresponding to passive evolution for 5.4 Gyrs starting with a galaxy with a constant star formation history and an age of 100–500 Myrs at . This predicted luminosity distribution is compared to the observed luminosity function of morphologically-classified E/S0 galaxies in three clusters from Ellis et al. (1997), adopting an arbitrary normalisation.
4. Discussion and Conclusions
Our aim in this paper is to relate quantitatively the various populations of galaxies and AGN now being uncovered in large numbers at . To give a qualitative indication of the form this relation might take we note that one popular model for the creation of luminous, metal-rich elliptical galaxies has them formed through a short, intense but highly obscured, burst of star formation at high redshifts. Such activity would be naturally related to the SMG population (Lilly et al. 1999; Smail et al. 2002b). Similarly, the proposed presence of supermassive black holes in all luminous ellipticals and the claimed correlation of their black hole masses with the stellar mass of their host spheroids, argues that their progenitors are all likely to have exhibited some form of nuclear activity during their formation phase. Can we therefore use the space densities and likely lifetimes of the SMG, QSO and elliptical galaxy populations to test a simple framework where SMGs represent the monolithic formation of massive elliptical galaxies and evolve through a QSO phase (Sanders et al. 1988; Page et al. 2004)?
The volume density of bright SMGs is Mpc-3 at (Chapman et al. 2003a, 2004a). Including the submm-faint, but similarly far-infrared luminous, OFRG population will roughly double this estimated space density. The combined population will then be about more numerous than optically-selected QSOs with at this epoch (Boyle et al. 2000). Similarly, luminous, evolved galaxies at have a space density which is about higher than that of SMGs (Cimatti et al. 2002), and comparable to that of elliptical galaxies at . The redshift range covered by the bright SMG population corresponds to a timespan of roughly 1–2 Gyrs, suggesting that if individual SMGs are identified with luminous, evolved galaxies at and ellipticals at the present-day then individual SMG’s must have lifetimes of only 100–200 Myrs (see also Serjeant & Takagi 2004). We have shown earlier that this lifetime is sufficient to allow these galaxies to build up an L∗’s worth of stars, given the SFRs inferred from the far-infrared luminosities of bright SMGs ( M⊙ yr-1). Indeed, the reddening-corrected, restframe -band magnitudes of these galaxies imply that many already have substantial stellar masses (consistent with them being L∗ galaxies). The ratio of SMG to QSO volume densities would then imply that the latter phase lasts around 10–20 Myrs. This is then broadly consistent with independent estimates of the lifetime of bright QSOs (Martini & Weinberg 2001) as well as the relative ratio of submm-detected QSOs as a fraction of the QSO and SMG populations (Stevens et al. 2004; Chapman et al. 2004a).
Thus we have a quantitatively self-consistent scenario. SMG/OFRG’s are cumulative 100–200 Myr-long star formation events which build the stellar population of an L∗ elliptical galaxy at –3, before going through a 10 Myr-long QSO phase and then evolving to become the passive EROs seen at (perhaps via a phase with at , Cimatti et al. 2004) and subsequently the luminous elliptical population seen in intermediate and low-redshift clusters.
The alert reader will notice that there is no mention of the important UV-selected high-redshift galaxy populations in the framework outlined above. This is because we believe there are strong reasons to expect that the typical UV-selected, star forming galaxy at –3 is less massive than those identified through current far-infrared surveys. This belief is based in part upon the differences in the restframe optical luminosities of the two populations we have uncovered. It is strengthened by the apparent differences in the dynamical mass estimates of small samples from the two populations (Swinbank et al. 2004; Erb et al. 2003) and from the strong clustering seen in far-infrared-selected population (Blain et al. 2004a). All of these observations point toward SMG/OFRG’s being several times more massive than typical UV-selected, high-redshift galaxies. Hence, it is unlikely that a typical UV-selected galaxy will experience a ULIRG-like phase in its evolution – although mergers of two such systems may produce sufficiently intense activity.
There are, however, problems with the simple evolutionary picture we have outlined. Not least of these are the suggestions that both SMGs (and the very red near-infrared population at ) are strongly clustered with correlation lengths of order Mpc (Blain et al. 2004a; Daddi et al. 2003). This is roughly twice that measured for typical QSOs at this epoch (although perhaps consistent with the brightest, see Croom et al. 2000). This may indicate that bright SMG/OFRG’s do not evolve into typical QSOs, or that a more complex temporal bias is operating (Scannapieco & Thacker 2003). More reliable clustering measurements will be needed for all populations before this is a critical issue – yet it remains a concern.
A second test of this simple evolutionary picture will be provided from more reliable measurements of the stellar masses of the various populations. At –3 this requires sensitive mid-infrared imaging to access the restframe near-infrared emission, where effects from recent star formation and reddening are minimised. Spitzer has demonstrated the capability to detect the majority of the host galaxies of high-redshift, far-infrared selected galaxies (Egami et al. 2004; Ivison et al. 2004 Frayer et al. 2004; Serjeant et al. 2004; Charmandaris et al. 2004), and promises to be an important tool for further study of this population.
We summarise our main conclusions:
-
1.
We have compiled a large catalog of optical/near-infrared photometry for far-infrared luminous galaxies selected from deep submm and radio surveys. In total we have spectroscopic coverage of all 96 galaxies in our sample. Comparing the optical/near-infrared properties of our optically-faint radio galaxy and radio-selected submm subsamples we find no significant differences between these two populations. This supports the claim that they represent related subsets of the high-redshift far-infrared luminous galaxy population.
-
2.
We explore the optical–near-infrared and near-infrared colors of these galaxies and show that they span a large range as a function of apparent magnitude or redshift. We attribute this to a wide variation in obscuration and structure within these systems. We demonstrate that signatures of dust are discernable in both the high resolution imaging from HST of these galaxies and their broad-band photometry. The complex obscuration suggested by our observations may be a direct result of outflows and winds driving channels surrounding dust, providing a natural explanation of the apparent ease of escape of Ly photons from these dusty galaxies (Chapman et al. 2004a).
-
3.
We show that typical SMG/OFRG are physically larger than optically-selected galaxies at similar redshifts drawn from magnitude-limited samples. We interpret this as primarily due to the multi-component nature of the SMG/OFRG, which in turn reflects the central role of tidal interactions and mergers in triggering the obscured, luminous activity which is used to select the galaxies in our sample. This is confirmed by the clear merger/interacting morphologies shown by a large fraction of galaxies in our sample within the GOODS HDF-N field, which were serendipitously imaged by Hubble Space Telescope.
-
4.
We construct a near-infrared Hubble diagram for our large, homogeneous sample. This shows that the -band luminosities of SMG/OFRGs are typically 1 magnitude fainter than similarly distant high-redshift, luminous radio galaxies, and show a larger scatter than radio galaxy samples (Serjeant et al. 2003). We do not find any statistically-compelling evidence that the most bolometrically-luminous SMG/OFRGs (those with ) exhibit a smaller dispersion in their -band magnitudes than the less luminous systems (c.f. Serjeant et al. 2003). This is unsurprising given the multi-component nature of many of these galaxies and the wide range in their restframe optical obscuration (Serjeant et al. 2003).
-
5.
The optical-near-infrared colors and near-infrared photometry of SMG/OFRG shows that they are both brighter and redder than either UV-selected, star-forming galaxies at or . We attribute these differences to larger stellar masses and higher obscuration in the SMG/OFRG population, resulting from their more massive progenitors and more active star formation. Simple photometric modeling appears to confirm that the restframe SEDs of the SMG/OFRG indicate continuum reddening at least twice that of the LBG population and their stellar luminosities may be 5 times larger.
-
6.
We also compare the restframe optical properties of these very luminous far-infrared galaxies, with similar galaxies in the local Universe. We find that these high redshift galaxies extend the trend for lower optical/far-infrared flux ratios at higher luminosities seen by previous workers – suggesting that an increasing fraction of the activity in these systems is almost completely obscured by dust. The enhancement seen in the far-infrared luminosities of the distant population is also shown by their larger gas masses and higher gas fractions, suggesting a constant star formation efficiency in the most vigorous starbursts out to .
-
7.
Finally, we show that if we take the star formation properties of a typical SMG/OFRG from our crude modeling of their restframe UV/optical SEDs and let them passively evolve from , they provide a good fit for the bright-end of the luminosity function of morphologically-selected spheroidal galaxies in rich clusters at . This provides additional support for the claims that SMG/OFRG represent a highly obscured and very active phase in the early evolution of massive, elliptical galaxies.
References
- (1) Baugh, C.M., Lacey, C.G., Frenk, C.S., Granato, G.L., Silva, L., Bressan, A., Benson, A.J., Cole, S., 2004, MNRAS, submitted.
- (2) Bergstrom, S, Wiklind, T., 2004, A&A, 414, 95
- (3) Bertoldi, F., Carilli, C.L., Menten, K.M., Owen, F., Dey, A., Gueth, F., Graham, J.R., Kreysa, E., et al., 2000, A&A, 360, 92
- (4) Blain, A.W., Chapman, S.C., Smail, I., Ivison, R.J., 2004a, ApJ, in press
- (5) Blain, A.W., Chapman, S.C., Smail, I., Ivison, R.J., 2004b, ApJ, in press
- (6) Bolzonella, M., Miralles, J.-M., Pello, R., 2000, A&A, 363, 476
- (7) Borys, C., et al., 2004, MNRAS, submitted
- (8) Boyle, B.J., Shanks, T., Croom, S.M., Smith R.J., Miller, L., Loaring, N., Heymans, C., 2000, MNRAS, 317, 1014
- (9) Bundy, K., et al., 2004, in prep
- (10) Capak, P., Cowie, L.L., Hu, E.M., Barger, A.J., Dickinson, M., Fernandez, E., Giavalisco, M., Komiyama, Y., et al., 2003, AJ, 127, 180
- (11) Chapman, S.C., Scott, D., Steidel, C.C., Borys, C., Halpern, M., Morris, S.L., Adelberger, K.L., Dickinson, M., et al., 2000, MNRAS, 319, 318
- (12) Chapman, S.C., Blain, A.W., Ivison, R.J., Smail, I., 2003a, Nature, 422, 695
- (13) Chapman, S.C., Windhorst, R., Odewahn, S., Yan, H., Conselice, C., 2003b, ApJ, 599, 92
- (14) Chapman, S.C., Blain, A.W., Smail, I., Ivison, R.J., 2004a, ApJ, submitted
- (15) Chapman, S.C., Smail, I., Blain, A.W., Ivison, R.J., 2004b, ApJ, in press
- (16) Charmandaris, V., et al., 2004, ApJS, in press
- (17) Clements, D.L., Eales, S.A., Wojciechowski, K., Webb, T., Lilly, S.J., Dunne, L., Ivison, R.J., McCracken, H., et al., 2004, MNRAS, in press
- (18) Cimatti, A., et al., 2002, A&A, 381, L68
- (19) Cimatti, A., et al., 2004, Nature, in press
- (20) Cole, S.C., Norberg, P., Baugh, C.M., Frenk, C.S., Bland-Hawthorn, J., Bridges, T., Cannon, R., Colless, M., et al., 2001, MNRAS, 326, 255
- (21) Croom, S.M., Boyle, B.J., Loaring, N.S., Miller, L., Outram, P.J., Shanks, T., Smith, R.J., 2002, MNRAS, 335, 459
- (22) Daddi, E., Rottgering, H.J.A., Labbe, I., Rudnick, G., Franx, M., Moorwood, A.F.M., Rix, H.W., van der Werf, P.P., van Dokkum, P.G., 2003, 588, 50
- (23) Daddi, E., Cimatti, A., Renzini, A., Vernet, J., Conselice, C., Pozzetti, L., Mignoli, M., Tozzi, P., et al., 2004, 600, L127
- (24) Dannerbauer, H., Lehnert, M.D., Lutz, D., Tacconi, L., Bertoldi, F., Carilli, C., Genzel, R., Menten, K.M., 2004, A&A, submitted
- (25) Dressler, A., Oemler, A., Couch, W.J., Smail, I., Ellis, R.S., Barger, A., Butcher, H., Poggianti, B.M., Sharples, R.M., 1997, ApJ, 490, 577
- (26) Egami, E., et al., 2004, ApJS, in press
- (27) Eikenberry et al., 2004, WIRC2 Manual, Palomar Observatory
- (28) Ellis, R.S., Smail, I., Dressler, A., Couch, W.J., Oemler, A., Butcher, H., Sharples, R.M., 1997, ApJ, 483, 582
- (29) Erb, D.K., Shapley, A.E., Steidel, C.C., Pettini, M., Adelberger, K.L., Hunt, M.P., Moorwood, A.F.M., Cuby, J., 2003, ApJ, 591, 101
- (30) Ferguson, H.C., Dickinson, M., Giavalisco, M., Kretchmer, C., Ravindranath, S., Idzi, R., Taylor, E., Conselice, C.J., et al., 2004, ApJ, 600, L107
- (31) Fioc, M., Rocca-Volmerange, B., 1997, A&A, 326, 950
- (32) Franx, M., Labbe, I., Rudnick, G., van Dokkum, P.G., Daddi, E., Forster Schreiber, N.M., Moorwood, A., Rix, H.W., et al., 2003, 587, L79
- (33) Frayer, D.T., Ivison, R.J., Scoville, N.Z., Yun, M., Evans, A.S., Smail, I., Blain, A.W., Kneib, J.-P., 1998, ApJL, 506, L7
- (34) Frayer, D.T., Ivison, R.J., Scoville, N.Z., Evans, A.S., Yun, M., Smail, I., Barger, A.J., Blain, A.W., Kneib, J.-P., 1999, ApJL, 514, L13
- (35) Frayer, D.T., Reddy, N.A, Armus, L., Blain, A.W., Scoville, N.Z., Smail, I., 2004, AJ, 127, 728
- (36) Frayer, D.T., et al., 2004, ApJS, in press
- (37) Gear, W.K., Lilly, S.J., Stevens, J.A., Clements, D.L., Webb, T.M.A., Eales, S.A., Dunne, L., 2000, MNRAS, 316, L51
- (38) Genzel, R., Baker, A.J., Tacconi, L.J., Lutz, D., Cox, P., Guilloteau, S., Omont, A., 2003, ApJ, 584, 633
- (39) Giavalisco, M., Ferguson, H.C., Koekemoer, A.M., Dickinson, M., Alexander, D.M., Bauer, F.E., Bergeron, J., Biagetti, C., 2004, ApJ, 600, L93
- (40) Greve, T., et al., 2004a, in prep
- (41) Greve, T., et al., 2004b, MNRAS, in press
- (42) Ivison, R.J., Greve, T.R., Smail, I., Dunlop, J.S., Roche, N.D., Scott, S.E., et al., 2002, MNRAS, 337, 1
- (43) Ivison, R.J., et al., 2004, ApJS, in press
- (44) Kim, D.-C., Veilleux, S., Sanders, D.B., 2002, ApJS, 143, 277
- (45) Kochanek, C., Pahre, M.A., Falco, E.E., Huchra, J.P., Mader, J., Jarrett, T.H., Chester, T., Cutri, R., Schneider, S.E., 2001, ApJ, 560, 566
- (46) Kodama, T., Yamada, T., Akiyama, M., Aoki, K., Doi, M., Furusawa, H., Fuse, T., Imanishi, M., et al., 2004, MNRAS, in press
- (47) Landolt, A.U., 1992, AJ, 104, 340
- (48) Leitherer, C., Schaerer, D., Goldader, J.D., Delgado, R.M.G., Robert, C., Kune, D.F., de Mello, D.F., Devost, D., Heckman, T.M., 1999, ApJS,
- (49) Lilly, S.J., et al., 1999, ApJ, 518, 614
- (50) de Lucia, G., Poggianti, B.M., Aragon-Salamanca, A., Clowe, D., Halliday, C., Jablonka, P., Milvang-Jensen, B., Pello, R., et al., 2004, ApJ, submitted
- (51) Lutz, D., Dunlop, J.S., Almaini, O., Andreani, P., Blain, A.W., Efstathiou, A., Fox, M., Genzel, R., et al., 2001, A&A, 378, L70
- (52) Mihos, J.C., Hernquist, L., 1996, ApJ, 464, 641
- (53) Neri, R., Genzel, R., Ivison, R.J., Bertoldi, F., Blain, A.W., Chapman, S.C., Cox, P., Greve, T.R., Omont, A., Frayer, D.T., 2003, ApJ, 597, L113
- (54) Page, M.J., Stevens, J.A., Ivison, R.J., Carrera, F.J., 2004, ApJ, submitted
- (55) Pentericci, L., et al., 2001, ApJS, 135, 63
- (56) Pozzetti, L., Mannucci, F., 2000, MNRAS, 317, L17
- (57) Sanders, D.B., Soifer, B.T., Elias, J.H., Neugebauer, G., Matthews, K., 1988, ApJ, 328, L35
- (58) Scannapieco, E., Thacker, R.J., 2003, ApJ, 590, L69
- (59) Scoville, N.Z., et al., 2000, AJ, 119, 991
- (60) Serjeant, S., Farrah, D., Geach, J., Takagi, T., Verma, A., Kaviani, A., Fox, M., 2003, MNRAS, 346, L51
- (61) Serjeant, S., Takagi, T., 2004, Nature, submitted
- (62) Serjeant, S., et al., 2004, ApJS, in press
- (63) Shapley, A.E., Steidel, C.C., Adelberger, K.L., Dickinson, M., Giavalisco, M., Pettini, M., 2001, ApJ, 562, 95
- (64) Smail, I., Ivison, R.J., Blain, A.W., Kneib, J.-P., 1998, ApJL, 507, L21
- (65) Smail, I., Ivison, R.J., Kneib, J.-P., Cowie, L.L., Blain, A.W., Barger, A.J., Owen, F.N., Morrison, G.E., 1999a, MNRAS, 308, 1061
- (66) Smail, I., Morrison, G., Gray, M.E., Owen, F.N., Ivison, R.J., Kneib, J.-P., Ellis, R.S., 1999b, ApJ, 525, 609
- (67) Smail, I., Owen, F.N., Morrison, G.E., Keel, W.C., Ivison, R.J., Ledlow, M.J., 2002a, ApJ, 581, 844
- (68) Smail, I., Ivison, R.J., Blain, A.W., Kneib, J.-P., 2002b, MNRAS, 331, 495
- (69) Smail, I., Chapman, S.C., Ivison, R.J., Blain, A.W., Takata, T., Heckman, T.M., Dunlop, J.S., Sekiguchi, K., 2003a, MNRAS, 342, 1185
- (70) Smail, I., Scharf, C.A., Ivison, R.J., Stevens, J.A., Bower, R.G., Dunlop, J.S., 2003b, ApJ, 599, 86
- (71) Stanford, S.A., Stern, D., van Breugel, W., de Breuck, C., 2000, ApJS, 131, 185
- (72) Steidel, C.C., Shapley, A.E., Pettini, M., Adelberger, K.L., Erb, D.K., Reddy, N.A., Hunt, M.P., 2004, ApJ, 604, 534
- (73) Stevens, J.A., Page, M.J., Ivison, R.J., Mittaz, J.P.D., Carrera, F.J., Smail, I., McHardy, I.M., 2004, MNRAS, submitted
- (74) Swinbank, A.M., et al., 2004, ApJ, submitted
- (75) Tinney, C., et al., 2004, IRIS2 manual, AAO.
- (76) Trentham, N., Kormendy, J., Sanders, D.B., 1999, 117, 2152
- (77) Veilleux, S., Kim, D.-C., Sanders, D.B., Mazzarella, J.M., Soifer, B.T., 1995, ApJS, 98, 171
- (78) Webb, T.M.A., Eales, S.A., Lilly, S.J., Clements, D.L., Dunne, L. Gear, W.K., Ivison, R.J., Flores, H., Yun, M., 2003, ApJ, 587, 41
- (79) Webb, T.M.A., Brodwin, M., Eales, S.A., Lilly, S.J., 2004, ApJ, in press
- (80) Martini, P., Weinberg, D.H., 2001, ApJ, 547, 12
- (81) Willott, C., Rawlings, S., Jarvis, M.J., Blundell, K.M., 2003, MNRAS, 339, 173
- (82) Yagi, M., 1998, PhD Thesis, University of Tokyo
Table 1
Photometry of SMGs and OFRGs
ID Comment SMM J030252.50+000856.4 0.176 16.150.01 17.580.02 20.800.03 CFRS03.10 SMM J030236.15+000817.1 2.435 20.9 21.3 23.7 CFRS03.6 SMM J030227.73+000653.5 1.407 19.140.03 19.660.04 21.290.05 CFRS03.15 SMM J030231.81+001031.3 1.316 20.9 … 23.7 CFRS03.17 SMM J030238.62+001106.3 0.276 20.520.17 … 23.140.17 CFRS03.25 SMM J105238.30+572435.8 3.036 20.320.24 … 23.260.16 LH 850.2 SMM J105158.02+571800.3 2.239 18.860.09 … 23.240.15 LH 850.3 SMM J105230.73+572209.5∗ 2.611 19.220.16 … 22.710.07 LH 850.6 SMM J105200.26+572421.7∗ 0.689 18.820.09 … 21.590.03 LH 850.8 SMM J105207.49+571904.0∗ 2.694 20.6 … 22.660.08 LH 850.12 … … … … … … … … … … … …
) Photometry may be contaminated by near neighbor.