A Redshift Survey of the Submillimeter Galaxy Population
Abstract
We have obtained spectroscopic redshifts using the Keck-I telescope for a sample of 73 submillimeter (submm) galaxies, with a median 850m flux density of 5.7 mJy, for which precise positions are available through their faint radio emission. The galaxies lie at redshifts out to , with a median redshift of 2.2 and an interquartile range –2.8. Modeling a purely submm flux-limited sample, based on the expected selection function for our radio-identified sample, suggests a median redshift of 2.3 with a redshift distribution remarkably similar to the optically- and radio-selected Quasars. The observed redshift distributions are similar for the AGN and starburst sub-samples. The median =24.6 for the sample. However, the dust-corrected ultraviolet (UV) luminosities of the galaxies rarely hint at their huge bolometric luminosities indicated by their radio/submm emission, underestimating the true luminosity by a median factor of for SMGs with pure starburst spectra. Radio and submm observations are thus essential to select the most luminous, high-redshift galaxies. The 850m, radio, and redshift data is used to estimate the dust temperatures, and characterize photometric redshifts. Using 450m measurements for a subset of our sample we confirm that the median dust temperature of =367 K, derived assuming the local FIR–radio correlation applies at high redshift, is reasonable. Individual 450m detections are consistent with the local radio-FarIR relation holding at . This median is lower than that estimated for similarly luminous IRAS 60m galaxies locally. We demonstrate that dust temperature variations make it impossible to estimate redshifts for individual submm galaxies using simple long-wavelength photometric methods to better than . We calculate total infrared and bolometric luminosities (the median infrared luminosity estimated from the radio is L⊙), construct a luminosity function, and quantify the strong evolution of the submm population across –3.5, relative to local IRAS galaxies. We use the bolometric luminosities and UV-spectral classifications to determine a lower limit to the active galactic nucleus (AGN) content of the population, and measure directly the varying contribution of highly-obscured, luminous galaxies to the luminosity density history of the Universe for the first time. We conclude that bright submm galaxies contribute a comparable star formation density to Lyman-break galaxies at and including galaxies below our submm flux limit this population may be the dominant site of massive star formation at this epoch. The rapid evolution of submm galaxies and QSO populations contrasts with that seen in bolometrically lower luminosity galaxy samples selected in the restframe UV, and suggests a close link between submm galaxies and the formation and evolution of the galactic halos which host QSOs.
Subject headings:
cosmology: observations — galaxies: evolution — galaxies: formation — galaxies: starburst1. Introduction
The submillimeter (submm) galaxy population was first detected seven years ago with the Submillimetre Common User Bolometer Array (SCUBA – Holland et al. 1999) on the JCMT (Smail, Ivison & Blain 1997; Hughes et al. 1998; Barger et al. 1998; Eales et al. 1999). Their discovery motivated a variety of surveys using both SCUBA and a similar instrument, MAMBO (Bertoldi et al. 2000; Kreysa et al. 2002), on the IRAM 30-m telescope. Several surveys were undertaken of blank fields, using different strategies to determine their depths and area coverage (Barger et al. 1999a, 2002; Eales et al. 2000; Scott et al. 2002; Borys et al. 2003; Serjeant et al. 2003; Webb et al. 2003a; Dannerbauer et al. 2004; Greve et al. 2004). These surveys detect sources at a rate of approximately one source per night. A second class of survey utilized massive clusters to provide a mild gravitational lensing boost to aid in the detection and study of SMGs. These surveys uncovered sources at a rate of about two per night, and examples of such surveys include Smail et al. (2002), Chapman et al. (2002a), Cowie, Barger & Kneib (2002), and Knudsen (2004).
These surveys have gradually built up a large enough sample of Sub-Millimeter Galaxies (SMGs) to produce a statistically useful count (e.g., Blain et al. 2002). However, until very recently most of our detailed knowledge of the properties of SMGs came from a handful of SMGs identified in lensing cluster fields (e.g., Ivison et al. 1998, 2000, 2001; Frayer et al. 1998, 1999, 2004), as follow-up of blank field sources without the lensing boost required significantly more resources (e.g., Gear et al. 2000; Lutz et al. 2001; Dannerbauer et al. 2002; Dunlop et al. 2004).
A breakthrough in our understanding of the properties of SMGs came from exploiting ultradeep 20-cm radio maps. A strong correlation exists between the far-infrared (FIR) and radio flux densities of galaxies, both locally and at high redshifts (e.g., Helou et al. 1985; Condon 1992; Garrett 2002), and so deep radio imagery with the Very Large Array (VLA)111The National Radio Astronomy Observatory is a facility of the National Science Foundation operated under cooperative agreement by Associated Universities, Inc. can be used to help pinpoint and study SMGs (Ivison et al. 1998; Smail et al. 2000; Barger, Cowie & Richards 2000; Chapman et al. 2001, 2002b). These radio maps provide a ″ beam and ″ astrometric precision relative to the optical frame, sufficient to accurately locate the counterpart of a submm source. The use of radio imaging has culminated in the successful identification of at least % of SMGs brighter than S mJy and their photometric characterization in the optical/near-infrared waveband (Ivison et al. 2002; Chapman et al. 2003a; Wang et al. 2004; Borys et al. 2004; Greve et al. 2004).
The ability to precisely locate the position of a submm emitting source is essential if we wish to study their properties in any detail. In particular, this is a necessary first step when trying to derive redshifts and luminosities for these systems. It had been hoped that long-wavelength observations of the dust emission spectrum of these galaxies might be prove a reliable route to derive their redshifts and luminosities. The submm/radio flux ratio was first used by Carilli & Yun (1999) in this manner to estimate the typical redshift of SMGs, however the technique was recognized immediately to have limited accuracy (% redshift errors) if there was a range of dust temperatures () present. This uncertainty is particularly important when deriving luminosities and related properties from submm observations as the submm flux density is for a fixed FIR luminosity at . In addition, there is a strong degeneracy between and (Blain 1999), which limits the usefulness of simple photometric redshifts for estimating luminosities for the SMG population. Refinement of the modeling and fitting techniques appears not to have overcome this basic source of uncertainty (e.g., Aretxaga et al. 2003; Wiklind 2003). Indeed, even surveys at several submm wavelengths (e.g., Hughes et al. 2002) cannot completely overcome the degeneracy between dust temperature and redshift (Blain 1999; Blain, Barnard & Chapman 2003 – see also Aretxaga et al. 2004 for a contrary view).
As a consequence, precise redshifts are crucial for interpreting almost every aspect of SMGs. Prior to 2002, only a handful of spectroscopic redshifts were available for unambiguously-identified SMGs (Ivison et al. 1998, 2000; Barger et al. 1999b; Lilly et al. 1999). Recent attempts to measure redshifts for SMGs have met with more success (Chapman et al. 2002c, 2003a; Barger et al. 2002; Ledlow et al. 2002; Smail et al. 2003a, 2003b; Kneib et al. 2004). However, the resulting sample is still restricted in size and unrepresentative of the general properties of the SMG population (with a bias towards optically-bright counterparts and a preponderance of strong-lined AGN). A redshift survey of a large and representative sample of submm galaxies is therefore urgently required.
Chapman et al. (2003b – hereafter C03) demonstrated that spectroscopic redshifts can be obtained for even the optically faintest SMGs, spanning a factor of in -band flux, allowing a much more representative sample of the population to be studied. Their approach involved constructing densely-packed distributions of submm galaxies across fields (matched to the area coverage of multi-object spectrographs on 10-m telescopes) with precise positions from radio counterparts. These samples could then be efficiently and effectively targeted using deep spectroscopy in the UV/blue spectral region. With a large, unbiased sample of SMGs constructed in this manner it is possible to address questions about the SMG population with more certainty: including their dust temperatures (Td) and SED properties, their luminosities at various wavelengths and luminosity evolution, their contribution to the FIR background, and their relation to other populations of galaxies and AGN at high redshift.
In this paper, we present an expanded sample from the ten SMGs with robust spectroscopic redshifts described by C03, to provide a total sample of 73 redshifts for unambiguously-identified SMG’s. We discuss the properties and observations of this sample, along with selection effects in §2. We present the basic observational results obtained for this sample, including the redshift distributions, variation in SEDs with redshift as characterized by the submm/radio flux ratio, and optical properties in §3. In §4 we then use basic assumptions to derive dust temperatures and bolometric luminosities for our sample, compare the UV properties of the galaxies with their radio/submm emission, assess their contribution to the luminosity and star formation histories of the Universe and the FIR background (FIRB) and discuss their evolutionary connections with other high-redshift populations. Finally, in §5 we give our main conclusions. All calculations assume a flat, CDM cosmology with and km s-1 Mpc-1.
2. Sample Definition, Observations and Analysis
The parent sample of SMG’s used for our survey consists of 150 sources detected at 850m () with SCUBA/JCMT, lying in seven separate fields (field centers listed in Table 1): CFRS03, Lockman Hole, HDF, SSA13, Westphal-14, ELAIS-N2, and SSA22. 104 of these SMGs have radio identifications from deep VLA radio maps at 1.4 GHz. This radio-identified subset are the focus of this paper.
In all fields the SCUBA submm data was retrieved from the JCMT archive222The JCMT is operated by the Joint Astronomy Centre on behalf of the United Kingdom Particle Physics and Astronomy Research Council, the Netherlands Organisation for Scientific Research, and the National Research Council of Canada. The JCMT archive is provided through the Canadian Data Archive Center. and reduced in a consistent manner using the SURF reduction tools (Jenness et al. 1998) and our own software to extract beam-weighted submm fluxes.333Map fluxes are obtained by extracting the effective beam imprint, SCUBA chopping/nodding profile (e.g., Scott et al. 2002; Borys et al. 2003). In some cases, additional radio sources were targeted in SCUBA’s photometry mode (Holland et al. 1999) to efficiently construct large samples of SMGs to target in contiguous regions around fields mapped by SCUBA (e.g., Chapman et al. 2001a, 2002b, 2003a). In addition, follow-up SCUBA photometry was used to verify the reality and submm flux densities of 11 of the sources detected in SCUBA maps. These new SCUBA observations were obtained during JCMT observing runs in 2002 and 2003, with sky opacity at 225 GHz, –0.09. The observing strategy was to integrate for a fixed length of time (1.0 hrs) on all targeted galaxies, with additional time allocated to targets which did not achieve our nominal RMS sensitivity goal of dS850=1.5 mJy due to weather conditions. We note the observational mode used to identify sources in Table 3, based on whether their submm detection was obtained entirely in photometry mode (), entirely in mapping mode () or through a combination of the two modes ().
Radio data for these fields either existed from previous work by members of our group (Lockman Hole, ELAIS-N2), was rereduced for the purpose of this study (CFRS-03, SSA22, Westphal-14), or obtained from the public release (HDF, Richards 2000). The SSA13 radio data were obtained from E.A. Richards (private communication), and is so far unpublished (a subsequent reduction of the SSA13 data is described in Fomalont et al. 2004). The radio data for the Lockman Hole and ELAIS-N2 fields come from Ivison et al. (2002) who identified counterparts to the submm galaxies in these regions from Scott et al. (2002). For those fields which we rereduced the radio data was retrieved from the VLA archive when available and combined with new data obtained by our group in SSA22 (36 hrs, A-array), Westphal-14 (24 hrs, B-array), and CFRS-03 (16 hrs, B-array). The radio maps were reduced in an identical manner to those described in Ivison et al. (2002). The resulting radio maps have depths range from 4Jy to 15Jy rms; see Table 1.
Deep optical imaging in the , , and passbands is available for all of our fields. This consists of several hour integrations with mosaic CCD cameras on 4-m and 8-m class telescopes, taken either from public archives, or obtained by our group during observing runs throughout 2000–2002. HDF (), SSA13 (), and Lockman () imaging was obtained with the SUPRIME camera on the Subaru telescope. The HDF data was retrieved from the public release presented in Capak et al. (2004). The SSA13 and Lockman data was retrieved from the Subaru archive and reduce by our group. The imaging in SSA13 was obtained with the Kitt Peak 4m telescope and the MOSAIC camera, and reduced with the MSCRED tasks in IRAF. The imaging in Lockman and the ELAIS-N2 imaging () was obtained with the wide-field camera on the William Herschel Telescope (WHT) and reduced in a standard manner using IRAF. imaging in SSA22 and Westphal-14 was obtained from the public release in Steidel et al. (2003), and the details are described therein. Additional SSA22 imaging was obtained with the LFC instrument () on the Palomar 5m telescope and the CFHT-12k mosaic camera (), and was reduced with MSCRED in IRAF. References to all these instruments are listed in Table 1. Near-infrared imaging is also available for the majority of submm sources in our fields from a number of different instruments and telescopes, typically reaching at least and . Details of the optical, radio, and submm data in each field is given in Table 1. The near-IR properties of our SMGs are discussed fully in Smail et al. (2004a).
SMGs with radio identifications allow the position of the rest-frame FIR emission to be unambiguously identified with a position in the optical imaging to within the relative astrometric alignment of the radio/optical frames. Optical images were distortion corrected, and tied to the same astrometric grid as the radio data using large numbers of optically-bright radio sources across the field, resulting in an rms positional uncertainty of typically 0.5″ (see the detailed discussions in Richards 2000; Ivison et al. 2002). The -magnitudes (subsequently called ) in 2″ apertures of the targets range from to (Fig. 1).
Targets were selected for spectroscopic followup from the seven fields, chosen at random and prioritized equally, without preference for optical brightness. Observations of two sources were obtained with ESI echelle spectrograph on the Keck-II telescope on the night of 2001 July 16 and have been previously discussed by Chapman et al. (2002c). Over the course of seven observing runs between 2002 March and 2004 February we observed 98 of the 104 sources in our radio-SMG sample with the Low Resolution Imaging Spectrograph (LRIS, Oke et al. 1995) spectrograph on the Keck-I telescope444The data presented herein were obtained at the W.M. Keck Observatory, which is operated as a scientific partnership among the California Institute of Technology, the University of California and the National Aeronautics and Space Administration. The Observatory was made possible by the generous financial support of the W.M. Keck Foundation., obtaining reliable redshifts for a total of 73 galaxies. The first ten spectroscopic identifications from our program were presented in C03.

The details of the spectroscopic configurations for our observing runs and their success rates are presented in Table 2. Observations taken with LRIS using several different settings of gratings and cameras. Data taken before 2002 March was obtained before the commissioning of the large mosaic CCD blue camera, and used a smaller format blue device. All subsequent data was taken with the larger format (4k4k) blue camera (Steidel et al. 2004). Our observations use either the 5600Å [D560] or 6800Å [D680] dichroic to divide the light between the red and blue cameras. The 400 l/mm [B400] grism was always used in the blue arm to provide wavelength coverage from the atmospheric limit out to the dichroic wavelength for most of the slitlets on the masks. This grism provides reasonable resolution (–6Å) with our adopted 1.2–1.4″ slitwidths. Either the 400 l/mm [R400] or 600 l/mm [R600] gratings were used in the red arm, dependent on the dichroic selected. Spectral resolutions of –8Å are achieved in the red.
Integration times were between 1.5–6.0 hrs in dark or gray conditions, split into 30-min exposures. Conditions varied from photometric to light cirrus, and seeing ranged between 0.7″ and 1.1″. Data reduction followed standard multi-slit techniques using custom iraf scripts. The spectra typically probe an observed wavelength range of 3100–8000Å.
2.1. Spectroscopic Identifications
To obtain redshifts from our spectroscopic observations, one-dimensional spectra were compared with template spectra and emission line catalogs. Of the 98 radio-SMGs observed, redshifts were obtained with confidence for 73 galaxies, for a total spectroscopic completeness of %. The distribution of the optical, radio, and submm fluxes of the parent and spectroscopically identified sample are shown in Fig. 1. Representative spectra are shown in Fig. 3. Table 1 lists the number of radio-SMGs observed with LRIS in each field, and the number of successful redshift measurements. Field to field variations reflect weather quality, as well as intrinsic source properties (e.g., Ly line strength).
Twelve SMGs from our sample have previously published redshifts from other groups: SMM J141741.90+522823.6, SMM J141742.20+523026.0 by Eales et al. (2000); SMM J030244.56+000632.3 by Webb et al. (2003); SMM J123629.13+621045.8, SMM J123632.61+620800.1, SMM J123634.51+621241.0, SMM J123635.59+621424.1, SMM J123607.53+621550.4, SMM J123721.87+621035.3, SMM J131201.17+424208.1, SMM J131215.27+423900.9, SMM J131225.20+424344.5 by Barger et al. (2001a, 2001b, 2003).555Note that not all these sources were measured as SMGs, but were listed with spectroscopic redshifts in catalogs of radio or X-ray sources. The mags of these sources are amongst the brightest in our sample, with an average . All these redshifts from the literature are in agreement with our measurements within errors.
Three further sources were tentatively identified by Simpson et al. (2004) using the Subaru-OHS spectrograph. SMM J163658.19+410523.8 agrees with our redshift as noted in Simpson et al. (2004). However, SMM J105158.02+571800.3 and SMM J141809.00+522803.8 disagree with our measured redshifts by d=0.20 and d=0.16 respectively. Our redshift for SMM J105158.02+571800.3 () is derived from two UV-absorption features and the detection of H (Swinbank et al. 2004), and we regard our redshift as a more robust identification. Our redshift for SMM J141809.00+522803.8 is derived primarily from strong Ly in emission, but lies at a redshift () that makes it difficult to followup in nebular lines using near-IR spectrographs, casting some doubt on the reality of the Simpson et al. redshift (Simpson et al. 2004 in fact suggest that their redshift is likely to be spurious based on the weakness of the features and the residuals present from sky-line subtraction).
The primary criteria for considering a redshift as robust is the identification of multiple emission/absorption lines. Our redshift identifications are confirmed by the detection of other lines and continuum features in 75% (55) of the identified spectra: AGN lines (Civ1549, Siv1397, Nv1240), as well as weaker stellar and interstellar features, and continuum breaks. We also consider redshifts to be robust if we detected a large equivalent width line (Å), and there is supporting evidence that this line is Ly. Only one quarter (18) of the 73 spectroscopic redshifts are single-line identifications. There are three items of supporting evidence which are used to support the single-line Ly identifications: the identification of a continuum break (if the continuum is detected) across the proposed Ly line from the red to the blue (3/18), the absence of emission lines which do not match the proposed Ly-derived redshift (all 18), and an asymmetrical line profile, with the blue-wing truncated, typical of Ly emission from high-redshift galaxies (8/18). In very few cases were identifications ambiguous using these criteria.
While single line Ly identifications may not be convincing to some readers, several arguments support our interpretation. For many of the single emission line detections, the observed wavelength lies below 4000Å(sometimes below 3700Å), precluding a reasonable identification as [Oii] 3727 at given the optical faintness and submm/radio detection.
We also have two independent tests of the reliability of our redshifts. Firstly, we have obtained Keck/NIRSPEC and VLT/ISAAC near-IR spectroscopic observations for a significant fraction of our sample to probe the nebular line emission to measure the star formation rates, estimate metallicities and study kinematics. These observations have successfully detected restframe H (and frequently [Nii]) emission in 26 cases (Swinbank et al. 2004), confirming the UV-based redshifts in the present paper. Ten of the 18 single-line identifications have been confirmed in H. The near-IR H spectra were also able to break degeneracies in 5 cases where spectral identifications based only on UV-absorption lines were consistent with two similar redshifts. These H/[Nii] results were also used to aid in the spectroscopic classification of our sample, as indicated in Table 3.
Secondly, 15 of our SMG redshifts have been confirmed with CO line emission using the IRAM Plateau de Bure Interferometer (Neri et al. 2003; Greve et al. 2005), including 2 single-line identifications. These detections not only confirm the precision of the UV-based redshifts for the counterparts we targeted, but equally importantly they also confirm that these galaxies are gas-rich systems suitable to be the source of the luminous far-infrared emission detected in the submm waveband.
The strength of the Ly lines for the SMGs vary tremendously in both line flux (Lν from 1–60Jy) and restframe equivalent width, which ranges from 3Å (absorption) to Å (we note that we see no obvious variation in the radio/submm properties of SMGs as a function of Ly line strength). With the generally faint rest-frame UV continua exhibited by our SMG (65% are fainter than ), there is a bias in our sample against obtaining redshifts for the weaker emission line sources at the faintest continuum fluxes. This is reflected in Fig. 1, where the increased failure rate for obtaining spectroscopic redshifts is apparent for . This bias is highlighted by the fact that sources with identifiable Ly absorption only appear in our sample for SMGs with . We discuss the spectral properties and incompleteness of our sample in more detail in §3.4.
3. Results

3.1. Sample properties and submm-radio selection effects
To understand the characteristics of the submm population we first have to quantify how the selection criteria for our sample (e.g., radio, submm and optical flux limits, spectroscopic incompleteness) may have influenced the observed properties.
Fig. 1 shows our spectroscopic completeness as a function of -band magnitude, 1.4-GHz radio flux and 850 m submm flux. The median properties of the parent sample are , Jy and mJy, while the spectroscopically-identified population has , Jy and mJy, As expected, our spectroscopic sample is biased towards the optically brighter galaxies (the median -band magnitude for the unidentified spectroscopic targets is ), but there is no discernable difference in the submm or radio distributions (which are effectively decoupled from the restframe UV emission). This suggests that the long-wavelength properties of our spectroscopic sample are likely to be representative of the more general submm population.
A crucial feature of the present study is that by analyzing only the radio-identified SMG we are considering only part of the total SMG population. We must therefore determine the influence of the resulting selection function before drawing wider conclusions about flux-limited submm samples.
About 65% of the bright ( mJy) SMG population are detectable in the deepest radio maps obtainable with the VLA (Ivison et al. 2002; Chapman et al. 2003a; Wang et al. 2004; Borys et al. 2004). Greve et al. (2004) and Ivison et al. (2005), have recently suggested that the fraction of bright SMGs, robustly confirmed at both 850m and 1200m, which are detected in the radio may be even higher – 80%. The remaining % of SMGs not detected in our radio maps (and therefore not included in the distributions of Fig. 1) could in principle have a wide range of properties and redshifts.
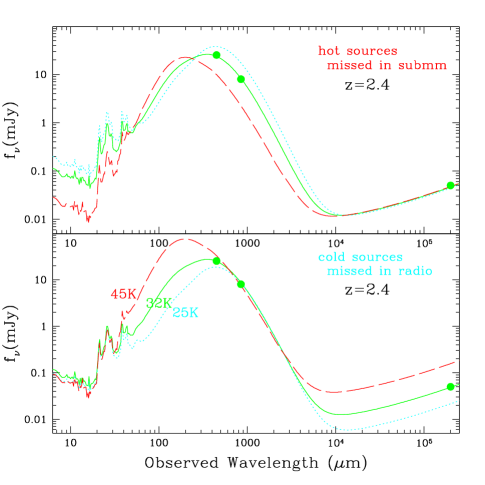
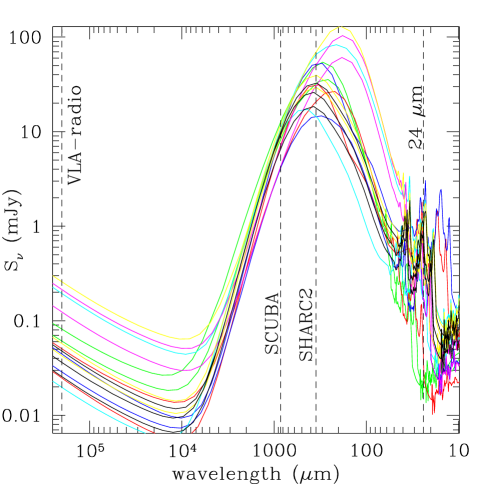
We can elucidate the effects of our radio pre-selection further by considering the spectral energy distributions (SEDs) of SMGs in more detail. A range of possible SEDs for a canonical 6 mJy radio-SMG at with a 50-Jy radio counterpart is shown in Fig. 2.1. The upper panel shows SEDs (Dale & Helou 2002) spanning a range of dust temperatures, all with the same radio flux, and therefore comparable FIR luminosities. The range in dust temperatures depicted is less than a factor two, but results in close to a factor ten range in submm flux (see Blain et al. 2002, 2004a for additional details of this selection effect). As a consequence the hottest SED (with the lowest implied dust mass) shown in Fig. 2.1 (with a characteristic temperature of 45 K) falls below the SCUBA detection threshold in our sample of 3 mJy.
This trend becomes more dramatic at lower redshifts: by shifting the SED templates to shorter wavelengths, it becomes apparent that only the coolest sources can be detected above our 3 mJy submm flux limit. By contrast, the selection bias vanishes at higher redshifts; increasingly hotter sources become detectable with SCUBA above our radio limit ( Jy in the typical field).
However, our requirement of a radio detection to pinpoint the spectroscopic counterpart of the submm source means that the opposite selection bias comes into play in our sample (Fig. 2.1 lower panel); the coldest SMG’s at lie below our radio flux limit. This bias become an increasing concern at higher redshifts where warmer SMG’s fall beneath our radio limit. We will quantify the influence of our radio selection using knowledge of the range of observed SMG SED properties in §4.1.
The observed redshift distribution in Fig. 3.3 illustrates succinctly how the radio-undetected SMGs may relate to our radio-SMG sample in this context: we expect to miss sources lying between the submm and radio model curves due to our requirement of a radio detection to pinpoint the host galaxies. The radio-undetected minority of the submm population is likely to overlap significantly in redshift with our present radio-SMG sample. These galaxies would have characteristic dust temperatures that are typically cooler than the radio-detected galaxies at their redshifts (via the (1+)– degeneracy). Fig. 3.3 shows that the two populations begin to overlap significantly at . A well-studied example of a radio-undetected SMG in this redshift range is the extremely red SMM J04431+0210 identified by Smail et al. (1999), the redshift of this galaxy was measured as by Frayer et al. (2003) and confirmed beyond doubt as the submm source through the detection of molecular gas in the CO(3–2) line by Neri et al. (2003).
3.2. Ambiguous Radio Counterparts to Submm Sources
There are a number of other issues associated with the identification process which need to be considered. In particular, we note that the radio positions of a handful of sources lie very near (″) to an obviously low-redshift galaxy. These galaxies are unlikely to be related to the submm-emitting source, once the complete range of the galaxy and submm source properties (radio luminosity and colors) are considered. Instead we believe that these low-redshift galaxies are in fact lensing the background submm sources. Detailed discussions of two of these systems can be found in Chapman et al. (2002c) and Dunlop et al. (2004). There are five such galaxies in our total sample and we have not include these in the catalog of 73 submm sources with robust redshifts as we believe that the foreground galaxies are not the correct identifications for the submm sources. In three of these cases there is evidence from near-infrared imaging of faint -band galaxies lying closer to the radio position than the galaxy which was spectroscopically observed. These submm sources are particularly difficult to study (or even target) optically, and may have to wait for blind CO lines searches at millimeter wavelengths to determine their redshifts. For completeness, we include these galaxies in our identification table, but flag them as probable lenses and do not include them in any of our subsequent analysis.
We note that there are examples of low redshift () galaxies where the radio emission is coincident with the spectroscopically-targeted counterpart (within the relative astrometric errors), and we consider these to be the correct identifications and include them in our sample and analysis. These galaxies have inferred dust temperatures which appear cold relative to similarly-luminous, local IRAS galaxies (Chapman et al. 2002d; Blain et al. 2004b).
In addition to the ambiguity in the small number of cases where radio sources lie close to bright, foreground galaxies, Ivison et al. (2002) have demonstrated that roughly 10% of radio-SMGs have more than one radio source within their submm error circle (8″ diameter, derived based on Monte Carlo simulations, and through comparison to the robust identifications of SMGs in Smail et al. 2002). Taking a well-studied example from the literature: SMM J 09431+4700 (Ledlow et al. 2002) represents a striking case of an SMG with two probable radio counterparts (denoted H6 and H7). Ledlow et al. (2002) obtained a spectroscopic identification of for the optically-brighter radio source, H6. Nevertheless, both radio sources were detected in 1 mm continuum from the IRAM PdB (Tacconi et al. 2005) – confirming that both contribute to the measured 850-m flux. A search for CO emission in the system at the redshift of H6 failed to detect any molecular emission from this galaxy, but did detect a massive gas reservoir in the optically fainter sources, H7, confirming that both galaxies lie at the same redshift (Neri et al. 2003).
We find eight examples of multiple radio counterparts to submm sources in our sample (noted in Table 3). In these cases we have taken spectra of all of the radio sources. In three cases (SMM J123621.27+621708.4, SMM J123616.15+621513.7, and SMM J163650.43+405734.5) we obtained a spectroscopic identification for one radio source but failed on the second. In three cases (SMM J105200.22+572420.2, SMM J123707.21+621408.1, and SMM J123711.98+621325.7) we confirmed that both radio sources lie at the same redshift to within 1000 km s-1. While in the final two cases (SMM J105238.26+571651.3 and SMM J105225.90+571906.8), we found one radio source at high-redshift , and the other at . In these latter two cases, we assume that the high-redshift source is the correct identification, since its significantly greater radio luminosity suggests a dominant contribution to the submm emission. However, detailed multi-wavelength follow-up may reveal that the low redshift radio source also contributes significantly to the submm luminosity.
Even when only a single radio counterpart exists, the optical identifications are not always unambiguous – with two optical counterparts within the radio error-circle, or 1″ offsets from the radio to optical identification. This affects only a small fraction of our sample (four SMGs or %). Again, we have attempted to obtain redshifts for all components, but the sample is not complete in this respect (two possible counterparts remain to be observed spectroscopically). For the 10% of cases where the optical identification is slightly offset from the radio (noted in Table 3), the optical source is sometimes extended and overlaps the radio source in lower surface brightness extensions. In these cases we are confident that we have identified the correct counterpart, although we have not necessarily characterized the source of the bolometric emission in the Keck spectrum. Chapman et al. (2004b) address some of these issues through higher spatial resolution radio and optical imagery, while Ivison et al. (2005) have examined the detailed identifications of SMGs in a robust sample within one of our survey fields. We have commented on individual objects which are subject to any of these identification issues in Table 3.
3.3. Redshift distributions
The redshift distribution of our submm galaxy sample (Fig. 3.3) displays a marked peak at –2.5, with an apparent dip in the distribution at that is almost certainly a result of our failure to efficiently identify redshifts for SMG’s at –1.8 where no strong spectral features fall into our observational windows. The decline in the numbers of SMGs at low redshifts is due to a combination of the submm selection function, and the intrinsic evolution in the population (e.g., Blain et al. 1999a). At high redshifts, our requirement of a radio detection (to locate the submm counterpart) limits the maximum redshift detectable at our radio survey depths: a radio flux limit of 30 Jy will yield detections of typical temperature and luminosity SMGs at .
We describe the selection effects using an evolutionary model which accounts for the dust properties of local galaxies with a range in template SEDs and that has been tuned to fit the submm/radio flux distribution (Chapman et al. 2003c; Lewis, Chapman & Helou 2004). The model takes the local FIR luminosity function and evolves it in luminosity with increasing redshift following the functional form given in Blain et al. (2002). The functional form of the pure luminosity evolution function in this model is given as . The values of and in this function which remain consistent with our observed redshift distribution (after filling in the redshift desert as described in this section, and assuming Poisson error bars on the N histogram) are and respectively. The range of parameters effectively shift the of the peak evolution function such that .
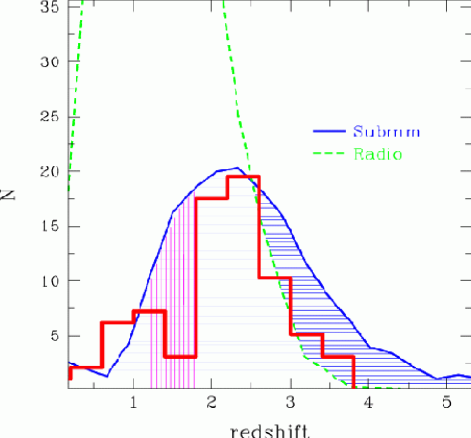
We plot the predicted redshift distributions for all submm galaxies with 5 mJy and all radio sources with 30Jy. We expect to miss sources lying between the submm and radio model curves due to our requirement of a radio detection to pinpoint the host galaxies. The galaxies in this region represent 35% of the integral under the submm curve (Fig. 4) in agreement with the proportion of radio-unidentified SMGs (e.g., Ivison et al. 2002; Chapman et al. 2003c). The combination of selection functions described by the model curves are clearly in good agreement with the observed redshift distribution.
Contrasting the predicted and observed redshift distributions we would estimate that the dip due to spectroscopic incompleteness at would effect around 20% of our parent sample – this is close to the 26% spectroscopic incompleteness estimated for the total sample in §3.3 – suggesting that most of this arises from the so-called redshift desert. The influence of the radio selection produces an increasing incompleteness compared to the original parent sample at . The model predicts that these missing galaxies will lie at somewhat higher redshifts than our radio-SMG sample, but still overlap significantly. Under this model scenario, less than 10% of SMG’s lie at where we have no identified members of the population in our survey. The observed radio-SMG N() (accounting for incompleteness in the spectroscopic desert) can be reasonably approximated by a Gaussian with a central redshift of and a sigma of 1.2, while the model submm-only N() is fit by a Gaussian with a central redshift of and a sigma of 1.3.
In §4.4 and 5, we will attempt to combine all the observational information on the SMG population to confirm the fraction of SMGs that could plausibly lie at very high redshifts. Nevertheless, we reiterate that our survey gives access to the majority (%) of the bright (6 mJy) SMG population and so allows us to derive representative properties for the bulk of this important population.
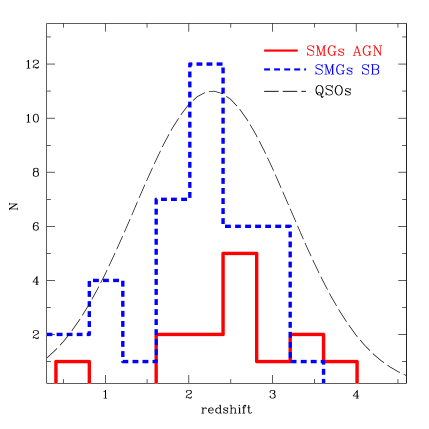
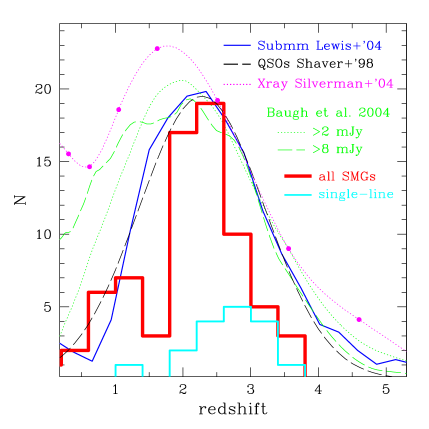
It is interesting to divide the SMG sample based upon their spectroscopic classifications. Quasars (Shaver et al. 1998; Boyle et al. 2000; Silverman et al. 2004) and LBGs (Steidel et al. 1999; Lehnert et al. 2003; Giavalisco et al. 2004) show very different evolution histories from –6. Similarly, Haarsma et al. (2000) and Cowie et al. (2004) have studied the evolution of lower redshift (–1) faint Jy radio sources, finding strong evolution and differing evolution for subsets of this population depending on whether their restframe optical/UV spectra show AGN or star-formation signatures. As Fig. 5a demonstrates, the redshift distribution of the SMGs does not depend strongly on the level of AGN activity apparent in their restframe-UV spectra. Moreover, the form of the redshift distribution for the radio-SMG population (Fig. 5b) is very similar to that seen for Quasars (Shaver et al. 1998; Silverman et al. 2004), selected either in the optical, X-ray or radio wavebands, and different from than that seen for UV-selected galaxies. We have placed the data from Silverman et al. (2004) on Fig. 5b by dividing each of their points by the appropriate comoving volume element in our adopted cosmology, and connecting the points with a spline fit. Only by adopting very contrived redshift distributions for the additional 35% of the SMG population which are not currently identified in the radio (Fig. 3.3), is it possible to make the SMGs redshift distribution differ radically from that seen for Quasars. We shall explore this point in more detail in §4.4. We also highlight in Fig. 5b those SMGs which were first identified in the UV spectroscopy from a single-line (Ly in all cases except one), and note again that 50% of these sources have been confirmed at the correct redshift through near-IR spectroscopy of the H or [Oiii]5007 lines. These single-line identifications reflect the higher redshift tail of our measured N(), consistent with the generally brighter optical continuum magnitudes of the sources over the sources.
It is also interesting to study the N() as a function of 850m luminosity. Model predictions of the N() for 850m-selected galaxies have been presented by Baugh et al. (2004). In Fig. 5b we have overlaid their model N() for SMGs with S mJy and S mJy, the latter being dominated by the 2 mJy sources because of the steep 850m counts. Their models are normalized to have the same number of sources in the N() integral. Baugh et al. (2004) find that the median redshift of the SMGs does not change significantly over the 2–8 mJy flux range.
We can divide our observed SMG sample into equal number bins with S mJy and S mJy. Our submm brighter galaxies (median S mJy) lie preferentially at higher redshifts with a median redshift (interquartile 0.35), compared to the submm fainter galaxies (median S mJy) with median (interquartile 0.61). At face value, this result disagrees with the Baugh et al. predictions. As we might expect from a radio-flux limited survey, the radio properties of the submm bright and faint samples are indistinguishable (submm bright: SJy, submm faint: SJy), suggesting that our radio selection criterion is at the root of the discrepancy with the Baugh et al. model. For example, if the overall properties of submm-selected galaxies were similar for S mJy and S mJy samples (in particular the FIR-radio correlation) as in the models of Baugh et al. (2004), we would expect to miss more of the S mJy sources at higher redshifts due to the radio detection criterion. As we will see in § 4.1, these properties imply that the submm bright and faint sub-samples will coincidentally have indistinguishable distributions in dust temperature. Thus while at face value these results appear to imply that more bolometrically luminous SMGs tend to lie at higher redshifts, consistent with a strong luminosity evolution (see § 4.2), strong selection effects are at present in our submm/radio sample, and we must exercise caution in our interpretations of these trends.
3.4. Optical Spectroscopic Characteristics of SMGs
With 73 spectral identifications, we have the statistics to begin exploring the range of galaxy types in the SMG population (Table 6). Eighteen of our galaxies (25% of the sample) show clear AGN signatures in their spectra: three of these are broad-line AGN, with the remaining fifteen being narrow-line AGN. A larger fraction of SMGs (30/73) have restframe UV spectroscopic characteristics similar to those of star-forming galaxies, without any identifiable AGN signatures. The remaining 25 spectroscopically-identified SMGs in our sample have redshifts which are identified primarily through a strong Ly line, and do not have the continuum signal-to-noise to rule out weak AGN features. However, we note that the limits on their Ly to [Civ]1549 line ratios are generally consistent with those expected for starbursts. We stress that the relatively high completeness of our survey relies in part upon the surprising strength of the Ly emission from these supposedly highly-obscured galaxies. The flux of the Ly emission line indicates that Ly photons can readily escape from submm-selected galaxies and suggests that they may have very patchy and inhomogeneous dust distributions (see Neufeld 1991; Chapman et al. 2004b).
The high fraction of UV-emission line galaxies in our sample (38/56 of those at high enough redshift to detect Ly, or 68%) is striking as compared with restframe UV-selected galaxies at –3, given the similarity of their broadband colors (discussed below). The Lyman-Break Galaxy population (LBGs, Steidel et al. 2003) at , show strong Ly emission in only 25% of cases (Shapley et al. 2003), and their lower-redshift counterparts, the BX/BM galaxies, show an even lower fraction with Ly emission – (Steidel et al. 2004). In part, however, this might be a a selection effect resulting from the difficulty of measuring absorption-line redshifts for the fainter SMGs (from the total spectroscopically observed sample of 98, there are 38/81 or 47% Ly emission-line systems in the total sample of spectroscopically-observed galaxies, again excluding the spectroscopically identified SMGs at redshifts too low to detect Ly, ). If we only consider the subsample of SMGs with (21 galaxies) where our spectroscopic identifications are effectively complete, Fig. 1, 10/21 are at to measure Ly. 8/10 of these have Ly in emission.
In addition to the 73 SMGs with robust redshifts there are 25 of the optically-faintest radio-SMGs for which we have spectroscopic observations, but failed to measure a redshift. None of these sources appear to exhibit strong, narrow emission lines in the observed UV/optical wavebands. There are two possible redshift ranges in which this population could reside. Firstly, they may lie at –1.8, where no strong emission or absorption features fall in the sensitive range of the LRIS spectrograph. Alternatively, they may lie within the redshift distribution of our spectroscopically-identified sample, but have spectra which are characterized by absorption lines, in particular absorbed Ly. As these tend to be amongst the faintest sources in the sample (Fig. 1), the signal-to-noise ratio in their spectra is often lower than for our successful spectroscopic identifications.
To summarize, from the 98 radio-SMG for which we obtained spectroscopic observations: 18% show obvious AGN characteristics; 31% are apparently star-forming galaxies; 25% are difficult to classify, but remain reasonable candidates to be star-forming galaxies; and 26% are spectroscopically unidentified, and so are unlikely to be strong AGN at or (but could be star-forming galaxies with weak/absent emission lines at almost any redshift). Assuming that the redshift distributions for the AGN and starburst populations are comparable, including those spectrally-unclassified SMGs at –1.8 with AGN spectral signatures is unlikely to increase the fraction of such galaxies in the total sample above 25% (see §3.5). This is a lower AGN fraction than suggested by either the identification of X-ray counterparts with QSO- or Seyfert-like luminosities (%, Alexander et al. 2003) or H line widths of km s-1 (%, Swinbank et al. 2004). We conclude that perhaps a third of SMG’s identified as apparently star-forming or unclassified based on their restframe UV spectral properties are likely to host unidentified (most likely obscured) AGN.
3.5. Optical Photometric properties of SMGs
In the deepest ground-based optical images the majority of SMGs are detected in most or all wavelengths observed: this is particularly true in the HDF-N and Westphal-14hr/SSA22 fields for which extremely deep imaging from Subaru/SuprimeCAM and Kitt Peak/MOSAIC imaging (Capak et al. 2004), and deep (hereafter ) images (Steidel et al. 2003) exist respectively.
In Fig. 3.5 we show the – color-color diagram for those radio-SMGs with robust spectral identifications and redshifts . We compare these to the and selection criterion presented in Steidel et al. (2004). Color transformations were determined between filter bands by matching the catalogs of and galaxies lying in the extended-HDF region, and rederiving the colors from the Capak et al. images. The AB-magnitudes of the Steidel et al. (2004) BX/BM galaxies in the HDF region were first measured using the SUPRIME and MOSAIC images of Capak et al. (2004). A new BX color-selection box was then defined empirically for these filters. The median offset in magnitudes , , (0.22, 0.13, 0.04) was then applied to our measured -mag for the SMGs.
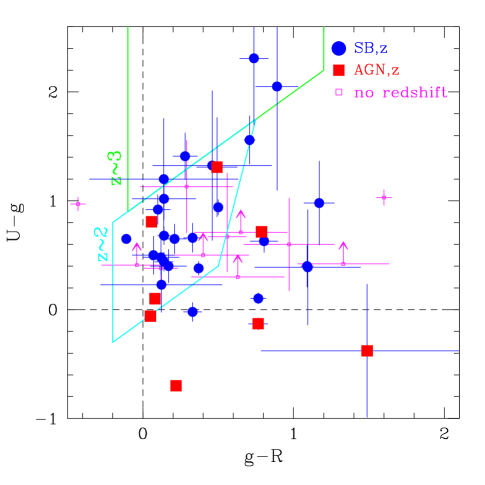
Many of the SMGs (65%) lie well within the color selection region from Steidel et al. (2004), in accord with their spectroscopic redshifts. Approximately 30% of the galaxies are too red in to be selected by the restframe-UV criterion, possibly because of dust extinction. Smail et al. (2004a) present a complete study of the extinction properties of SMGs using near-IR photometry. The relative classification of AGN and SB populations of SMGs suggest that the strong emission-line AGN tend towards redder colors with a median =0.50.1, compared with the non-AGN sample .
We also show the colors of sources for which we failed to obtain spectroscopic redshifts. Many of these are detected near the limit of the photometry in the passbands, but are undetected at , and are thus shown as lower limits in in Fig. 3.5. Many of these galaxies also lie within the color selection region, but with much larger uncertainties. This provides some additional evidence that the radio-SMGs for which we were unable to obtain spectroscopic identifications likely span a similar range in redshift to those with robust identifications.
While the colors of many SMGs appear consistent with the BX-selection, a significant fraction (50% of the total radio-SMG sample, and 30% of the spectroscopically identified radio-SMGs) are too faint to be selected in typical BX/LBG samples (typically – Steidel et al. 2004). All SMGs lying within the denoted regions have spectroscopic redshifts consistent with their colors. SMGs lying outside these boxes typically have but redder than BX galaxies, or have colors which are very blue for their redshifts, likely a result of their AGN nature. Of the SMGs depicted in Fig. 3.5 (having and lying in the HDF, Westphal-14, SSA22 fields), the median and average quartile distribution of the total sample is , while the distributions for the spectroscopic successes and failures are respectively, and .
This exercise suggests that deep optical imaging may provide reliable photometric redshifts, immune from the temperature uncertainty that plagues simple radio/submm photometric redshift estimates (see § 3.6). Using the hyper-z software (Bolzonella et al. 2000) for this sample and their magnitudes, we derive photometric redshifts with a median error of % (see also Smail et al. 2004a and Pope et al. in preparation).
3.6. Submm/Radio indices and redshifts
In Fig. 3.6, we show the ratio of submm to radio flux as a function of redshift for our SMG sample. We also assess the locations of the eight radio-identified submm galaxies from the literature with robust redshift identifications. The variation of the submm/radio flux ratio with redshift is the basis for the Carilli-Yun redshift indicator (Carilli & Yun 1999, 2000). However, this diagram also depicts the variation in SED properties spanned by the SMGs, although these are subject to considerable selection effects. This figure is in essence a depiction of the joint evolution in the FIR/radio correlation and the range in dust properties in luminous galaxies (see § 4.1).
We overlay the tracks of two galaxy classes on Fig. 3.6, representative of quiescent spirals, such as the Milky Way, and ultra-luminous galaxies (L L⊙), such as Arp220. We also show the track derived by Yun & Carilli (2002) using a compilation of low and high redshift galaxy samples. This latter track, and other similar ones from the literature (Dunne et al. 2000; Barger, Cowie & Richards 2000), have been widely used to estimate SMG redshifts. If the SMGs were to represent a population with a narrow range of spectral energy distributions, then we would expect them, on average, to trace a well-defined track in the CY diagram. As they appear to be widely scattered at a fixed redshift (an order of magnitude range in the flux ratio at ), a natural interpretation is that they span a range in SED shapes (characterized by Td, § 4.1). We note that our radio selection criteria may bias us towards identifying objects with enhanced radio-to-FIR emission (similar to the local IRAS galaxy, Mrk 231, whose AGN contributed a comparable radio luminosity to the starburst in this galaxy). The preferential inclusion of these systems in our radio-identified sample would lower the typical flux ratio of the high redshift SMGs in our S850μm/S1.4GHz diagram by about 0.3 dex. Yun, Reddy & Condon (2001) suggest that such galaxies could make up a few to 10% of submm galaxies, implying at most a small bias.
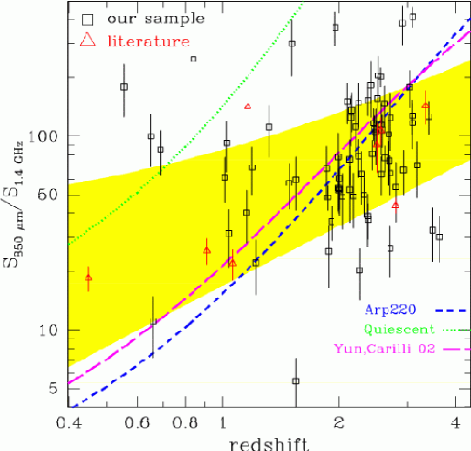
To quantify the dispersion of S850μm/S1.4GHz we divide the sample in redshift into three bins containing equal numbers of SMGs and plot the 1- dispersion envelope on Fig. 3.6. Clearly a large dispersion in SED properties is spanned by our SMG sample, with a preference for the warmer templates (the Arp220, rather than quiescent models). The trend of submm/radio flux ratio with redshift is much flatter than the rapidly rising template tracks, and can be parameterized by:
with an average RMS dispersion in the range –4 of S850μm/S1.4GHz) . The shallow slope of this trend greatly increases the error in the redshift estimate for a given submm/radio ratio. This behaviour can be partially explained by the fact that lower redshift sources tend to be lower luminosity and cooler, following the weak local correlation between temperature and luminosity (Chapman et al. 2003c). However, this should be only a slight effect. The selection criteria in the submm/radio are mainly responsible for the narrow range of submm/radio values observed, and almost no discrimination is achieved for individual source redshifts, where (see also Blain et al. 2004). It should be noted that a purely submm-selected sample should show an even wider range in submm/radio flux ratios than our sample – which already demonstrates that the range of SED properties in the SMG population render simple photometric redshift estimates too imprecise to be useful for predicting redshifts for individual galaxies (e.g., Aretxaga et al. 2003; Efstathiou & Rowan-Robinson 2003; Wiklind 2003).
The Carilli & Yun redshift estimator has been extensively employed (Smail et al. 2000; Barger, Cowie & Richards 2000; Chapman et al. 2001, 2002b; Ivison et al. 2002), but until now it has not proved possible to critically compare it to a large sample of SMG’s with precise redshifts. Perhaps surprisingly, the median redshift predicted for the SMG population using S850μm/S1.4GHz () has turned out to be remarkably close to the value we derive. In part this is because, on average, the SMGs have SEDs similar to local ULIRGs and so the average properties derived for the population are not too far wrong. However, this effect is further aided by the relatively narrow redshift distribution seen for SMGs – which limits the intrinsic dispersion in the median redshift for the population.
4. Discussion
4.1. Dust temperatures and Luminosities
Having constrained the redshift distribution and basic observable properties of the SMGs, our next goal is to study the distribution of their SED properties and bolometric luminosities.
Studies of local and moderate redshift galaxies in the radio and submm wavebands suggest that variations in both the dust properties and the empirical relation between the FIR luminosity () and 1.4 GHz radio (Helou et al. 1985; Condon 1992) will affect the observed radio flux from a SMG. The dust properties in luminous IR galaxies such as SMGs are potentially very complicated, requiring many parameters for a complete characterization. However, Blain et al. (2002) have demonstrated that the characteristic dust temperature (– the best single temperature grey-body fit to the SED) is the main parameter influencing the ratio of submm to radio emission and hence the observed radio flux. Since we only have a redshift and two photometric points in the relevant region of the SED (850m and 1.4 GHz) from which to disentangle the dust properties, we will thus concentrate only on the dust temperature, fixing the remainder of the dust properties at canonical values for local Ultra-Luminous Infra-Red Galaxies (ULIRGs). In the absence of additional information for most of our sources, we adopt a dust emissivity of .
We therefore proceed by translating our observables (submm and radio fluxes, and redshift) into intrinsic physical properties, and total infrared luminosity (defined as the integral between 8m and 1100m, and derivable from FIR with a small color-correction term – e.g., Dale et al. 2001). We calculate explicitly by adopting a suite of dust SED templates from Dale & Helou (2002), spanning an equivalent range of from 15–90 K (e.g., Fig. 4.1).
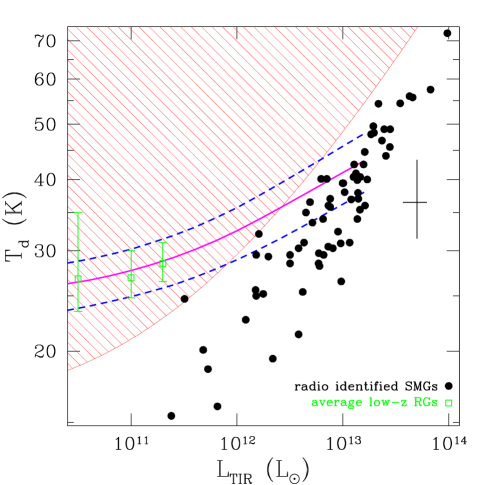
The templates assume the median value of the local FIR/radio relation (Helou et al. 1985) allowing a one-to-one mapping of S850μm/S1.4GHz flux ratio to . These template fits to a representative selection of galaxies from our sample are shown in Fig. 4.1. We also assume the low-redshift FIR/radio relation to calculate for our sources. Radio luminosities are calculated by first K-correcting the observed fluxes to the restframe using a synchrotron spectrum with an index of . Our adopted spectral index is supported by the small number of galaxies in our sample which have measured radio spectral indices (Ivison et al. 2002; Richards 2000). In this parametrization, the location of a galaxy with a measured redshift in Fig. 3.6 is uniquely described by its value of . In Fig. 4.1 we plot Td versus for our SMGs; the median is 36 K (12 K interquartile range) and the median L⊙, but note the strong correlation between observed luminosity and temperature. With our assumption of the FIR–radio relation, and fitting to the observed distribution for our SMGs, the dust temperature is approximately proportional to
Interestingly, the SMGs in our sample show no temperature dependence with submm flux density: the submm bright and faint sub-samples (as described in § 3.5) have indistinguishable distributions in : K versus K (interquartile error ranges).
Two strong selection effects are at work in Fig. 4.1. The first is the selection effect imposed by the sensitivity limit of the submm observations, this is shown as a shaded region in Fig. 4.1: galaxies with hotter dust temperatures are excluded from our sample unless they exceed a minimum luminosity. Similarly the requirement for a radio detection removes the coldest galaxies from our sample, selectively removing objects from the region in the lower right of Fig. 4.1. However, the dominant effect clearing out the lower right region of Fig. 4.1 is the steeply declining high tail of the luminosity function (see Blain et al. 2004b for a detailed analysis). The requirement for a radio detection is the origin of the difference between the high-redshift tail of the observed redshift distribution and that predict for a purely submm flux-limited sample in Fig. 3.3. The model suggests that a reasonable fraction of SMGs with radio fluxes below our detection limits should have redshifts in a similar range (–3.5) to the radio-SMG presented here; but that these SMGs have a slightly cooler dust temperature (at a given luminosity) than found in our radio-SMG sample.
Both our inferred dust temperatures and luminosities depend on the FIR–radio relation holding at high redshifts. Based on empirical relations of local IR galaxies, the scatter in the FIR–radio (0.2 dex) and Td- relations ( dex) are expected to vary the observed submm/radio flux ratio in SMGs, producing a random uncertainty in our SMG calculations. However, it is systematic errors due to evolution of these two relations (neither of which has been measured explicitly at high redshift) that are of more concern when comparing the median properties of the SMG population with luminous, obscured galaxies in the local Universe. We now discuss possible sources of error and the constraints which are available on the form of the relations at high redshifts.
One possible source of error in our estimates would come if excess radio-loud emission from an AGN was boosting the observed radio flux, this would result in being over-estimated. This emphasises that correct interpretation of Fig. 4.1 is more to do with the range of SED types spanned by our sample as a function of luminosity. The SED variation between our SMGs could in principle arise entirely from a larger scatter in the FIR–radio correlation than observed locally. In the extreme case that our entire sample were at the same dust temperature of =36 K, the FIR–radio correlation would have to have a dispersion of 0.8 dex to reproduce the variation in SEDs observed in Fig. 4.1. There are physical reasons why there could be such deviations from the correlation at high redshift. For instance, ages, differences in dust properties, magnetic field strength or the initial mass function, all are conceivable in very luminous, active young galaxies at high redshift, and all would act to increase the dispersion in the relation (see also Eales et al. 2003).
Garrett (2002), has used the radio measurements of 15m ISO galaxies to infer that IR galaxies broadly follow the local FIR–radio relation. A more reliable test of our – estimates is the measurement of SMG SEDs at shorter submm wavelengths. Fig. 4.1 suggests that the peak of the SEDs for our SMGs will lie at observed wavelengths around 350–450m and hence flux measurements at these wavelengths will be particularly useful for determining the characteristic dust temperatures of the galaxies. Although the SCUBA instrument simultaneously measures 450m fluxes (in parallel with our 850m observations), our 450m data is typically of insufficient quality (due to the weather conditions) to usefully constrain the SEDs, failing to individually detect the vast majority of SMGs. However, stacking our 450m observations does verify that the FIR/radio and 850m points appear to predict reasonably well, although calibration uncertainties at 450 m make this a difficult measurement (see also Dunne et al. 2002). The average (inverse variance-weighted) measured flux is =326 mJy for our SMG sample, while the median FIR–radio ratio predicted =4112 mJy. As we have noted, we do not have sufficient signal-to-noise on an object-to-object basis at 450m to determine how tight the correlation is.
At somewhat shorter wavelengths, Kovacs et al. (2004) have detected more than 10 of our sample using the 350-m SHARC-2 camera on the Caltech Submillimeter Observatory. These results suggest that our predictions are accurate to 20% (without considering systematic calibration effects of SHARC-2), corresponding to an uncertainty in the total IR luminosity of 85% ( 3.5 for sources). This implies that the FIR/radio correlation can be used to predict the dust temperature of a typical SMG with reasonable precision, and therefore that radio observations alone could be used to estimate FIR luminosity of a star-forming galaxy for many purposes, once the spectroscopic redshift has been measured.
Fig. 4.1 provides a complementary view of the S850μm/S1.4GHz–redshift diagram in Fig. 3.6, with the redshift information now hidden in the luminosity and differences in S850μm/S1.4GHz manifested as changes in Td. Fig. 4.1 does however allow for a direct consistency check with the properties of local and moderate redshift IRAS galaxies, of which our radio-SMG population could represent high-redshift analogs. To provide a stepping-stone to the high-redshift SMG population, we have also calculated the values for –1 Jy radio galaxies (Fig. 4.1) from Chapman et al. (2003a) in the same manner as for our radio-SMG sample, using the S850μm/S1.4GHz ratio. These allow us to confirm that the form of the Td– relation from the local IRAS samples appears to hold out to . Note however that these lower redshift radio sources are not individually detected in the submm, and so the error bars are dominated by measurement errors, rather than a true distribution of the values. The average submm flux densities of these galaxies are 1 mJy, and so they fall within the shaded submm flux selection region of the diagram.
Fig. 4.1 demonstrates that the distribution of the radio-SMG population appears inconsistent with the expected local Td– relation characterized by Chapman et al. (2003c) (see also Blain et al. 2004b). The median of our SMGs (36 K) is lower than the locally predicted for galaxies of these luminosities (at =, the local median is 42 K).
As we noted in §3.6, our radio detection criterion might be expected to bias us towards galaxies with SEDs similar to Mrk 231, with radio excess over the local FIR/radio relation, which make up 10% of local IRAS galaxies (Yun, Reddy & Condon 2001). Such galaxies would be offset to hotter temperatures in Fig. 4.1, in the opposite sense to the offset we see and are therefore not likely to represent a large fraction of our SMGs. Nevertheless, the decreased median (relative to the local prediction) could still be a selection effect, since we have potentially missed luminous galaxies with both hotter and colder dust temperatures through our combined radio/submm selection function. Chapman et al. (2004b) have uncovered a sample of apparently hot and luminous galaxies (lying above our submm selection boundary) whose inclusion would increase the median significantly. In contrast, Ivison et al. (2005) have suggested likely identifications for submm galaxies in our sample that lack radio detections; these galaxies would appear on Fig. 4.1 with colder than our radio-SMGs. Both of these missing populations of luminous galaxies suggest that the true -scatter in high-redshift, luminous galaxies is larger than observed locally. The scatter in the observed temperatures of our SMGs (12 K interquartile range) is already larger than observed locally (8 K interquartile range). While we note that some broadening of the local distribution is suggested for the highest luminosity galaxies, any additional hotter or colder SMGs in the high-redshift sample would only increase the this difference in the dispersion of the two populations.
On their own our spectroscopic redshifts and radio/submm photometry for radio-SMGs can not provide a complete picture of the range in SEDs spanned by the most luminous galaxies in the Universe. However, the available evidence suggests that some caution should be exercised when assuming that the – properties of luminous, high-redshift dusty galaxies are identical to those at low redshifts.
4.2. The bolometric luminosity function
Estimates of radio-SMG dust temperatures using the FIR–radio correlation allow the calculation of bolometric luminosities, and we can use the effective volume of our submm redshift survey to construct a bolometric luminosity function in two redshift ranges at and (Tables 4, 5).
The 850-m fluxes of the galaxies in our sample span a factor of 5 range, translating into a similar range in submm luminosities. By including the temperature information we can estimate bolometric luminosities, which span a slightly larger range, . We note again that our bolometric luminosity calculations assume that the – properties of luminous, high-redshift dusty galaxies are similar to those at low redshifts, and some caution should be exercised when interpreting the results.
Computing the raw volume densities of the radio-SMGs is accomplished using the radio luminosity and an accessible volume technique as described in Avni & Bahcall (1980). We adopt a general form for the luminosity function
with as the number density of sources (Mpc-3) in the luminosity range –. The accessible volume, , represents the i-th source in the sample, the maximum volume in which the object could be located and still be detected in our 1.4-GHz VLA maps. The sum is over all sources within the luminosity range. We then map sources to their FIR luminosity using the results of § 4.1. This procedure naturally accounts for the spectroscopic incompleteness of our survey, assuming that our spectroscopically-identified sources are representative of all the total population of radio-SMGs. The spectroscopic desert has also been taken into account, since the volume between –1.8 is not included in either our or bins.
There are several selection effects in our samples whose influence on the luminosity functions cannot be easily quantified. The most obvious of these are the overlap with radio-unidentified SMGs, and differences in radio detection rate as a function of submm flux (fainter submm sources are likely to have fainter radio counterparts, and our completeness in identifying radio counterparts will be reduced). We have discussed the probable redshift range for the 35% of the total SMG population without radio identifications. These sources probably mostly lie at higher redshifts (Fig. 3.3), but overlap with the high-redshift tail of the radio-SMGs (§ 2.4), producing increasing incompleteness for the faintest and coldest sources at . We may therefore have slightly underestimated the power-law slope of the luminosity function: and we note that incompleteness quickly dominates the high-redshift sample at 1013 L⊙.
Comparing the number counts as a function of submm flux for our sample with those from imaging surveys (e.g., as compiled in Blain et al. 2002; Borys et al. 2004) allows us to estimate our relative radio completeness with submm flux. SMGs with 5 mJy are detected in the radio more frequently than 3–5 mJy sources (Chapman et al. 2002b – their Fig. 8). A correction was calculated for the effect of differential radio selection by fitting this progressive divergence of the radio-SMG count from the total submm count with decreasing submm flux. This correction was applied to the submm luminosities, before translating to FIR luminosities. The result is a steepening of the slopes of the FIR luminosity function. The correction is designed to reduce the sensitivity of our luminosity function to the -dependent radio selection in our faintest bins, while representing the pure radio-identified sample for the brighter SMGs.
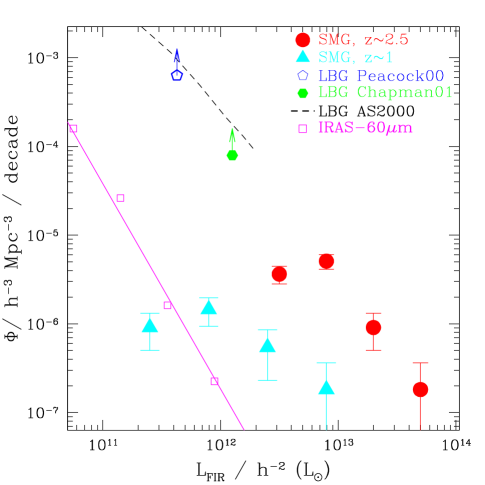
In Fig. 4.2, we plot our luminosity functions, parametrized by FIR luminosity (). We compare this to the equivalent distribution for local IRAS galaxies: the local FIR luminosity function for galaxies with S1.2 Jy from Chapman et al. (2003c), which is constructed in a consistent manner to our SMG estimated function using the Dale & Helou (2002) SED templates.
The comparison in Fig. 4.2 reveals an evolution in number density of three orders of magnitude for FIR-luminous galaxies locally and at . The slopes of the bright ends of our SMG luminosity functions are very similar to the local IRAS distribution, suggesting that the evolution from the local function through the and functions are consistent with almost pure luminosity evolution at the bright end (although density evolution cannot easily be distinguished from luminosity evolution for the bright end of the LF – e.g., Chary & Elbaz 2001). We note however that density evolution is known to overproduce the submm background (Blain et al. 1999a), since it would result in a very large number of low luminosity objects. The turnover in our lowest luminosity bins primarily reflect incompleteness in our survey, although we have attempted to correct for this as described above.
To better constrain the form of the faint-end of the FIR luminosity function at we need to turn to samples of galaxies selected in other wavebands. In particular, we can try to use limits on the FIR emission from UV-selected galaxies to place a lower limit on the space densities of high-redshift sources with much lower FIR luminosities than are detectable with current submm facilities. The submm properties of the LBGs have been discussed by Chapman et al. (2000, 2001b), Peacock et al. (2000), and Webb et al. (2003b). Chapman et al. (2001b) and Peacock et al. (2000) report statistical detections of luminous LBGs at 850 m, while Webb et al. (2003b) report a formal non-detection of the combined sample of LBGs lying within their CFRS-03 and Westphal-14 survey fields. We place the Chapman et al. (2001b) and Peacock et al. (2000) measurements on Fig. 4.2, by assuming a =36 K dust template to estimate . We plot both points as lower limits owing to the unknown fraction of the FIR-luminous population which are missed by the UV selection. Nevertheless, it is clear that the inferred properties of the UV-selected populations support a steep faint-end slope to the FIR luminosity function which is similar in form to that seen for IRAS galaxies in the local Universe.
We also show on Fig. 4.2 the inferred FIR luminosity function based on FIR–UV- relation (Meurer et al. 1997) applied to a survey of LBGs from Adelberger & Steidel (2000), and normalized to the effective volume containing the LBGs (Steidel et al. 1999). For the BX/BM population (Steidel et al. 2004), stacking analysis of their radio and X-ray emission have suggested that the bolometric luminosity function of Adelberger & Steidel (2000) is a reasonable representation (Reddy & Steidel 2004).
It is difficult to determine whether pure luminosity evolution can explain the dramatic increase in volume density of high-redshift galaxies with 1011–10 (based on the UV- and submm-selected samples) over similarly luminous local galaxies. The high-redshift, FIR luminosity function remains poorly constrained in both low- and high-luminosity regimes. For UV-selected galaxies at high redshift it is currently very difficult to accurately estimate (e.g., Adelberger & Steidel 2000; Reddy & Steidel 2004). In addition, it is unclear what the completeness is in () for a UV-selected sample. The submm-estimated () at high luminosities is also poorly constrained due to incompleteness effects that are difficult to characterize (as described above). We have already explored the extent to which the submm-selection itself may have significantly underestimated the total volume of luminous galaxies at high redshifts, as galaxies with hotter characteristic dust temperatures are missed by submm selection (Chapman et al. 2004b; Blain et al. 2004a). Similarly, our radio-pre-selection means we are missing a small fraction of colder SMGs without radio counterparts which may contribute to the number density of galaxies with (Ivison et al. 2005). We anticipate the deep Spitzer observations of all these high-redshift galaxy populations will shed additional light on this complex question.
4.3. The restframe-UV derived of SMGs
By far the best-studied population of high-redshift star-forming galaxies is that identified through their restframe UV-emission (Steidel et al. 1999, 2004). These galaxies have provided unique insights into the evolution of the star-formation density in the Universe and the corresponding formation of normal galaxies (Madau et al. 1996). A key question for SMGs is to understand how they fit into the framework defined by the UV populations – in particular, how well does the recipe for deriving SFRs for UV-selected galaxies work on this restframe FIR-selected population?
We can use our multi-color optical data for a subset of the SMGs to investigate their restframe UV properties and derive SFRs in an analogous manner to that applied to LBGs. This analysis relies on estimating the luminosities and spectral slopes at wavelength around 1500Å in the restframe. For galaxy populations at –3, this can be achieved using - and -band photometry for the HDF sources, and using - and -band photometry for the SSA22 and Westphal-14 sources.
As described in §2, we measured -band photometry for all SMGs in our sample. Since UV-derived luminosities and the corrections for dust extinction, are highly susceptible to photometric errors (Adelberger & Steidel 2000), we need to isolate a sample of SMGs with well-measured photometry. Unfortunately, most SMGs at higher redshifts are faint and as a result to obtain a reasonable sample we are required to use those galaxies where the photometric errors are only less than 0.1 mags in both bands. We define the subsample which includes all 33 SMGs lying in the HDF, Westphal-14, and SSA22 fields, with redshifts to allow for accurate measurement of the dust-corrected UV luminosity (the same sample used in Fig. 3.5). We also consider the HDF subsample on its own (17 SMGs), since its large size and contiguous areal coverage make it statistically representative on its own. The sample has a median =24.9 and a 1 rms of 1.1, and a median photometric error of . The dust-corrected luminosities are biased in a manner which is difficult to quantify. The optically-faintest sources will have very small UV luminosities, but may in principle have very steep continuum slopes, with large implied dust correction factors (Adelberger & Steidel 2000). While we will calculate UV luminosities for all SMGs in this subsample, we identify those SMGs showing AGN spectra, and conservatively exclude them from the average properties calculated below.
To estimate the SFR from the UV, we follow the prescriptions of Meurer et al. (1997) and Adelberger & Steidel (2000): the UV luminosities are first corrected for line blanketing in the Ly forest, and then corrected for dust extinction using the UV continuum slope derived from the color, corresponding to wavelengths between rest-frame 1000Å and 2900Å. The transformations from the measured to in the HDF field are described in § 3.4. We correct the color for the opacity of the Ly forest according to the statistical prescription of Madau (1995). Values of ranging from 0.0 to 1.0 correspond to a UV spectral index to +0.6, when the spectrum is approximated by a power law of the form . The color is then mapped to a color excess, E, from which the dust-corrected UV luminosities are derived. Our median , corresponds to E for a Calzetti extinction law, very close to the distribution for LBGs presented in Adelberger & Steidel (2000), suggesting that the UV identifications of SMGs do not distinguish themselves from the general LBG population with significantly redder UV spectral slopes (c.f. Smail et al. 2004a).
The dust corrected UV luminosity translates into a SFR, following Kennicutt (1998):
where the relationship applies to galaxies with continuous star formation over time scales of 108 years or longer. For younger stellar populations, the UV continuum luminosity is still increasing as the number of massive stars increases, and the above equation will underestimate the SFR. We measure a median SFR=13 from the dust corrected UV. Finally, to compare these estimates with those from the FIR we simply convert our UV-derived SFR directly into a FIR luminosity (Kennicutt 1998).
From the dust-corrected UV, we predict a median FIR luminosity of ; this compares to the submm/radio measurement of . This corresponds to a median radio/submm-to-UV ratio in the derived of 100, with a quartile range of 29–168. We reiterate that the UV estimate has been corrected for dust extinction in the standard manner. The dust-corrected UV-estimated FIR luminosities are compared directly with the FIR luminosities measured from the radio/submm in Fig. 4.3. The relative offset between the two does not differ significantly if we use the more statistically reliable subsample from the HDF: versus . In addition, we note that those sources in the HDF with the faintest apparent -band magnitudes do not have significantly different UV-inferred from those with brighter magnitudes.
As suggested above this procedure of estimating the FIR luminosity from the UV continuum slope is meaningless for the SMGs exhibiting strong AGN-signatures in their spectra, since the UV continuum is not necessarily dominated by stellar emission, and so we have not included these AGN-classified SMGs in the median calculations above. We use different symbols for the SMGs with AGN spectra in Fig. 4.3 to identify them to the reader.
Since the FIR–radio luminosity relation is essentially linear except at the faintest extreme (Condon 1992), the relation at high redshift would have to vary by a similar factor to our observed discrepancy () in order for the luminosity estimates to be in accord. This is highly unlikely given the relatively well understood physics of the relation (Condon 1992). However, direct measurements of the FIR-radio relation at high redshift are required to refute this possibility. (We can begin to rule out evolution of FIR–radio at the implied level 100, based on previous discussion in § 4.1 – Kovacs et al. in preparation.)
Clearly the dust-corrected UV luminosity using the standard prescription rarely hints at the huge bolometric luminosities measured in the radio/submm, underestimating the true luminosity by over two orders of magnitude. Three of the SMGs do have UV-inferred FIR luminosities within a factor of three of that observed in the radio/submm. One of these shows hybrid SB/AGN characteristics and complicated multi-component kinematics (SMM J163650.43+405734.5 – Smail et al. 2003a). The other two are apparently starbursts which reveal the true magnitude of their bolometric luminosity in the UV.
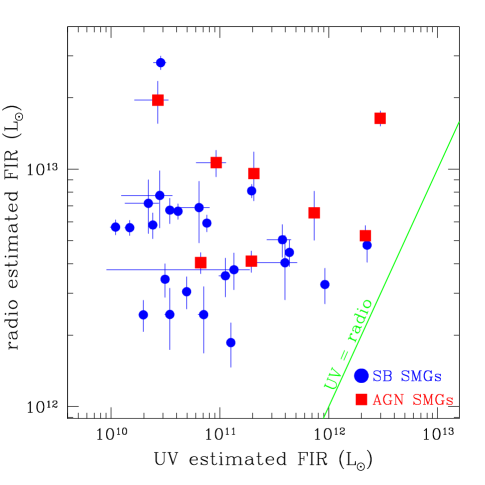
The very large disparity we derive for the UV- and radio-estimated luminosities of UV-detected SMGs is apparently at odds with the conclusion of Reddy & Steidel (2004) who find that radio (and X-ray) estimates of the SFRs for BX galaxies on average match the UV-derived SFRs, with an average dust correction factor of just 4.5. How do we reconcile this with our finding that SMGs have UV-inferred SFRs which underpredict the radio-measured SFR by a factor of 100 on average?
One possible contributing factor is that there may be a wide range in dust obscuration in the high-redshift galaxy population. Chapman et al. (2004b) used MERLIN radio images and HST UV images of SMGs at 0.3″ resolution to study the differential emission between the two wavelengths. They demonstrated that the radio emission (and by implication submm emission) is always more compact than the UV as traced by HST imagery. In addition they found that the radio highlights regions of low UV emission as bolometrically-luminous in 50% of the SMGs. An increasing proportion of very-highly obscured activity may therefore be present in the more active systems. This has also been demonstrated through measurements of the nebular H emission line for our SMG sample (Swinbank et al. 2004). In this way the selection of flux-limited samples of galaxies in the restframe UV and FIR would give significantly different mean obscurations. This is equivalent to stating that the UV luminosities and spectral slopes are measurable for only the least-obscured regions of the galaxies and hence are not representative of the bulk of the emission in these galaxies. It is not therefore surprising that they indicate much lower bolometric emission.
We therefore conclude that although many SMGs can be detected, and their redshifts estimated or measured in deep observations in the restframe UV, they cannot generally be identified as bolometrically luminous galaxies without the use of radio or submm observations. There is a second, related important point to make before we proceed to discuss the evolutionary history of the luminosity density contributed by SMGs versus UV-selected galaxies over the lifetime of the Universe. In the light of the vast mismatch in the derived bolometric emission for this population we will assume that the contribution of bright SMGs to the star formation density at high redshifts is not included in current UV estimates (e.g., Madau et al. 1996; Steidel et al. 1999) – and so we need to derive the contribution from the highly obscured population independently and sum this with that from the UV to derive the total.
4.4. Luminosity and Star Formation histories
Using the bolometric luminosities measured above for the SMGs, we calculate the following bolometric luminosity densities in redshift bins from our survey: = , and for redshift intervals of –1.5, 1.8–2.6 and 2.6–3.5 respectively. These luminosity densities are calculated for the entire radio-identified SMG population, and corrected for spectroscopic completeness in the following way. For the 26% of radio-SMGs for which we did not obtain redshifts, we corrected the clear deficit of sources in the redshift range –1.8 to result in a smooth distribution matching our normalized model (Fig. 3.3). The remainder of the incompleteness (17%) was distributed uniformly over the entire uncovered by our robust redshift sample. Our justification for this procedure is two-fold. First, the S850μm/S1.4GHz properties of sources with robust redshifts are indistinguishable from those where we did not obtain redshifts, suggesting a similar range in and . Secondly, the colors of these two samples are similar, although with large uncertainties as many of the spectroscopic failures are typically very faint, and are consistent with colors of star-forming galaxies (Steidel et al. 2004): see §3.4.
In order to justify translating these luminosity densities into star formation rate densities (SFRDs) we must first clearly identify the signs of AGN activity in the individual galaxies, and then remove any contribution to the luminosities of these galaxies from the AGN, either direct contribution to the radio emission or through heating of dust by the AGN.
We begin by assessing the possible AGN contribution in individual submm galaxies from their UV spectral properties. Three SMGs are identified with QSOs in our radio-identified sample (SMM J123716.01+620323.3, SMM J131215.27+423900.9, and SMM J131222.35+423814.1): these are the only objects in which the optical luminosity is a non-negligible fraction of the bolometric luminosity. These sources have comparable optical and FIR luminosities and space densities to submm-detected QSOs at (Omont et al. 2001, 2003; Carilli et al. 2001). The fraction of optically bright QSOs in the SMG population could actually be slightly higher since 20% of our SMGs were pre-selected with optically faint magnitudes. This implies that only % (3/80, as a fraction of the total radio-SMG sample observed spectroscopically, which weren’t pre-selected as optically faint) of optically-bright AGN have emission with comparable luminosity to that seen in the optical waveband (since our survey would have uncovered all the QSOs emitting strongly in the radio/submm). This fraction of radio-SMGs are therefore removed from consideration in determining the luminosity density evolution.
There are several strong indications that star formation dominates the luminosity of the majority of the 98 radio-SMGs in our sample. As discussed in §3.3, 30% of our sample with the brightest UV continua exhibit stellar and interstellar absorption lines, implying that their continua are dominated by young, massive stars and not the non-thermal power law spectrum of an AGN. Another 25% of our sample have UV continua which are too faint to detect absorption features, but remain consistent with starbursts, while a further 25% do not reveal enough features to even identify a redshift. These statistics suggest that 80% of radio-SMGs do not harbor an partially- or un-obscured, luminous AGN.
The presence of an obscured AGN is much more difficult to determine from the restframe UV spectra and instead we have to turn to multiwavelength surveys of samples of SMGs. High spatial resolution radio observations of SMGs are one route for determining the morphology of their radio (and by implication FIR) emission and hence search for the presence of a strong AGN contribution to the FIR (identified as a radio point-source). Such studies reveal extended morphologies on scales 1″ in 65% of cases (8/12 galaxies in Chapman et al. 2004b). These observations suggest that AGN do not dominate the FIR emission of most SMGs, as star formation is the most likely route to produce spatially-extended FIR/radio emission. Several of the galaxies with spatially-extended radio emission show AGN emission lines in their rest-frame UV spectra, underlining the fact that intense starbursts are likely to be energetically-important, even in the presence of AGN.
A second route to search for obscured AGN is to employ observations in the X-ray waveband. The proportion of the submm population detected in deep Chandra and XMM-Newton X-ray surveys, which are sensitive to even strongly dust-obscured AGN (Ivison et al. 2002; Barger et al. 2002; Almaini et al. 2003; Alexander et al. 2003, 2005), at flux densities significantly greater than expected from star formation alone is at most 30%. X-ray spectral analysis reveals that most of the SMGs are not Compton-thick sources with QSO-like luminosities, and instead suggest that the AGN in SMGs have modest X-ray luminosities (Alexander et al. 2005).
Two more recently-pursued routes to search for the presence of an AGN within an SMG are to use near-infrared spectroscopy and mid-infrared imaging. Swinbank et al. (2004) report on near-infrared spectroscopy of 24 SMG’s from our sample. Of the 15 SMG’s classified as star-forming from their UV spectra, the emission line properties (line widths and [Nii]/H flux ratios) in the restframe optical support this classification for 60%, a further 20% have intermediate classifications (H line widths of 500–1000 km s-1) and only 20% are clear-cut AGN based on their restframe optical spectra. This broadly supports our UV spectral classifications and implies that only % of SMGs are likely to host luminous AGN. A similar rate of identification of AGN-like SEDs (20–30%) is found in recent Spitzer mid-infrared photometric studies of SMG’s: 2/13 from the combined sample of Ivison et al. (2004) and Egami et al. (2004) and 2/7 for the radio-identified SMGs in Frayer et al. (2004).
We conclude that around 20–30% of SMGs show detectable signs of AGN activity using a number of independent indicators. The broad agreement between this proportion based on such a wide-range of indicators gives us confidence that it represents a true limit to the extent of AGN activity in the population. We stress that this doesn’t indicate that 30% of the FIR emission from these galaxies comes from AGN. Even when an obvious and strong AGN is present in an SMG, there are signs that it does not dominate the bolometric emission (e.g., Frayer et al. 1998). The AGN contribution to the luminosity of the whole SMG population may be as low as 10% (Alexander et al. 2005). Using the results that 30% of SMGs have properties indicative of an AGN, we will conservatively assume that 70% of the FIR luminosity is derived from star formation in the total SMG population.
The luminosity densities we estimated earlier can now be translated into SFRDs by scaling them down by 30% to account for a maximal AGN-contribution and then using the standard calibration of L⊙ (M⊙ yr (Kennicutt 1998), we plot the resulting SFRDs in Fig. 4.4.
An additional point has been plotted on Fig. 4.4 to represent the % of the total SMG population which are not detected in our radio maps. Their redshifts are assumed to follow the radio-undetected fraction from our –normalized model (Fig. 3.3), implying a significant overlap with the redshift range probed by our radio-SMG sample. The redshift range we show for the radio-undetected sample extends to , at which point less than one SMG would lie in a total SMG sample of 151 galaxies (our targeted 98 radio-SMGs, plus an extra 35% undetected in the radio). This uniform population model is the most intuitive representation of the radio-unidentified SMGs, but we stress it is based purely on a model and it is possible that the radio-undetected galaxies have a very different distribution to the one we predict, extending to higher redshifts, or even a bimodal distribution compared to our well characterized radio-SMGs.
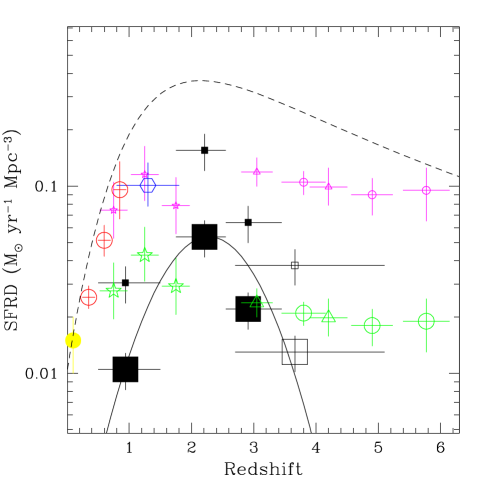
We can now estimate the evolution of the SFRD for all SMGs brighter than 5 mJy at 850m. A solid curve is plotted in Fig. 4.4, representing a Gaussian fit to the four SMG points (after redistributing the objects in the high redshift bins into two non-overlapping bins in redshift). The fit is with . This evolutionary behaviour is quite similar to that inferred for the luminosity density of Quasars (e.g., Boyle et al. 2000; see Fig. 5).
We also plot in Fig. 4.4 the SFRD estimated from a number of UV-selected galaxy surveys at –6 (Connolly et al. 1997; Steidel et al. 1999; Giavalisco et al. 2003), and low redshift () radio and mid-IR observations (Yun, Reddy & Condon 2001; Flores et al. 1999). A dust-correction of a factor of for the LBG population (Pettini et al. 2001) has been applied to the high-redshift UV-selected populations to give their dust-corrected estimates. Recent analysis of the SFRD evolution via CII1335.7 in damped Ly absorbers suggests a total SFRD comparable to the dust-corrected UV estimates (Wolfe et al. 2003a,b).
This analysis allows us to bring together the various high redshift populations. Fig. 4.4 highlights the relative importance of different classes of high-redshift star-forming galaxy, critical for a full understanding their relative importance galaxy evolution. We see that although the bright, radio-detected SMGs presented here represent only 20% of the 850-m background, the estimated star-formation density at –3 is within a factor of two of that inferred from restframe UV observations (Steidel et al. 1999; Adelberger & Steidel 2000). Including a contribution from the more numerous, less-luminous SMGs with 850-m fluxes below mJy would result in their SFRD matching or even exceeding that seen in the UV. Moreover, as we argued in the previous section, the SFRD contribution of this population is effectively missed by UV-selected surveys, and hence we must sum the bright SMG and UV estimates to determine the total SFRD.
We also need to account for the large fraction of the submm galaxy population which is below our mJy flux limit at 850 m. We chose only to integrate down to 1 mJy as this is the flux scale where the estimated SFR of typical UV-selected galaxies become comparable to the FIR sources. There is a correction factor of which is required for the submm points to account for the SMGs integrated down to 1 mJy, comprising % of the extragalactic background in the submm waveband (Smail et al. 2002). We apply this correction to Fig. 4.4 assuming that these fainter SMGs share the same redshift distribution to the brighter SMGs whose distribution is explicitly measured in this paper. The SFRD measurements corrected in this manner would suggest that SMGs are the dominant site of star formation activity in the Universe at –3. However, the discussion below suggests that our assumption of a similarity between the redshift distributions of bright and faint SMGs is likely to fail, even by flux densities of mJy (see also Lacey et al. 2004).
A second important point to draw from Fig. 4.4 concerns the relative evolution of the UV- and submm-selected populations. Our redshifts show that SMGs are coeval and energetically comparable in a volume-average sense with the population of UV-bright, star-forming galaxies detected at –3 (Steidel et al. 1999). However, the SMGs with 5 mJy and UV-selected galaxies (which have a median 850-m flux of mJy, Adelberger & Steidel 2000; Reddy & Steidel 2004) clearly don’t evolve in the same manner. SMGs appear to evolve more strongly than the UV-selected population out to (C03) and indeed seem to behave in a manner very similar to luminous Quasars and X-ray selected AGN, whose luminosity density peaks at (Boyle et al. 2000; Croom et al. 2004; Silvermann et al. 2004). As Fig. 4.4 makes clear, this is in stark contrast with the individually-less luminous, UV-selected galaxies whose comoving luminosity density is approximately constant out to at least (Lehnert et al. 2003; Giavalisco et al. 2004). This suggests that the properties of the bright submm population is more closely linked with the formation and evolution of the galaxies or galactic halos which host QSOs, than the more typical, modestly star-forming galaxies identified from their restframe UV emission. Nevertheless, there is likely to be an intermediate luminosity regime where the UV- and submm-selected populations overlap significantly, and therefore where their evolution becomes similar – we propose that this likely occurs at sub-mJy levels.
4.5. Contributions to the FIR background
Using our the long-wavelength SEDs which we fitted to the submm/radio observations of the SMGs we can calculate their contribution to the extragalactic background at other wavelengths in the far-infrared. The measured FIR background (FIRB), and the contribution per unit wavelength from our SMGs with redshifts and well-fitted SEDs are shown in Fig. 4.5. At 850m this is simply the sum of the flux measurements for our SMGs normalized by the effective survey area (assuming a radio-detected fraction of 65%). At all shorter wavelengths, the curve represents the sum of the best-fit SEDs, examples of which were shown in Fig. 4.1. We see that the SMG sample we are studying contributes around 20% of the background at m and a diminishing fraction at shorter wavelengths.
To provide a simple baseline comparison we also illustrate the contributions to the FIRB if all of the SMG’s lie at (the median redshift of our model-corrected spectroscopic sample) and have SEDs matching that of Arp 220, again normalized to our total 850m flux. Note that the actual peak of the background due to the SMGs is significantly broadened by the dispersion in their redshifts and dust temperature, compared to a single 45 K-like Arp 220 SED at .
The contribution of SMGs to the peak of the FIRB varies on a galaxy by galaxy basis by a factor of . Galaxies with hotter characteristic dust temperatures contribute more, but because they typically lie at higher redshifts in our submm-selected sample, their contribution is scaled down. Splitting our sample into high and low redshift bins, we assess the relative contribution to the emission around the peak of the FIRB at m as a function of redshift. SMGs at contribute three times less to the FIRB than SMGs at . This implies that the increase in characteristic with redshift is not fast enough to counteract the diminuation of restframe 200m flux from the K-correction. If we include plausibly-identified SMGs without radio detections (Ivison et al. 2005), which are predicted to have colder dust temperatures, we find that their contribution to the FIRB is much smaller (by a factor 5) compared with the warmer radio-SMGs. Moreover, the radio-unidentified SMGs are spread throughout both redshift bins, they do not substantially affect the relative FIRB contributions as a function of redshift.
We can also estimate the contribution of the bulk of the submm galaxy population to the FIRB by applying a correction factor (2.9) to our composite SMG template to include galaxies down to 1 mJy, comprising 60% of the Fixsen et al. (1998) 850m background. This extrapolation suggests that galaxies selected at 850-m are significant contributors (responsible for % of the total emission) to the FIRB at wavelengths of m, assuming that modest extrapolations up the luminosity function are composed of galaxies similar in characteristics to those SMGs in our sample. However, the 1 mJy SMG population probably contribute no more than 6% of the emission at the peak of the FIRB at m, which is dominated by lower-redshift and/or hotter populations. For sources fainter than 1 mJy, there is likely to be a wider distribution of redshifts, and predictions based on our bright submm sample are much more uncertain.

The procedure we used in the calculation above assumes that submm sources with flux densities fainter than our sample have a similar redshift distribution and range of SEDs/dust temperatures. There is some evidence for this down to 1 mJy from cluster lensed SMGs (e.g., Smail et al. 2002; Borys et al. 2004; Kneib et al. 2004). We discussed in the previous subsection why this may not be a good approximation fainter than 1 mJy: UV-selected galaxies appear to have a very different evolution history from SMGs, and the UV galaxies are likely to contribute a substantial fraction of the submm background at 0.1 mJy flux densities. The corrected distribution should therefore be assessed critically. Specifically, if fainter sources begin to evolve more like UV-selected galaxies, with less of a peak at , then these higher redshift and less luminous sources will have a progressively smaller contribution to the FIRB near 200m.
4.6. Mid-/far-IR Spitzer fluxes and spectral diagnostics
The Spitzer Space Telescope marks a new era in IR astronomy, pushing significantly deeper than past space IR missions. A pressing question is therefore the overlap of the SMGs with the faint Spitzer population. By assuming the locally-calibrated SEDs of Dale & Helou (2002), we demonstrate that our observed factor of two range in submm flux translates into greater than two orders of magnitude in 24m flux, with the faintest galaxies having predicted fluxes of only 10Jy (see Fig. 4.1). Prior to obtaining redshifts for SMGs, it was impossible to realistically assess the required sensitivities for IR follow-up with Spitzer. Several authors have already suggested that the detection rate of SMGs by Spitzer at 3.6m through 24m is very high (Frayer et al. 2004; Ivison et al. 2004; Egami et al. 2004), with flux densities roughly in accord with our predictions in Fig. 4.1.
Mid-IR spectral surveys with ISO (Lutz et al. 1999; Tran et al. 2001) demonstrated that this wavelength regime is a powerful tool to classify the energetics of galaxies in an independent manner from conventional optical classification techniques (e.g., Swinbank et al. 2004). The main advantage of the mid-IR is that it probes the physical conditions in the more obscured regions closer in to the optically-thick, dust-enshrouded nuclei and molecular cloud regions of the galaxies where the bulk of the FIR emission arises (Sturm et al. 2000, 2002; Verma et al. 2003; Spoon et al. 2004). Key emission features include those from polycyclic aromatic hydrocarbon (PAH) at 6–18 m, high-excitation Ne emission lines and the broad silicate absorption feature. It has been suggested that some of these features are diagnostic of the relative balance of dust heating by AGN and star formation.
Spitzer spectroscopy of SMGs to determine mid-IR properties will be important for disentangling the physical conditions in the most active regions within these highly-obscured galaxies. The Dale & Helou (2002) spectral templates include PAH features, Ne emission and the broad silicate absorption feature, all estimated as a function of luminosity and temperature based on local correlations. Our template fits to the SMGs with redshifts therefore allow predictions of their mid-IR spectral properties (Figs. 4.1 & 4.5), indicating that low-resolution Spitzer spectroscopy should yield line detections for the majority of the SMGs in our sample. Indeed, stacking Spitzer-IRS spectra for similar classes of SMGs should yield sufficient signal-to-noise to study the shape of the PAH feature and probe the chemical evolution of silicates (e.g., Honda et al. 2004).
However, it is possible that the physical properties in high- ULIRGs (such as the gas fraction, metallicity, star-formation extent and star-formation rate) may differ from these local systems. For example, a comparison of the UV and long-wavelength morphologies of SMGs indicates that their star formation is more spatially extended than in the local population of ULIRGs (Chapman et al. 2004b), likely resulting in differences in the physical conditions experienced by dust grains (Lu et al. 2003). Mid-infrared spectroscopy of SMGs may be able to test this claim and provide new insights into the physics of SMGs.
4.7. The duty-cycle of SMGs
Having discussed the observational and inferred properties of our SMG sample, we wish to finish by discussing their evolutionary connections to other populations at high and low redshifts. In order to connect the SMG population to a likely population of descendents, we must estimate what the duty-cycle for SMGs might be. Our greatest uncertainty in this calculation is the duration of the submm-luminous event. Smail et al. (2003a, 2004a) have estimated the past duration of the starburst events using both fits to the UV spectra with the Starburst99 synthetic templates (Leitherer et al. 1999), and simple model fits to the optical and near-IR photometry. They conclude that the starbursts have been ongoing for –100 Myr. Using the gas masses from the CO observations compiled for a small sample of SMGs by Neri et al. (2003) we can infer that there is enough molecular gas present in a typical SMG to continue the starbursts at their present rate for at the most another Myr, and perhaps considerably shorter. Thus the total duration of these submm-luminous events might therefore be 100 Myr.
The length of the starburst is likely to be regulated by the enormous superwind outflows that are expected to be driven in SMGs; Greve et al. (2005) and Smail et al. (2003, 2005) have demonstrated offsets between Ly and molecular CO or H as large as 1000 km/s, implying outflows of large velocity. The SMGs are the most luminous galaxies in the Universe, and as such are expected to drive some of the largest superwinds, with if the mass ejected is proportional to the star formation rate (Heckman et al. 2001), would produce typical outflows of 1000 M⊙ yr-1. Simple scaling arguments suggest that the kinetic energy put into SMG winds (and hence the local environment) would be times that of LBGs, which are already known to show evidence for strong outflows (Adelberger et al. 2003). Given the potential power of this feedback mechanism we must treat our estimated submm-luminous timescale as an upper limit, since the outflows and associated turbulence could easily turn the starburst off in a shorter time period.
The radio-identified SMG redshift distribution was well-fit by a Gaussian with a central redshift of 2.2 and (accounting for incompleteness in the spectroscopic desert). Modeling of the full SMG redshift distribution suggests , although this is clearly dependent on the model adopted. Focusing just on the radio-identified SMGs, these populate a period of about 1 Gyr in length. Dividing the submm redshift distribution by the submm-luminous timescale of 100 Myr suggests a duty-cycle of 10. In other words, there is an underlying population of galaxies ten times as numerous as the SMGs that correspond to the immediate progenitors and descendents of the SMG phenomenon. This parent population would have a volume density at –3 of Mpc-3, and would be expected to have the similar clustering properties to the SMG events themselves (r Mpc – Blain et al. 2004b). One possible identification of the descendents of the SMG population comes from the discovery of luminous, near-infrared galaxies at with apparent stellar ages of 1–2.5 Gyrs, stellar masses of 1– M⊙ and a space density a factor of several times higher than SMGs (van Dokkum et al. 2003, 2004; Franx et al. 2003; Glazebrook et al. 2004).
To understand the evolutionary connections of the SMGs with other galaxy populations at similar redshifts, it is crucial to measure the SMG clustering properties. Surprisingly, even with our small sample, we are already in a strong position to characterize the clustering. We notice in Table 3 that SMGs often come in pairs or larger associations to about 1200 km s-1, with approximately one in five SMGs in our sample lying in such associations. This can be quantified into an estimate of the clustering strength (Blain et al. 2004b), suggesting a correlation amplitude comparable to low-redshift EROs (e.g., Daddi et al. 2001; McCarthy et al. 2001). The SMG associations seem to point to global overdensities in the galaxy populations, typified by the protocluster in the SSA22 field (Steidel et al. 1998) where 3 SMGs lie at . The five SMGs at in the HDF field suggest that we have likely identified another overdensity of a similar scale to the SSA22 protocluster.
The clustering scale of 2dF QSOs is similar to that of SMGs within errors (QSOs: Mpc – Croom et al. 2002, SMGs: Mpc – Blain et al. 2004b), and as we have noted repeatedly in this study, the redshift distributions of both populations are very similar. However, the volume densities of bright QSOs and SMGs do not match; the SMGs outnumber QSOs by a factor of –10 (Chapman et al. 2003b). The SMGs and QSOs can be viewed as different phases of the same population if the timescales compensate for this discrepancy. Martini & Weinberg (2001) suggest that QSOs endure for 40 Myr, requiring that SMGs are active for 200–400 Myr, not too discrepant from our adopted SMG timescale of 100 Myr estimated above. Another possibility is that the QSO may often represent a phase in the active lifetime of a subset of SMGs, dependent on environmental conditions that facilitate the funneling of material from the extended SMG starburst to the growing central engine.
It is worth seriously considering the possibility of an inter-relation between the SMG and QSO phenomena. The local Magorrian relation (Magorrian et al. 1998) between black hole mass and stellar bulge mass suggests that super-massive black holes (SMBHs) must be growing at a rate roughly proportional to the stars. The SMGs appear to be prodigiously forming stars, with the modest X-ray luminosities of SMGs suggesting either low rates of accretion onto super-massive black holes (SMBHs) and/or moderate SMBH masses (Alexander et al. 2005). Both of these possibilities suggest that substantial SMBH growth is needed to evolve onto a Magorrian relation. A logical conclusion is that the SMGs are indeed an early phase in the evolution of a massive galaxy, forming many stars quickly over 10 kpc spatial scales, as shown by the extended radio emission tracing UV structures (Chapman et al. 2004b). As the merger proceeds, the growing SMBH will begin to accrete material more quickly as instabilities drive material to more concentrated configurations. The SMBH thus grows ever more rapidly, on a timescale which is delayed from that of the initial starburst (see also Archibald et al. 2002), eventually blowing channels through the dust and becoming visible as a QSO. Indeed, Page et al. (2001) and Stevens et al. (2004) have measured significant submm emission from X-ray self-absorbed QSOs, suggesting that an intermediate stage between SMGs and QSOs is being directly observed. This is also consistent with the 3/80 QSO detection rate (4%) for our unbiased SMG sample, if it is assumed that all submm-detected QSOs are X-ray absorbed (Stevens et al. 2004). Under this scenario, the proportion of X-ray absorbed QSOs is 1/6 of the entire QSO population (Stevens et al. 2004) and hence the ratio of QSO-to-SMG lifetimes should be 18/80, or 0.23, consistent with the volume densities described above.
Most likely, the relationship between SMGs and other galaxy populations spans a range of scenarios and evolutionary histories, and more comprehensive models will be required to understand and further test the evolution of SMGs.
5. Conclusions
We have assembled a detailed account of the properties of the radio-identified SMGs. Spectroscopic redshifts have been obtained for 73 radio-SMGs from deep optical spectroscopy of 98 targets attempted, for a success rate of 74%. The redshift distribution of SMGs is now well constrained – showing a pronounced peak at for our radio-selected sample and a predicted median of for a purely submm-flux-limited sample, similar in form to distribution seen for radio-, optical- and X-ray-selected QSOs. We also demonstrate that the simple radio/submm redshift estimator, which has been used extensively in the literature to attempt constraint the redshift distribution of SMGs, is not reliable for individual SMG redshifts (). For the SMGs which are detectable with good signal-to-noise () in deep ground-based images, photometric redshifts in the bands appear to provide a more accurate constraint on the true redshifts of individual SMGs. We find that the radio-SMGs for which we failed to obtain robust spectroscopic redshifts have similar / colors to those with robust redshifts, and conclude that the entire radio-SMG population is likely to have a similar distribution to the spectroscopic redshift distribution presented here. We have also discuss the likely redshifts of SMGs without radio identifications to fill in more details of the entire SMG population brighter than 5 mJy at 850 m.
We measure dust temperatures and bolometric luminosities for SMGs by exploiting our precisely-known redshifts and assuming the local FIR–radio correlation. The SED variation in our SMGs likely arises from a dispersion in dust temperature, but could also arise from a broader scatter in the FIR–radio correlation than observed locally. If the SED variation were caused entirely by variations in the FIR–radio correlation then the FIR–radio scatter would have to increase from the 0.2 dex observed locally to dex. We view this as unlikely and so attribute most of the range in SED properties for the SMGs as down to differences in characteristic dust temperature.
We construct a bolometric luminosity function and compare to local IRAS galaxies as well as estimates for UV-selected galaxies at –3. We predict the expected FIR luminosities of the SMG population based on their UV luminosities and continuum slope, using the standard prescription for this conversion for UV-selected populations. We find that the true bolometric luminosity of an SMG is typically underestimated by when extrapolated from their restframe UV properties. We therefore conclude that observations at radio/submm wavelengths are essential to distinguish which –3 galaxies have the huge luminosities characteristic of SMGs.
We assess the SFRD evolution of SMGs, both from our observed 5 mJy SMG sample and from a modest extrapolation of our sample properties down to 1 mJy. Our results highlight the very different evolution of SMGs over UV-selected galaxies (and noting the close similarity in evolution between SMGs and QSOs). This suggests that the properties of the bright submm population is more closely linked with the formation and evolution of the galaxies or galactic halos which host QSOs, than the more typical, modestly star-forming galaxies identified from their restframe UV emission. We emphasize that UV-measurements of the SMGs do not typically reveal the enormous bolometric luminosities present, and the SMGs and dust-corrected UV-selected galaxies in the SFRD diagram should be summed together to obtain a complete census of the SFRD evolution in the Universe.
The SMG sample we are studying contributes around 20% of the background at m and a diminishing fraction at shorter wavelengths. The contribution of SMGs to the FIRB at m can be predicted by fitting dusty SED templates to the radio and submm fluxes at the measured redshifts. This prediction is considerably less than expected from assuming an Arp 220-like SED, since the SMGs have cooler characteristic dust temperatures than Arp 220. The Spitzer Space Telescope is likely to provide important diagnostics of the highly obscured central regions of the SMGs through mid-IR imaging and spectroscopy.
We are rapidly approaching the point of being able to put all the evidence about properties of SMGs together. The spectroscopic redshifts allow us to study aspects of the SMG population which cannot be addressed using photometric redshift estimators. Astrophysical properties of the SMGs are diagnosed through the restframe UV and optical spectra themselves, probing for example the excitation conditions, metallicities, and wind outflows (Swinbank et al. 2004; I. Smail, in preparation). The clustering of the SMGs is clearly a pressing question, and surprisingly, even with our small sample we are already in a strong position to characterize the clustering through the redshift distribution, finding a correlation length r Mpc (Blain et al. 2004b). The impact of SMGs on their environments and the inter-galactic medium can be studied directly using background QSOs in the same fields (S. Chapman, in preparation). With precise redshifts, X-ray spectral analysis in deep Chandra exposures is possible through the stacking of sub-groups of SMGs with similar X-ray absorption properties, yielding significant FeK emission line detections and characterization of the X-ray spectral shape (D. Alexander, in preparation).
We conclude that with the availability of precise redshifts for large samples of FIR luminous galaxies, these populations can now be used to trace the evolution of the most luminous galaxies in the Universe. A focus of our future work will be to identify the influence of this population on their environments.
References
- (1) Adelberger, K., Steidel, C., 2000, ApJ, 544, 218
- (2)
- (3) Alexander, D., Smail, I., Bauer, F., Chapman, S., Blain, A., Ivison, R., 2005, Nature, submitted
- (4)
- (5) Alexander, D., Vignali, C., Bauer, F. E., Brandt, W. N., Hornschemeier, A. E., Garmire, G. P., Schneider, D. P./ 2002, AJ, 123, 1149
- (6)
- (7) Almaini, O., et al., 2003, MNRAS, 338, 303
- (8)
- (9) Archibald, E., et al., 2002, MNRAS, 336, 353
- (10)
- (11) Aretxaga, I., et al., 2003, MNRAS, 342, 759
- (12) Aretxaga, I., et al., 2004, MNRAS, in press
- (13)
- (14) Avni, Y., Bachall, J. N., 1980, ApJ, 235, 694
- (15)
- (16) Barger, A. J., et al. 2003, AJ, 126, 632
- (17) Barger, A. J., et al. 2002, AJ, 124, 1839
- (18) Barger, A. J., Cowie, L. L., Mushotzky, R. F., & Richards, E. A. 2001a, AJ, 121, 662
- (19)
- (20) Barger, A. J., Cowie, L. L., Steffen, A. T., Hornschemeier, A. E.,Brandt, W. N., & Garmire, G. P. 2001b, ApJ, 560, L23
- (21)
- (22) Barger, A. J., Cowie, L. L., & Richards, E. A. 2000, AJ, 119, 2092
- (23)
- (24) Barger, A. J., Cowie, L. L., & Sanders, D. B. 1999a, ApJ, 518, L5
- (25)
- (26) Barger, A. J., Cowie, L.L., Smail, I., Ivison, R. J.,Blain, A. W., & Kneib, J.-P. 1999b, AJ, 117, 2656
- (27)
- (28) Barger, A. J., et al. 1998, Nature, 394, 248
- (29)
- (30) Baugh, C. M., Lacey, C. G., Frenk, C. S., Granato, G. L., Silva, L., Bressan, A., Benson, A. J., Cole, S., MNRAS, submitted (astro-ph/0406069)
- (31)
- (32) Bertoldi, F., et al., 2000, A&A, 360, 92
- (33)
- (34) Blain, A., Chapman, S., Smail, I., Ivison, R. 2004a, ApJ, in press, astro-ph/0405035
- (35)
- (36) Blain, A., Chapman, S., Smail, I., Ivison, R. 2004b, ApJ, in press, astro-ph/0404438
- (37)
- (38) Blain, A., Barnard, V., Chapman, S. 2003, MNRAS, 338, 733
- (39)
- (40) Blain, A., et al. 2002, Phys. Rep., 369, 111
- (41)
- (42) Blain, A. 1999, MNRAS, 309, 955
- (43)
- (44) Blain, A. W., Smail, I., Ivison, R. J., & Kneib, J.-P. 1999a,MNRAS, 302, 632
- (45)
- (46) Blain, A., et al., 1999b, MNRAS, 309, 715
- (47)
- (48) Bolzonella, M., Miralles, J.-M., Pello, R., 2000, A&A, 363, 476
- (49)
- (50) Boyle, B., et al., 2000, MNRAS, 317, 1014
- (51)
- (52) Borys, C., Chapman, S. C., Halpern, M., & Scott, D. 2003, MNRAS, 344, 385
- (53)
- (54) Borys, C., Chapman, S. C., et al. 2004, MNRAS, in press
- (55)
- (56) Capak P., et al., AJ, 2004, AJ, 127, 180
- (57)
- (58) Carilli, C. L., et al., 2001, AJ, 122, 1679
- (59)
- (60) Carilli, C. L. & Yun, M. 2000, ApJ, 539, 1024
- (61) Carilli, C. L. & Yun, M. 1999, ApJ, 513, 13L (CY)
- (62)
- (63) Chapman, S. C., et al., 2000, MNRAS, 319, 318
- (64)
- (65) Chapman, S. C., Richards, E. A., Lewis, G. F.,Wilson, G., & Barger, A. J. 2001a, ApJ, 551, L9
- (66)
- (67) Chapman, S. C., et al. 2001b, Deep millimeter surveys : implications for galaxy formation and evolution, Proceedings of the UMass/INAOE conference, University of Massachusetts, Amherst, MA, USA, 19-21 June 2000. Published by Singapore: World Scientific Publishing, 2001. xi, 207 p. Edited by James D. Lowenthal, and David H. Hughes.
- (68)
- (69) Chapman, S. C., Scott, D., Borys, C., Fahlman, G., 2002a, MNRAS, 330, 92
- (70)
- (71) Chapman, S. C., Lewis, G. F., Scott, D., Borys, C., Richards, E. A. 2002b, ApJ, 570, 557
- (72)
- (73) Chapman S. C., Smail I., Ivison R., Blain A., 2002c, MNRAS, 335, 17
- (74)
- (75) Chapman, S. C., Smail, I., Ivison, R., Helou, G., Dale, D., Lagache, G. 2002d, ApJ, 573, 66
- (76)
- (77) Chapman S. C., et al. 2003a, ApJ, 585, 57
- (78)
- (79) Chapman S. C., Blain A., Ivison R., Smail I., 2003b, Nature, 422, 695 (C03)
- (80)
- (81) Chapman, S. C., Helou, G., Lewis, G., Dale, D. 2003c, ApJ, 588, 186
- (82)
- (83) Chapman, S. C., et al., 2004a, ApJ, in press
- (84) Chapman, S. C., Smail, I., Windhorst, R., Muxlow, T., Ivison, R., 2004b, ApJ, in press
- (85)
- (86) Chary, R., Elbaz, D., 2001, ApJ, 556, 562
- (87)
- (88) Condon, J. J. 1992, ARA&A, 30, 575
- (89)
- (90) Connolly, A., et al., 1997, ApJ, 486, L11
- (91)
- (92) Cowie, L. L., Barger, A. J., Fomalont, E., Capak, P., 2004, ApJ, 603, 69L
- (93)
- (94) Cowie, L. L., Barger, A. J., Kneib, J.-P. 2002, AJ, 123, 2197
- (95)
- (96) Croom, S.M., Boyle, B.J., Loaring, N., Miller, L., Outram, P.J., Shanks, T., Smith, R.J., 2002, MNRAS, 335, 459
- (97)
- (98) Croom, S.M., Smith, R.J., Boyle, B.J., Shanks, T., Miller, L., Outram, P.J., Loaring, N.S. 2004, MNRAS, 349, 1397 Silverman, J.D. et al., 2004, ApJ, submitted
- (99)
- (100) Cuillandre, J.-C., Luppino, G., Starr, B., Isani, S.in “Astronomical Telescopes and Instrumentation”,2000, Proc. SPIE, 4008, 1010
- (101)
- (102) Dale, D., et al. 2001, ApJ, 562, 142
- (103)
- (104) Dale, D., Helou, G., 2002, ApJ, 576, 159
- (105)
- (106) Dannerbauer, H., Lehnert, M., Lutz, D., Tacconi, L., Bertoldi, F., Carilli, C., Genzel, R., Menten, K., 2002, ApJ, 573, 473
- (107)
- (108) Dannerbauer, H., et al., 2004, ApJ, 606, 664
- (109)
- (110) Dunlop, J., et al., 2004, MNRAS, 350, 769
- (111)
- (112) Dunne, L., et al. 2002, MNRAS, 327, 697
- (113) Dunne, L., Clements, D., Eales S., 2000, MNRAS, 319, 813
- (114)
- (115) Eales, S., Bertoldi, F., Ivison, R., Carilli, C., Dunne, L., Owen, F. 2003, MNRAS, 344, 169
- (116)
- (117) Eales, S., Lilly, S., Webb, T., Dunne, L., Gear, W.,Clements, D., & Yun, M. 2000, AJ, 120, 2244
- (118)
- (119) Eales, S., et al., 1999, ApJ, 515, 518
- (120)
- (121) Egami, E., et al., 2004, ApJ, in press
- (122)
- (123) Fixsen, D. J., Dwek, E., Mather, J. C., Bennett, C. L., Shafer, R. A. 1998, ApJ, 508, 123
- (124)
- (125) Flores, H., et al., 1999, ApJ, 517, 148
- (126)
- (127) Fomalont, E., et al., 2004, in preparation
- (128)
- (129) Franx, M., et al., 2003, ApJL, 587, 79
- (130)
- (131) Frayer, D., et al., 2004, ApJ, in press
- (132) Frayer, D., et al., 2003, AJ, 126, 73
- (133) Frayer, D., et al., 1999, ApJ, 514, 13L
- (134) Frayer, D., et al., 1998, ApJ, 560, 7
- (135)
- (136) Garrett, M., 2002, A&A, 384, 19
- (137)
- (138) Gear, W., et al., 2000, MNRAS, 316, 51L
- (139) Glazebrook, K., et al., 2004, Nature, 430, 181
- (140)
- (141) Honda, M., et al., 2004, ApJL, 610, 49
- (142)
- (143) Tacconi, L., et al., 2005, ApJ, submitted
- (144)
- (145) Greve, T., et al., 2004, MNRAS, in press, astro-ph/0405361
- (146)
- (147) Greve, T., et al., 2005, MNRAS, submitted
- (148)
- (149) Giavalisco, M., Dickinson, M., Ferguson, H. C., Ravindranath, A., Kretchmer, C., Moustakas, L. A., et al., 2004, ApJL, 600, L103
- (150)
- (151) Haarsma, D., Partridge, R. B., Richards, E. A. & Windhorst, R. A. 2000, ApJ, 544, 641
- (152)
- (153) Helou, G., et al. 1985, ApJ 440, 35
- (154)
- (155) Holland, W. S., et al. 1999, MNRAS, 303, 659
- (156)
- (157) Hughes, D. H., et al. 2002, MNRAS, 335, 871
- (158)
- (159) Hughes, D. H., Serjeant, S., Dunlop, J., Mann, R. G., Ivison, R., et al., 1998, Nature, 394, 241
- (160)
- (161) Hunt, M., et al., 2004, ApJ, 605, 625
- (162)
- (163) Ivison, R. J., et al., 2004, ApJ, in press
- (164) Ivison, R. J., et al., 2002, MNRAS, 337, 1
- (165) Ivison, R. J., et al., 2001, ApJ, 561, 45L
- (166) Ivison, R. J., et al., 2000, MNRAS, 315, 209
- (167) Ivison, R. J., et al., 1998, MNRAS, 298, 583
- (168)
- (169) Ivison, R. J., Smail, I., Le Borgne, J.-F., Blain, A. W., Kneib, J.-P., Bézecourt, J., Kerr, T.H.,& Davies, J.K. 1998, MNRAS, 298, 583
- (170)
- (171) Jenness, T., Lightfoot, J. F., Holland, W. S., 1998, Proc. SPIE Vol. 3357, p. 548-558, Advanced Technology MMW, Radio, and Terahertz Telescopes, Thomas G. Phillips; Ed.
- (172)
- (173) Kennicutt, R. C., 1998, ARA&A, 36, 189
- (174)
- (175) Komiyama, Y., et al., 2003, SPIE, 4841, 152
- (176)
- (177) Kovacs, A., et al., 2004, ApJ, in preparation
- (178)
- (179) Kneib, J.-P., et al., 2004, MNRAS, 349, 1211
- (180)
- (181) Knudsen, K. K., 2004, PhD Thesis, U. Leiden
- (182)
- (183) Kreysa, E., Gemund, H.-P., Raccanelli, A., Reichertz, L. A., Siringo, G., 2002, EXPERIMENTAL COSMOLOGY AT MILLIMETRE WAVELENGTHS: 2K1BC Workshop. Breuil-Cervinia, Valle d’Aosta, Italy, 9-13 July, 2001. Edited by Marco De Petri and Massimo Gervasi. American Institute of Physics, 2002. AIP Conference Proceedings, Volume 616, pp. 262-269
- (184)
- (185) Lacey, C., et al., 2004, in preparation
- (186)
- (187) Ledlow, M., Smail, I., Owen, F., Keel, W., Ivison, R., Morrison, G., 2002, ApJ, 577, 79L
- (188)
- (189) Lehnert M., Bremer, M., 2003, ApJ, 593, 630L
- (190)
- (191) Lewis, G., Chapman, S., Helou, G., 2004, ApJ, submitted
- (192) Lilly, S., et al., 1999, ApJ, 518, 641
- (193)
- (194) Lutz, D., et al., 2001, A&A, 378, 70L
- (195) Lutz, D., et al., 1999, ApSS, 266, 85
- (196)
- (197) Madau, P., 1995, ApJ, 441, 18
- (198) Madau, P., et al., 1996, MNRAS, 283, 1388
- (199)
- (200) Magorrian, J., et al., 1998, AJ, 115, 2285
- (201) Martini, P., Weinberg, D., 2001, ApJ, 547, 12
- (202)
- (203) Meurer, G., et al., 1997, AJ, 114, 54
- (204) Muller, G., Reed, R., Armandroff, T., Boroson, T., Jacoby, G., 1998, SPIE, 3355, 577
- (205)
- (206) Neri, R., et al., 2003, ApJ, 598, 39L
- (207)
- (208) Neufeld, D., 1991, ApJ, 370, 85L
- (209)
- (210) Oke, J.B., et al. 1995, PASP, 107, 375
- (211)
- (212) Omont, A., et al., 2003, A&A, 398, 857
- (213) Omont, A., et al., 2001, A&A, 374, 371
- (214)
- (215) Page, M., Stevens, J.A., Mittaz, J.P.D., Carrera, F.J., 2001, Science, 294, 2516
- (216)
- (217) Peacock, J., et al., 2000, MNRAS, 318, 535
- (218)
- (219) Pettini, M., et al., 2001, ApJ, 554, 981
- (220)
- (221) Reddy, N., Steidel, C., 2004, ApJ, 603, 13L
- (222)
- (223) Richards, E. A. 2000, ApJ, 533, 611
- (224)
- (225) Efstathiou, A., Rowan-Robinson, M., 2003, MNRAS, 343, 322
- (226)
- (227) Scott, S., et al. 2002, MNRAS, 331, 817
- (228)
- (229) Serjeant, S., et al., 2003, MNRAS, 344, 887
- (230)
- (231) Shapley, A., et al., 2003, ApJ, 588, 65
- (232)
- (233) Shaver, P., et al., 1998, APS Conf series 156, Highly Redshifted Radio Lines, ed. C.Carilli, S.Radford, K. Menten, G. Langston, (San Francisco: ASP163)
- (234)
- (235) Simcoe, R., et al., 2000, BAAS, 196, 5209
- (236) Silverman, J.D., et al., 2004, ApJ, submitted, astro-ph/0406330
- (237)
- (238) Simpson, C., et al., 2004, MNRAS, in press
- (239)
- (240) Smail, I., Chapman, S., Blain, A., Ivison, R., 2004a, ApJ, submitted
- (241) Smail, I., Chapman, S., Blain, A., Ivison, R., 2004b, ApJ, in preparation
- (242)
- (243) Smail, I., et al, 2003a, MNRAS, 342, 1185
- (244) Smail, I., et al, 2003b, ApJ, 583, 551
- (245)
- (246) Smail, I., Ivison, R. J., Blain, A. W., Kneib, J.-P., 2002, MNRAS, 331, 495
- (247)
- (248) Smail, I., Ivison, R. J., Owen, F. N., Blain, A. W., & Kneib, J.-P. 2000, ApJ, 528, 612
- (249)
- (250) Smail, I., et al., 1999, MNRAS, 308, 1061
- (251)
- (252) Smail, I., Ivison, R., Blain A., 1997, ApJ, 490, L5
- (253)
- (254) Spoon, H., et al., 2004, A&A, 414, 873
- (255)
- (256) Steidel, C., et al. 2004, ApJ, 604, 534
- (257) Steidel, C., et al. 2003, ApJ, 592, 728
- (258) Steidel, C., et al. 2002, ApJ, 576, 653
- (259) Steidel, C., et al. 1999, ApJ, 519, 1
- (260)
- (261) Stevens, J., et al., 2004, MNRAS, submitted
- (262)
- (263) Sturm, et al., 2000, A&A, 358, 481
- (264)
- (265) Sturm, et al., 2002, A&A, 393, 821
- (266)
- (267) Swinbank, M., Smail, I., Chapman, S., Blain, A., Ivison, R., Keel, B., 2004, ApJ, submitted
- (268)
- (269) Tran, et al., 2001, ApJ, 552, 527
- (270)
- (271) Tulloch, S., 2000, INGN, 2, 26
- (272)
- (273) Verma, et al., 2003, A&A, 403, 829
- (274)
- (275) Wang, W., Cowie, L., Barger, A., 2004, AJ, astro-ph/0406261
- (276)
- (277) Webb, T. M. A., Eales, S. A., Lilly, S. J., Clements, D. L., Dunne, L.,Gear, W. K., Flores, H., & Yun, M., 2003a, ApJ, 587, 41
- (278)
- (279) Webb, T. M. A., et al., 2003b, ApJ, 582, 6
- (280)
- (281) Wiklind, T., 2003, ApJ, 588, 736
- (282)
- (283) Wolfe, A., et al., 2003a, ApJ, 593, 235
- (284) Wolfe, A., et al., 2003b, ApJ, 593, 215
- (285)
- (286) Yan, L., et al., 1999, ApJ, 519, 47L
- (287)
- (288) Yun, M., Carilli, C., 2002, ApJ, 568, 88
- (289)
- (290) Yun, M., Reddy, N., Condon, J. 2001, ApJ, 554, 803
- (291)
| name | radio center | radio deptha | N | N | N | N | optical data commentse |
|---|---|---|---|---|---|---|---|
| (J2000) | (Jy) | map | phot | ||||
| CFRS-03 | 03:02:40.9 00:09:08 | 10 | 9 | 0 | 9 | 6 | cfh12k, LRIS |
| Lockman | 10:52:00.1 57:18:10 | 5 | 10 | 0 | 8 | 4 | MOSAIC, cfh12k, SUPRIME |
| HDF-N | 12:37:07.2 62:14:02 | 8 | 27 | 11 | 31 | 24 | MOSAIC, SUPRIME |
| SSA-13 | 13:12:16.5 42:41:21 | 4 | 9 | 8 | 16 | 9 | MOSAIC, SUPRIME |
| CFRS-14 | 14:17:49.4 52:30:23 | 14 | 8 | 1 | 9 | 8 | cosmic, WHT, cfh12k |
| ELAIS-N2 | 16:36:50.0 40:57:35 | 15 | 8 | 3 | 10 | 10 | WHT, LFC |
| SSA-22 | 22:15:15.1 00:13:55 | 8 | 7 | 8 | 15 | 11 | cfh12k, LFC, cosmic |
1 radio depth at phase center.
number of radio identified submm sources above 3 divided into
SCUBA mapping and SCUBA photometry observations. Photometry observations
targeted the radio source position.
number of spectra attempted.
number of successful redshifts.
optical data used in the identifications:
CFHT/CFH12K (Cuillandre et al. 2000),
KPNO4m/MOSAIC (Muller et al. 1998),
Subaru/SUPRIME (Komiyama et al. 2003),
WHT/PFC (Tulloch 2000),
Palomar200inch-LFC/cosmic (Simcoe et al. 2000),
| Date | Field RA | nights clear | Configurations |
|---|---|---|---|
| ESI | |||
| 2001 Jul 16 | ELAIS-N2/SSA22 | 1 | Echelle |
| LRIS | |||
| 2002 Mar 18 – Mar 21 | Lockman/HDF/SSA13/ELAIS-N2 | 2 | B400/D560/R600 |
| 2002 Sep 30 – Oct 01 | SSA22/CFRS03 | 2 | B400/Mirror |
| 2002 Dec 26 – Dec 27 | CFRS03/Lockman/HDF | 1 | B400/D560/R600 |
| 2003 Mar 28 – Mar 29 | Lockman/HDF/Westphal-14 | 0.5 | B400/D680/R400 |
| 2003 May 22 – May 24 | Lockman/HDF/Westphal-14/ELAIS-N2 | 2 | B400/D560/R600 |
| 2003 Aug 22 – Aug 23 | ELAIS-N2/SSA22 | 2 | B400/D560/R600 |
| 2004 Feb 14 – Feb 15 | Lockman/HDF/SSA13 | 2 | B400/D560/R600 |
| ID | S1.4GHz | S850μm | z | Lbol | comment | |||
|---|---|---|---|---|---|---|---|---|
| (Jy) | (mag) | (mag) | (mJy) | (L⊙) | (K) | |||
| SMM J030226.17+000624.5 | 481.59 | 19.1 | 17.8 | 7.91.6 | 0.080 | 0.03 | 11.4 | ; probable lens |
| SMM J030227.73+000653.5 | 2179 | 23.8 | 22.9 | 4.41.3 | 1.408 | 27.8 | 56.4 | ; Ly, abs, H (SB) |
| SMM J030231.81+001031.3 | 45.19 | 26.4 | 25.1 | 5.01.5 | 1.316 | 1.3 | 25.6 | ; OII (SB) |
| SMM J030236.15+000817.1 | 42.19.1 | 26.4 | 26.1 | 3.40.6 | 2.435 | 6.7 | 41.3 | ; H, NII (SB) |
| SMM J030238.62+001106.3d | 347.39 | 25.6 | 24.3 | 4.11.4 | 0.276 | 0.21 | 25.5 | ; OII, NeV (AGN) |
| SMM J030244.82+000632.3 | 154.034.1 | 20.5 | 19.1 | 4.91.1 | 0.176 | 0.12 | 13.5 | ; OII, H(SB) |
| SMM J105151.69+572636.0 | 134.413.0 | n/a | 25.2 | 6.71.7 | 1.147 | 1.6 | 25.4 | ; OII, MgII (SB) |
| SMM J105155.47+572312.7d | 46.310.2 | 23.8 | 23.2 | 5.71.4 | 2.686 | 11.7 | 41.7 | ; Ly, IS abs, H (SB) |
| SMM J105158.02+571800.2 | 98.111.6 | n/a | 24.1 | 7.71.7 | 2.239 | 12.3 | 39.2 | ; Ly abs, CIV abs, H(SB) |
| SMM J105200.22+572420.2a | 57.413.2 | n/a | 22.1 | 5.11.3 | 0.689 | 0.33 | 20.0 | ; Oii, FeII (SB) |
| SMM J105201.25+572445.7 | 72.110.2 | n/a | 25.7 | 9.92.2 | 2.148 | 8.1 | 33.0 | ; Ly abs, H (SB) |
| SMM J105207.49+571904.0 | 277.811.9 | n/a | 26.0 | 6.21.6 | 2.692 | 17.5 | 45.4 | ; Ly, H (SB) |
| SMM J105225.79+571906.4b | 127.45.1 | n/a | 24.7 | 4.91.5 | 2.372 | 18.7 | 49.3 | ; Ly, IS abs (SB) |
| SMM J105227.77+572218.2d | 40.49.4 | n/a | 26.0 | 7.02.1 | 1.956 | 3.5 | 23.9 | ; Ly, CIV (SB) |
| SMM J105227.58+572512.4 | 39.211.4 | n/a | 25.0 | 4.51.3 | 2.142 | 4.0 | 33.7 | ; IS abs, CIII (SB) |
| SMM J105230.73+572209.5 | 86.315.4 | n/a | 23.3 | 112.6 | 2.611 | 14.5 | 37.1 | ; Ly, SiII, H (SB) |
| SMM J105238.19+571651.1b | 71.112.6 | n/a | 22.7 | 5.31.6 | 1.852 | 5.8 | 35.9 | ; IS abs (SB) |
| SMM J105238.30+572435.8c,d | 61.022.0 | n/a | 24.6 | 10.92.4 | 3.036 | 18.1 | 39.4 | ; Ly, CIV (AGN) |
| SMM J123549.44+621536.8 | 74.69.5 | 24.2 | 23.7 | 8.32.5 | 2.203 | 8.9 | 35.4 | ; IS abs, H, CO(3-2) (SB) |
| SMM J123553.26+621337.7d | 58.49.0 | 24.8 | 24.7 | 8.82.1 | 2.098 | 6.1 | 31.6 | ; IS abs (SB) |
| SMM J123555.14+620901.7 | 212.013.7 | 24.5 | 24.2 | 5.41.9 | 1.875 | 16.2 | 46.8 | ; Ly, IS abs (SB) |
| SMM J123600.10+620253.5 | 262.017.1 | 25.7 | 25.4 | 6.92.0 | 2.710 | 56.2 | 59.9 | ; extended Ly (SB) |
| SMM J123600.15+621047.2 | 131.010.6 | 25.4 | 25.1 | 7.92.4 | 1.994 | 12.0 | 39.0 | ; Ly, H (SB) |
| SMM J123606.72+621550.7 | 24.05.9 | 23.5 | 23.6 | 4.41.4 | 2.416 | 3.7 | 33.1 | ; Ly, SiIV, CIV (AGN) |
| SMM J123606.85+621021.4 | 74.44.1 | 25.6 | 25.2 | 11.63.5 | 2.505 | 12.8 | 35.5 | ; Ly, H (SB) |
| SMM J123616.15+621513.7c | 53.98.4 | 26.8 | 25.7 | 5.81.1 | 2.578 | 10.0 | 39.9 | ; Ly (SB) |
| SMM J123618.33+621550.5d | 151.011.0 | 26.0 | 25.9 | 7.31.1 | 1.865 | 11.4 | 39.4 | ; IS abs (SB) |
| SMM J123621.27+621708.4c | 148.011.0 | 25.1 | 24.9 | 7.81.9 | 1.988 | 13.5 | 40.3 | ; IS abs, H (SB) |
| SMM J123622.65+621629.7 | 70.98.7 | 25.6 | 25.4 | 7.71.3 | 2.466 | 11.6 | 38.6 | ; Ly, H (SB) |
| SMM J123629.13+621045.8 | 81.48.7 | 26.1 | 24.6 | 5.01.3 | 1.013 | 1.2 | 26.0 | ; OII, MgII (SB) |
| SMM J123632.61+620800.1 | 90.69.3 | 23.8 | 23.6 | 5.51.3 | 1.993 | 8.2 | 40.0 | ; Ly, NV, SiIV, CIV (AGN) |
| SMM J123634.51+621241.0 | 230.013.8 | 24.4 | 23.9 | 4.31.4 | 1.219 | 5.5 | 37.5 | ; OII, MgII (SB) |
| SMM J123635.59+621424.1 | 87.88.8 | 24.2 | 24.2 | 5.51.4 | 2.005 | 8.1 | 40.3 | ; Ly, CIV (AGN) |
| SMM J123636.75+621156.1 | 39.08.0 | 21.9 | 21.6 | 7.02.1 | 0.557 | 0.12 | 15.2 | ; OII, NeV (AGN) |
| SMM J123651.76+621221.3d | 49.37.9 | 21.6 | 21.4 | 4.60.8 | 0.298 | 0.08 | 13.3 | ; probable lens |
| SMM J123707.21+621408.1a | 45.07.9 | 26.9 | 26.0 | 4.71.5 | 2.484 | 7.5 | 39.2 | ; Ly, H (SB) |
| SMM J123711.98+621325.7a | 53.98.1 | 26.0 | 25.8 | 4.21.4 | 1.996 | 4.9 | 36.3 | ; Ly, H (SB) |
| SMM J123712.05+621212.3 | 21.04.0 | 27.0 | 25.5 | 8.01.8 | 2.914 | 5.5 | 31.3 | ; Ly, CIV (AGN) |
| SMM J123716.01+620323.3 | 109.011.4 | 20.3 | 20.2 | 5.31.7 | 2.037 | 10.5 | 41.7 | ; Ly, NV, SiIV, CIV (QSO) |
| SMM J123721.87+621035.3 | 41.09.0 | 24.3 | 23.3 | 12.03.9 | 0.979 | 0.53 | 16.9 | ; H, FeII, (AGN) |
| ID | S1.4GHz | S850μm | z | Lbol | comment | |||
|---|---|---|---|---|---|---|---|---|
| (Jy) | (mag) | (mag) | (mJy) | (L⊙) | (K) | |||
| SMM J131201.17+424208.1 | 49.16.0 | 25.2 | 24.0 | 6.21.2 | 3.405 | 20.2 | 47.1 | ; Ly, SiIV, CIV, OIII, CO(4-3) (AGN) |
| SMM J131208.82+424129.1 | 82.44.8 | 25.7 | 23.9 | 4.91.5 | 1.544 | 3.7 | 33.2 | ; H, MgII, CIV (AGN) |
| SMM J131212.69+424422.5 | 102.67.4 | 26.7 | 5.61.9 | 2.805 | 24.3 | 50.7 | ; Ly, SiIV, CIV (AGN) | |
| SMM J131215.27+423900.9 | 69.34.0 | 18.6 | 18.3 | 4.41.0 | 2.565 | 12.7 | 45.7 | ; Ly, CIV, HeII (QSO) |
| SMM J131222.35+423814.1 | 26.33.9 | 21.8 | 20.2 | 3.00.9 | 2.565 | 4.8 | 39.2 | ; Ly, CIV, HeII (AGN) |
| SMM J131225.20+424344.5 | 76.46.8 | 23.3 | 22.1 | 2.40.8 | 1.038 | 1.2 | 31.4 | ; OII, FeII (SB) |
| SMM J131225.73+423941.4 | 752.54.2 | 24.4 | 24.2 | 4.11.3 | 1.554 | 33.8 | 62.2 | ; MgII, FeII, CIV, SiII (SB) |
| SMM J131228.30+424454.8 | 50.98.1 | 25.9 | 24.7 | 3.40.9 | 2.931 | 13.6 | 49.7 | ; Ly, CIV (SB) |
| SMM J131231.07+424609.0d | 39.48.5 | 26.9 | 4.91.6 | 2.713 | 8.5 | 39.9 | ; Ly (SB) | |
| SMM J131232.31+423949.5 | 94.84.3 | 25.7 | 24.6 | 4.71.1 | 2.320 | 13.1 | 45.4 | ; Ly, H (SB) |
| SMM J131239.14+424155.7 | 49.86.6 | 26.0 | 25.7 | 7.41.9 | 2.242 | 6.3 | 33.2 | ; Ly, H (SB) |
| SMM J141742.04+523025.7 | 23223 | 19.7 | 19.4 | 2.60.9 | 0.661 | 1.2 | 33.7 | ; OII, MgII (SB) |
| SMM J141741.81+522823.0 | 8016 | 23.0 | 21.5 | 3.31.0 | 1.150 | 1.7 | 31.1 | ; OII, FeII (SB) |
| SMM J141750.50+523101.0 | 5714 | 25.1 | 25.0 | 2.80.9 | 2.128 | 5.8 | 42.1 | ; Ly, IS abs (SB) |
| SMM J141800.50+512820.8 | 12819 | 24.1 | 23.3 | 5.01.0 | 1.913 | 11.1 | 43.2 | ; Ly, IS abs (SB) |
| SMM J141802.87+523011.1 | 3914 | 24.4 | 24.2 | 3.40.9 | 2.127 | 4.9 | 38.3 | ; IS abs (SB) |
| SMM J141809.00+522803.8d | 6715 | 25.8 | 25.7 | 4.31.0 | 2.712 | 14.4 | 47.4 | ; Ly (SB) |
| SMM J141813.54+522923.4 | 9316 | 27.4 | 25.9 | 3.61.1 | 3.484 | 39.1 | 68.5 | ; Ly, CIV (AGN) |
| SMM J163627.94+405811.2 | 9223 | 25.2 | 24.9 | 6.52.1 | 3.180 | 31.1 | 52.1 | ; Ly, OI, CIV, H (AGN) |
| SMM J163631.47+405546.9d | 9923 | 24.9 | 24.1 | 6.31.9 | 2.283 | 13.1 | 42.0 | ; Ly, CIV (AGN) |
| SMM J163639.01+405635.9 | 15927 | 24.6 | 23.8 | 5.11.4 | 1.488 | 6.4 | 32.7 | ; CIV, HeII, CIII, FeII, H (SB) |
| SMM J163650.43+405734.5c | 22116 | 23.3 | 22.5 | 8.21.7 | 2.384 | 32.8 | 49.9 | ; Ly, IS abs, CIV, H, CO(3-2) (AGN/SB) |
| SMM J163658.19+410523.8 | 9216 | 26.0 | 25.8 | 10.72.0 | 2.454 | 14.9 | 37.7 | ; Ly, H, CO(3-2) (SB) |
| SMM J163658.78+405728.1d | 7429 | 23.9 | 22.7 | 5.11.4 | 1.190 | 1.7 | 27.5 | ; OII, MgII (SB) |
| SMM J163704.34+410530.3 | 4516 | 24.2 | 23.1 | 11.21.6 | 0.840 | 0.40 | 16.5 | ; OII, OIII (SB) |
| SMM J163706.51+405313.8 | 7423 | n/a | 24.6 | 11.22.9 | 2.375 | 10.9 | 34.3 | ; Ly, SiIV, CIV, H (AGN) |
| SMM J221724.69+001242.1d | 121.110.7 | 20.4 | 20.0 | 8.61.9 | 0.510 | 0.25 | 15.9 | ; probable lens |
| SMM J221725.97+001238.9 | 41.29.3 | 27.1 | 17.42.9 | 3.094 | 12.9 | 32.1 | Ly, IS abs, CO(4-3) (SB) | |
| SMM J221733.02+000906.0 | 161.716.3 | 24.5 | 23.8 | 11.13.4 | 0.926 | 1.9 | 26.4 | ; FeII, H (SB) |
| SMM J221733.12+001120.2 | 69.210.3 | 22.8 | 21.4 | 6.92.1 | 0.652 | 0.33 | 18.8 | ; OII,MgII,FeII (SB) |
| SMM J221733.91+001352.1 | 44.513.4 | 24.8 | 24.1 | 9.11.1 | 2.551 | 8.1 | 33.6 | ; IS abs, H (SB) |
| SMM J221735.15+001537.2 | 49.413.3 | 26.1 | 25.7 | 6.31.3 | 3.098 | 15.3 | 43.6 | ; Ly, CO(3-2) (SB) |
| SMM J221735.84+001558.9 | 44.312.8 | 26.6 | 25.5 | 4.91.3 | 3.089 | 13.1 | 44.6 | ; Ly (SB) |
| SMM J221737.39+001025.1 | 110.114.0 | 25.1 | 24.6 | 6.12.0 | 2.614 | 21.4 | 44.0 | ; Ly, IS abs (SB) |
| SMM J221804.42+002154.4d | 43.810.4 | 25.2 | 24.7 | 9.02.3 | 2.517 | 7.6 | 33.1 | ; IS abs (SB) |
| SMM J221806.77+001245.7 | 241.511.2 | 25.8 | 24.3 | 8.42.3 | 3.623 | 118.6 | 72.0 | ; Ly, OIII (SB) |
| a These SMGs have double radio source identifications, both confirmed to lie at the same redshift. |
| b These SMGs have double radio source identifications, one lying at the tabulated redshift and a second lying at . |
| In calculations and figures presented herein, we have inferred based on the radio luminosity that the high-redshift source is the |
| dominant contributor to the submm emission. |
| c These SMGs have double radio source identifications, however only one has a spectroscopic redshift. |
| d These SMGs have spectroscopically identified optical sources which are offset from the radio source identifications |
| (typically arcsec), although it is usually the case that the optical identification is extended and overlaps the radio source. |
| Chapman et al. (2004b) addresses these issues through higher spatial resolution radio and optical imagery. |
| e The radio flux error estimates are based on the integrated radio flux, and do not always reflect the point source |
| detection sensitivity in the radio map. |
| ()/ | (N) |
|---|---|
| (h-3Mpc-3/decade) | |
| 11.4 | 6.04 |
| 11.9 | 5.84 |
| 12.4 | 6.26 |
| 12.9 | 6.74 |
| (/) | (N) |
|---|---|
| (h-3Mpc-3/decade) | |
| 12.5 | 5.44 |
| 12.9 | 5.29 |
| 13.3 | 6.04 |
| 13.7 | 6.74 |
| class | number | percentage |
|---|---|---|
| successful spectroscopic IDs | (73) | |
| UV-emission line | 38/56 | 68% |
| AGN lines (CIV etc.) | 18/73 | 25% |
| broad-line AGN | 3/73 | 4% |
| Identified primarily through Ly | 25/73 | 34% |
| total spectroscopic sample | (98) | |
| Ly emitting | 38/81 | 47% |
| AGN characteristics | 18/98 | 18% |
| Star Forming galaxies | 30/98 | 31% |
| Difficult to classify | 25/98 | 25% |
| Spectroscopically Unidentified | 25/98 | 26% |