COSMIC : Microarcsecond resolution with a 30 metre radio telescope
Abstract
Interstellar scintillation has been conclusively demonstrated to be the principal cause of the intraday variability (IDV) observed in the centimetre-wavelength emission of many AGN. A few sources show large amplitude modulation in their flux density on a timescale of hours. However, the majority of IDV sources exhibit variability on timescales of a day or more. On timescales of a year some sources have been found to show an annual cycle in the pattern of their variability. Such an annual cycle occurs because the relative speeds of the Earth and the interstellar medium change as the Earth orbits the Sun. To search for these annual variations as well as to follow the source evolution, requires a dedicated instrument; the necessary amounts of observing time are beyond the capability of the national facility instruments. Here we describe the scientific motivation for, and present an outline of the COSMIC (Continuous Single dish Monitoring of Intraday variability at Ceduna) project which uses the University of Tasmania’s 30 m diameter radio telescope at Ceduna, which has been monitoring the flux density of a number of the stronger southern scintillators at 6.65 GHz since March 2003.
1 Introduction
In the last few years interstellar scintillation (ISS), has been demonstrated to be the principal mechanism responsible for the intraday variability (IDV) seen in many compact flat-spectrum radio sources at centimetre wavelengths. Two types of observations have been responsible for this: a time delay in the arrival times of the intensity pattern at widely spaced telescopes, and an annual cycle in the timescale of the variability. A time delay of several minutes has been found for the three most rapidly variable sources PKS B0405385 (Jauncey et al., 2000), PKS B1257326 (Bignall et al., 2004) and CLASS J1819+3845 (Dennett-Thorpe & de Bruyn, 2002). Such measurements can be made only for the most rapid variables with hour or sub-hour timescales, and are not possible for the more common intraday and inter-day variables.
The speed of the local interstellar medium (ISM), is close to the speed of the Earth in its orbit around the Sun (30 kms-1) and this leads to an annual cycle in the timescale of variability. For part of the year the Earth and the ISM are travelling roughly parallel, the relative velocity is small and the timescale of intensity changes is long. Six months later the Earth is moving in the opposite direction, the relative velocity is high and the variability timescale is much shorter. Such an annual cycle has been found for the two long-lived rapid variables PKS B1257326 (Bignall et al., 2003) and CLASS J18193845 (Dennett-Thorpe & de Bruyn, 2002), as well as for several of the slower IDV sources : B0917624 (Rickett et al., 2001; Jauncey & Macquart, 2001), PKS B1519273 (Jauncey et al., 2003), and more recently B0059581 (D. L. Jauncey et al., in preparation). These rapid variables have played a crucial role in establishing ISS as the principal mechanism responsible for centimetre wavelength IDV. Unfortunately, there are very few such rapid variables. The MASIV survey (Lovell et al., 2003) showed that the great majority of sources possess variability timescales of a day or more, rather than the hours or less of the rapid scintillators.
Measurement of an annual cycle can be used to probe the structure of both the ISM and the source (on microarcsecond scales), and has been dubbed “Earth orbit synthesis” (Macquart & Jauncey, 2002). This technique has been sucessfully applied to determine the microarcsecond flux density and polarization structure of PKS B0405385 (Rickett et al., 2002) and the microarcsecond structure of CLASS J1819+3845 (Dennett-Thorpe & de Bruyn, 2003) and PKS B1257326 (Bignall et al., 2003). Reliable measurements of an annual cycle are straight forward for the rapid inter-hour variables, since many intensity fluctuations or “scints” can be seen in a 12 hour observing session, such as is readily available on national facility instruments like the ATCA, the VLA and the WSRT. However, such measurements for the more common intraday variables require observing sessions spanning many days on multiple occasions throughout the year. These are much more difficult programs for the national facility instruments to accommodate because of the limited time available and their oversubscription.
There are a large number of small (20-40 metre diameter) stand-alone radio telescopes throughout the world, which cannot compete in terms of sensitivity with modern large apertures and interferometers. These small telescopes often play important roles in VLBI arrays such as the European VLBI Network (EVN) and Australian Long Baseline Array (LBA), but struggle to find high-impact science to undertake when operating as a single dish. Small (1-2 metre diameter) optical telescopes faced a similar problem a decade or so ago, however the advent of microlensing and high redshift supernovae searches provided new purposes for this class of instrument. Clearly the niche for small radio telescopes requires projects which involve large amounts of observing time, but only modest sensitivity. To date, this niche has been filled by projects such as searches for maser lines (e.g. Ellingsen et al., 1996; Szymczak et al., 2002; Valdettaro et al., 2001), or monitoring of bright pulsars (e.g. Flanagan, 1995; D’Alesandro & McCulloch, 1997), masers (e.g. Goedhart et al., 2004), or the total intensity of AGN (e.g. Aller et al., 2003).
Following the initial successes in establishing ISS as the cause of centimetre IDV through the measurement of annual cycles, it became clear to us that a wider application of this technique to many scintillating sources requires a radio telescope dedicated to the task of precision flux density monitoring, in order to determine the changes in the variability characteristics of a number of sources over the course of a year or more. A sufficient numbers of scintillating sources with mean flux densities of 1 Jy or more have been found in the southern sky (Kedziora-Chudczer et al., 2001; Bignall et al., 2002; Bignall, 2003) to consider using the 30 m telescope at Ceduna, which is operated by the University of Tasmania.
PKS B0405385 was the first of the large amplitude, extremely rapid variables discovered (Kedziora-Chudczer et al., 1997). Here the very rapidity of the variations, if intrinsic to the source, implied brightness temperatures of up to 1021 K, nine orders of magnitude in excess of the inverse Compton limit. This forced a major re-appraisal of the intrinsic variability hypothesis which ultimately led to the first intensity pattern time delay observations and the unequivocal demonstration that interstellar scintillation rather than intrinsic variability was the mechanism responsible for the rapid flux density variations (Jauncey et al., 2000). Subsequent investigations of PKS B0405385 and the other two rapid scintillators PKS B1257326 and CLASS J1819+3845, have revealed that the reason for these fast variations is the presence of nearby ISM scattering screens, rather than any extreme properties ( K) of the sources. The rapid variability in each has been shown to be the product of scattering by ISM plasma at a distance of no more than a few tens of pc (Rickett et al., 2002). Brightness temperatures of the order of 1012 K have been established, closely overlapping those found in conventional VLBI and space VLBI observations (Lovell et al., 2003).
The general argument for nearby screens is straightforward. For a point source in the weak scattering case at typically 5 - 8 GHz, the linear size, , of the first Fresnel zone is roughly the characteristic timescale, , multiplied by the component of the ISM velocity perpendicular to the line of sight (). This in turn is proportional to , where is the screen distance and the wavelength. Narayan (1992) shows that in the case of an extended source (, which is believed to be the general case for AGN), we have
| (1) |
where and are the angular sizes of the source and the Fresnel zone respectively. So the the source angular size is proportional to , while the brightness temperature, , scales as and hence . The rapid variables with small have been shown to be scattered by nearby screens. For nearby screens, sources with longer have larger angular sizes and hence lower brightness temperatures.
The COSMIC program is specifically directed at the more usual inter- and intraday variables. These have values of days rather than hours and hence they are more likely to be scattered by more distant screens and therefore to possess smaller angular sizes. The program’s principal objective is to closely monitor the 6.65 GHz flux density of several well documented, large-amplitude southern variables principally selected from the Kedziora-Chudczer et al. (2001) survey and subsequently examined in more detail by Bignall (2003). Since the characteristic timescales for the sample are of the order a day it is necessary to measure the flux density throughout the day, and from day-to-day for up to several weeks, in order to follow the variations in detail. Observations of each source must then be repeated at regular intervals over the course of a year, or preferably longer, to establish whether the signature of an annual cycle is present.
Such a large-scale and intensive observational program has never been undertaken before, so the COSMIC (COntinuous Single dish Monitoring of Intraday variability at Ceduna) program was initiated, in part to establish that such a single dish facility could operate sufficiently well to achieve this goal. The value of the COSMIC program extends beyond confirming that ISS is the cause of centimetre wavelength variability, since it is clear that scintillators display a broad spectrum of characteristics in their long-term behaviour. The observations are probing a new dimension in variability parameter space, so serendipity may well play a major role in the outcomes from the COSMIC program. For example, PKS B0405385 exhibits episodic behaviour periods consisting of a few months of intense activity interspersed between several years of relative inactivity (Kedziora-Chudczer et al., 1997, 2001; Jauncey et al., 2000; Cimò et al., 2004). In contrast, B0917+628, which had shown the annual cycle characteristic of ISS for more than a decade (Kraus et al., 1999; Jauncey & Macquart, 2001; Rickett et al., 2001), suddenly ceased its scintillation in September 2000 and subsequently has been remarkably inactive (Fuhrmann et al., 2002). PKS B1519273 has been followed closely at the ATCA since the discovery of its scintillation in 1994, and continues to show much the same annual cycle a decade later (Jauncey et al., 2003), as is well demonstrated in our current Ceduna data (S. J. B. Carter et al., in prep.).
This episodic behaviour demonstrates that significant changes often take place in scintillating sources on a timescale of months to years, and likely also in the turbulent ionized interstellar medium. The early results from the MASIV VLA scintillation survey (Lovell et al., 2003, S. S. Shabala et al. in prep.) reveal that episodic variables outnumber the persistent variables by two to one.
2 The Ceduna Radio Telescope
The University of Tasmania Ceduna radio telescope is a 29.6 metre diameter parabolic antenna designed and constructed by Mitsubishi in 1969, with an alt-az mount and feeds located at the Nasmyth focus (Figure 1). It is located near the coast of South Australia, some 850 km west of Adelaide, at longitude 133°48′36.57″ east, latitude -31°52′05.04″, and an altitude of 161 m above sea level. The facility was established by the Overseas Telecommunications Company (OTC) in 1969, as the Ceduna Satellite Earth Station and was later taken over by Telstra. The Earth Station provided the gateway between Australia and Europe for telephone and television communication, via the global satellite system set up by Intelsat that offered sophisticated and low-cost communication services around the world. The choice of Ceduna as the location of an Earth Station was dictated by the limits of the coverage zone of the Indian Ocean geostationary satellite, the need to be reasonably close to Australia’s populous south eastern region, and the need to be in a location free from man-made electrical noise. During 1984, almost half of Australia’s International telecommunication traffic passed through Ceduna’s Earth Station.
In October 1994, improved communication methods (notably fibre optic links) and a need to rationalise services saw the closure of the Ceduna Earth Station. In September 1995 Telstra donated the Ceduna Satellite Earth Station to the University of Tasmania for use as a radio astronomy observatory. At the time of the handover, the antenna drive and control systems were those originally installed in 1969 and power was provided by a set of on-site diesel generators. The facility’s conversion to a radio astronomy observatory was a significant undertaking and included the connection of mains electricity, modification of the cable twister assembly, and the installation of new antenna drive motors and controllers, angle encoding equipment, feeds and a range of specialised radio astronomy equipment. The new electric drive motors provide slew rates of up to 40 degrees per minute about both axes, with an elevation limit of 1°. Angle encoding is highly repeatable and currently an RMS pointing accuracy of about 20″ is achieved. The COSMIC project is providing a large amount of additional pointing information which is expected to result in an improvement of a factor of two or more in the pointing accuracy. The antenna surface has been surveyed and adjusted to an RMS accuracy of about 0.8 mm.
During its operation by the OTC/Telstra, the Ceduna antenna provided simultaneous up and down-links to the Intelsat satellites using frequencies in the 4-6 GHz range (transmitting in the range 5.925-6.425 GHz and receiving in the range 3.7-4.2 GHz). The high-powered transmission amplifiers originally used with the antenna were oil-cooled and could not be tilted. This was the reason for the choice of Nasmyth optics, since the focus position of the antenna lies along the elevation axis, allowing the transmitters to be housed in the “upper equipment room” (see Figure 1). This design feature impacts upon the range of frequencies at which the antenna can operate. The dimensions of the hole in the elevation axis limits the diameter of the final section of waveguide feed, resulting in a lower frequency limit at Ceduna of 2 GHz. Corrugations in the large waveguide sections close to the tertiary mirror affect the propagation at higher frequencies, resulting in 22 GHz being the upper frequency achievable. We have designed and built a range of new terminating sections for the Nasmyth waveguide feed, which operate in the frequency bands of 2.2, 4.8, 6.7, 8.4, 12.2 and 22 GHz. For reliability and simplicity the dual circular polarization receivers at each frequency are uncooled and have a bandwidth of approximately 500 MHz (except the 22 GHz system). The frequency range and system equivalent flux density for each system is summarised in Table 1.
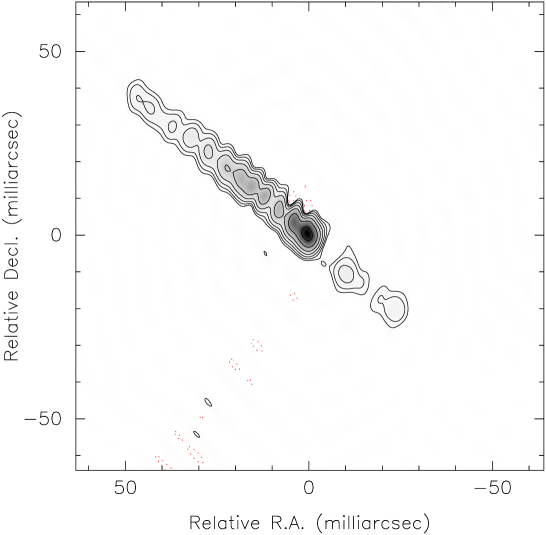
The Ceduna 30m antenna conversion project was largely motivated by the need to extend the Long Baseline Array (LBA)111The LBA is operated as a National Facility by the Australia Telescope National Facility and the University of Tasmania.. The LBA consists of the Australia Telescope National Facility, Parkes, Mopra and ATCA telescopes, the University of Tasmania Hobart and Ceduna telescopes, with regular participation of the NASA Tidbinbilla telescopes and the Hartebeesthoek telescope in South Africa. The Ceduna antenna first participated in LBA observations in late 1997. It has significantly enhanced the imaging capability of the array, by increasing the number of baselines, and more importantly providing much needed east-west baselines. With the inclusion of Ceduna, the longest north-south baseline (1400 km from the ATCA to Hobart) is comparable to the longest east-west baseline (1500 km from the ATCA to Ceduna). Figure 2 shows a 6.6 GHz LBA image of the nucleus of the radio galaxy Centauraus A, in which the counterjet is clearly seen, as are a number of components along the jet (S. J. Tingay et al. in prep.). This image is of significantly higher quality than comparable images of Centaurus A made with the pre-Ceduna LBA (see for example Figure 1 of Tingay et al., 1998). The Ceduna antenna is currently equipped with LBA-DAS/S2 tape-based (Wilson et al., 1995) and Metsähovi disk-based VLBI recording systems (Dodson et al., 2004).
3 The COSMIC project
The motivation for the COSMIC project is outlined above (§ 1). The observations are made using an uncooled receiver with two orthogonal circular polarizations operating over the frequency range 6.4-6.9 GHz. This is in the regime of weak scattering for most AGN (Walker, 1998, 2001), but close to the transition frequency between weak and strong scattering, where the variability amplitude is large.
To measure the flux density of a source we undertake a series of four scans, one pair increasing and then decreasing in right ascension (constant declination), one pair increasing and then decreasing in declination (constant right ascension). Hereafter we refer to a series of four such scans as a scan group. All scans are centred on the source position, have a total length of 45′ on the sky, and the telescope is driven at a rate of 3 degrees per min. Prior to each scan the strength of the receiver noise diode is measured and compared to a 1 dB step to determine the system equivalent flux density. Calibration, interference excision, resampling the intensity data as a function of position on the sky and slewing of the antenna takes on average a total of 45 seconds, and results in a single scan taking approximately 1 minute. The observing software fits a Gaussian profile with a quadratic baseline (although for the vast majority of scans a linear baseline is sufficient) to the intensity data and uses this fit to measure any pointing offset. If the increasing and decreasing scans in the same coordinate yield the same offset then the source position in that coordinate is updated for subsequent scans. During the observations the data are sampled at 847 Hz. At the completion of each scan an automated procedure is undertaken to remove the occasional outlying point which differs significantly from the surrounding samples, and which is caused by interference or occasional miss-reading of the analogue to digital converters. After this process the data are resampled as a function of telescope position with 187 sample points across a 45′ scan. These data are saved in FITS format using a local implementation of the single dish conventions (Garwood, 2000) developed by Chris Phillips.
Post-observation analysis of the data are undertaken using a series of purpose-written programs in the Matlab environment. This software uses non-linear least squares minimization routines to fit a Gaussian profile plus a quadratic baseline to each scan (in the same manner as the observing system). Practical considerations mean that the data processing has to be largely automatic. For this reason one of the most important aspects of the data processing is the system quality control routine which ensures that aberrant measurements do not contaminate the final light-curves. The first aspect of the the quality control process is to reject scans which are not well fitted by the non-linear least squares routine. The RMS in the residuals (after subtracting the fitted model to the data), are computed, and scans with an RMS in excess of a specific (empirically set) tolerance are rejected. The second quality control measure is implemented through consistency checks. The position of the peak and the FWHM of the fitted Gaussian profile should be the same for both polarizations, a significant difference indicating a problem with one or both scans. Similarly the amplitude, FWHM and position of the Gaussian peak should be similar for the scans made in increasing and decreasing directions. Failure of either of the quality control steps leads to rejection of the entire scan group as it is not possible to confidently measure and correct for pointing offsets with an incomplete scan group (it is possible to operate with only a single polarization, but this reduces the sensitivity by a factor of ). To ensure an overall high quality of the data for further analysis (in an unbiased fashion), the various quality control checks are tightened until approximately 60% of scan groups remain.
Scan groups that pass quality control have the data for the two polarizations scaled to convert their intensity into units of Jy, and then averaged. Then the increasing and decreasing scans in right ascension and in declination are averaged. The beam pattern of the Ceduna antenna at 6.65 GHz is well approximated by a circular Gaussian with a FWHM of 5.8′. When there is an offset between the predicted and actual source position, the flux density measured is reduced. However, the right ascension scan measures the declination component of any offset, and vice versa, allowing scaling corrections to be calculated. After application of the calculated pointing offset scaling factor we have two independent flux density measurements from each scan group, which translates into approximately 400 independent flux density measurements (across all sources) each day. Observations of a number of calibrator sources shows that the gain of the antenna varies slightly with elevation. The flux density measurements are scaled using the gain-elevation correction from Equation 2. The gain/elevation dependence was determined from observations at elevations greater than 10° (the lower elevation cutoff chosen for COSMIC) of a number of strong calibration sources. The data from each source were normalised to an intensity of 1 at an elevation of 50°, and a second order polynomial was fitted to the normalized data. The observed gain variations are less than 5%.
| (2) |
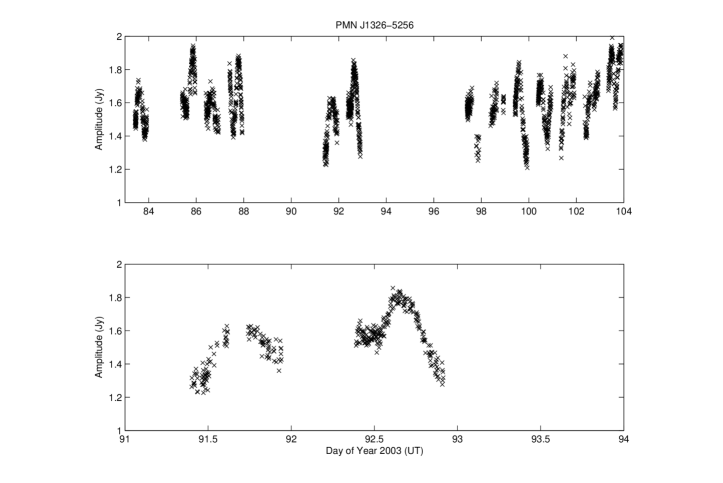
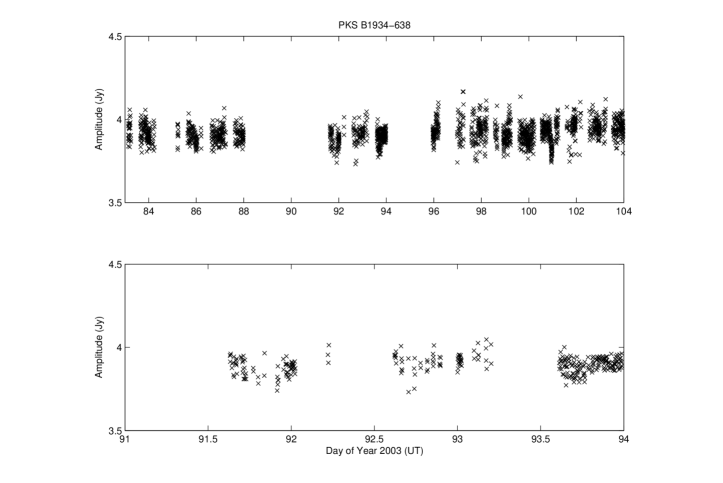
We have examined the RMS for the light curves of three calibrator sources (PKS B1934638, PKS B0945+076 and PKS B1921293). We expect the measured RMS in these calibrators to consist of a constant term, and term which is some fraction of the source flux density. These terms are independent and add in quadrature. Fitting the observed RMS of the calibrator sources with this type of function gives a constant error term of 33 mJy and a fractional term of 1% of the source flux density (correlation coefficient 0.997). So for a scintillating source like PMN J13265256 which has a flux density of approximately 1.5 Jy at 6.65 GHz, we expect a measurement error of approximately 36 mJy or 2.4% of the mean flux density. If the data are smoothed using a 5-point running mean (which corresponds to a timescale of approximately 20 minutes) the measured RMS for the calibrators are approximately a factor of 2 lower, as is expected. The RMS confusion error for a 30 m telescope at 6.65 GHz is approximately 20 mJy, which is smaller than the 33 mJy noise error noted above, so confusion is expected to make a small contribution to the measured scan noise and is not a limiting factor in the current system.
The COSMIC project commenced in March 2003 and is monitoring a number of IDV sources. The source names, positions and other details are given in Table 2. The sources are divided into two separate groups, each of which is observed for alternating periods of 10–14 days. The length of the period is choosen to allow multiple scintles to be observed and hence enable the determination of the characteristic timescale of the variations. We observe a small number of sources in each group so as to obtain good sampling for the light-curves. The two groupings are: those sources which pass north of the zenith at Ceduna (AO B0235+164, PKS B1519273, PKS B1622253), and those that are south of the zenith (PKS B1144379, PMN J13265256). For each group of sources we also observe a calibrator, PKS B0945+076 (3C227) and PKS B1934638 for the northern and southern sources respectively. All the scintillating sources have mean flux densities at 6.65 GHz that typically lie in the range 1–4 Jy and so the measurement error in our time series can be assumed to be 50 mJy. Figure 3 shows 24 days of observations of PMN J13265256 made with the Ceduna telescope, in which the intraday variability is clearly demonstrated. Figure 4 shows the calibrator PKS B1934638 observed over the same period, demonstrating that the variability seen in PMN J13265256 is real and not due to observational errors.
One unusual aspect of the COSMIC project is that it operates almost entirely remotely. The Ceduna antenna is approximately 1700 km from the University of Tasmania’s main campus at Hobart, and the observatory is only staffed for a few weeks each year during VLBI observations. The operation of the telescope is checked daily by a member of the team based in Hobart, and the data for the previous day transferred to Hobart for analysis. A perl script is used to monitor the operation of the telescope and observing software and to automatically recover from common problems or issue an alert when it is not successful. This has proved to be remarkably successful, with human intervention seldom required more often than once every 2 weeks. During the first year of the program (with the exception of VLBI observing periods) only once were observations interrupted for more than 12 hours, due to the failure of the noise diode.
4 Conclusions
The COSMIC project is a unique experiment to provide quasi-continuous flux density monitoring that enables the exploration of the variability of sources on timescales ranging from hours to years. This will enable us to determine both the microarcsecond structure of the sources being monitored, and also to better understand the turbulent local interstellar medium. The sources presently being monitored predominantly exhibit timescales of days or longer and so cannot be intensely monitored with national facility instruments such as the ATCA, VLA or WSRT.
We have demonstrated that we can measure changes in source intensity with an accuracy and reliability of a few percent for sources stronger than 1 Jy. These results will be detailed in upcoming papers which will also describe the methods used to determine the timescale and other characteristics of the variations.
The COSMIC project demonstrates that it is possible to undertake accurate long-term flux density monitoring of appropriate sources with a 30 m radio telescope. There are many other scintillating sources that could be monitored by other similar telescopes. We also expect that monitoring of sources in the COSMIC sample at other frequencies, or by telescopes at different longitudes, will significantly enhance our ability to interpret and understand the variability in these sources.
5 Acknowledgements
Funding for conversion of the Ceduna antenna for radio astronomy was provided by Telstra, the Australian Research Council and through the Major National Research Facilities programme. Financial support for the COSMIC project is provided by the Australian Research Council. The ATNF is funded by the Commonwealth Government for operation as a National Facility by CSIRO. We thank Bev Bedson for her vital contribution to the operation of the Ceduna observatory and the COSMIC project. We thank S. Tingay for making available the 6.6 GHz Cen A image prior to publication. This research has made use of NASA’s Astrophysics Data System Abstract Service.
References
- Aller et al. (2003) Aller, M. F., Aller, H. D., Hughes, P. A., 2003, ApJ, 586, 33
- Bignall (2003) Bignall, H. E., 2003, Ph.D. thesis, University of Adelaide
- Bignall et al. (2002) Bignall, H. E., Jauncey, D. L., Kedziora-Chudczer, L. L., Lovell, J. E. J., Macquart, J-P., Rayner, D. P., Tingay, S. J., Tzioumis, A. K., Clay, R. W., Dodson, R. G., McCulloch, P. M., Nicolson, G. D., 2002, PASA, 19, 29
- Bignall et al. (2003) Bignall, H. E., Jauncey, D. L., Lovell, J. E. J., Tzioumis, A. K., Kedziora-Chudczer, L., Macquart, J.-P., Tingay, S. J., Rayner, D. P., Clay, R. W., 2003, ApJ, 585, 653
- Bignall et al. (2004) Bignall, H. E., Jauncey, D. L., Lovell, J. E. J., Kedziora-Chudczer, L., Macquart, J-P., Tzioumis, A. K., Rickett, B. J., Ojha, R., Carter, S., Cimo, G., Ellingsen, S., McCulloch, P. M., 2004, Proc. 7th EVN Symposium, Bachiller, R., Colomer, F., Desmurs, J.F., de Vincente, P., eds., October 12 - 15 2004, Toledo, Spain
- Cimò et al. (2004) Cimò, G., Ellingsen, S., Carter, S., McCulloch, P., Jauncey, D., Lovell, J., 2004, IAU Circular 8403
- D’Alesandro & McCulloch (1997) D’Alesandro, F., McCulloch, P. M., 1997, MNRAS, 292, 879
- Dennett-Thorpe & de Bruyn (2002) Dennett-Thorpe, J., de Bruyn, A. G., 2002, Nature, 415, 57
- Dennett-Thorpe & de Bruyn (2003) Dennett-Thorpe, J., de Bruyn, A. G., 2003, A&A, 404, 313
- Dodson et al. (2004) Dodson, R., Tingay, S., West, C., Phillips, C., Tzioumis, A., Ritakari, J., Briggs, F., 2004, Proc. 7th EVN Symposium, Bachiller, R., Colomer, F., Desmurs, J.F., de Vincente, P., eds., October 12 - 15 2004, Toledo, Spain
- Ellingsen et al. (1996) Ellingsen, S. P., von Bibra, M. L., McCulloch, P. M., Norris, R. P., Deshpande, A. A., Phillips, C. J., 1996, MNRAS, 280, 378
- Flanagan (1995) Flanagan, C. S., 1995, Ap&SS, 230, 359
- Fuhrmann et al. (2002) Fuhrmann, L., Krichbaum, T. P., Cimò, G., Beckert, T., Kraus, A., Witzel, A., Zensus, J. A., Qian, S. J., Rickett, B. J., 2002, PASA, 19, 64
- Garwood (2000) Garwood, R. W. 2000, in ASP Conf. Ser., Vol. 216, Astronomical Data Analysis Software and Systems IX, eds. N. Manset, C. Veillet, D. Crabtree (San Francisco: ASP), 243
- Goedhart et al. (2004) Goedhart, S., Gaylard, M. J., van der Walt, D. J., 2004, MNRAS in press
- Jauncey et al. (2000) Jauncey, D. L., Kedziora-Chudczer, L. L., Lovell, J. E. J., Nicolson, G. D., Perley, R. A., Reynolds, J. E., Tzioumis, A. K., Wieringa, M. H. 2000, in Astrophysical Phenomena Revealed by Space VLBI, Proceedings of the VSOP Symposium, eds. H. Hirabayashi, P.G. Edwards, D.W. Murphy (Sagimahara: Institute of Space and Astronautical Sciences), 147
- Jauncey & Macquart (2001) Jauncey, D. L., Macquart, J.-P., 2001, A&A, 370, 9
- Jauncey et al. (2003) Jauncey, D. L., Johnston, H. M., Bignall, H. E., Lovell, J. E. J., Kedziora-Chudczer, L., Tzioumis, A. K., Macquart, J.-P., 2003, Ap&SS, 288, 63
- Kedziora-Chudczer et al. (1997) Kedziora-Chudczer, L., Jauncey, D. L., Wieringa, M. A., Walker, M. A., Nicolson, G. D., Reynolds, J. E., Tzioumius, A. K., 1997, ApJ, 490, 9
- Kedziora-Chudczer et al. (2001) Kedziora-Chudczer, L., Jauncey, D. L., Wieringa, M. A., Tzioumis, A. K., Reynolds, J. E., 2001, MNRAS, 325, 1411
- Kraus et al. (1999) Kraus, A., Witzel, A., Krichbaum, T. P., Lobanov, A. P., Peng, B., Ros, E., 1999, A&A, 352, L107
- Lovell et al. (2003) Lovell, J. E. J., Jauncey, D. L., Bignall, H. E., Kedziora-Chudczer, L., Macquart, J.-P., Rickett, B. J., Tzioumis, A. K., 2003, AJ, 126, 1699
- Macquart & Jauncey (2002) Macquart, J.-P., Jauncey, D. L., 2002, ApJ, 572, 786
- Narayan (1992) Narayan, R., 1992, Phil. Trans. R. Soc. Lond. A, 341, 151
- Rickett et al. (2001) Rickett, B. J., Witzel, A., Kraus, A., Krichbaum, T. P., Qian, S. J., 2001, ApJ, 550, 11
- Rickett et al. (2002) Rickett, B. J., Kedziora-Chudczer, L., Jauncey, D. L., 2002, ApJ, 581, 103
- Szymczak et al. (2002) Szymczak, M., Kus, A., Hrynek, G., Kepa, A., Pazderski, E., 2002, A&A, 392, 227
- Tingay et al. (1998) Tingay, S. J. et al., 1998, AJ, 115, 960
- Valdettaro et al. (2001) Valdettaro, R., Palla, F., Brand, J., Cesaroni, R., Comoretto, G., Di Franco, S., Felli, M., Natale, E., Palagi, F., Panella, D., Tofani, G., 2001, A&A, 368, 845
- Walker (1998) Walker, M. A., 1998, MNRAS, 294, 307
- Walker (2001) Walker, M. A., 2001, MNRAS, 321, 176
- Wilson et al. (1995) Wilson, W. E., Roberts, P. P., Davis, E. R., 1995, in Proceedings of the 4th APT workshop, ed. E. A. King (Sydney: ATNF/CSIRO publications), 16
| Band | Frequency | System Equivalent |
|---|---|---|
| Designation | Range | Flux Density |
| (MHz) | (Jy) | |
| S | 400 | |
| C | 450 | |
| Methanol | 550 | |
| X | 600 | |
| Ku | 750 | |
| K | 2500aaThe K-band system has only been tested at 22.2 GHz and how the SEFD changes over the frequency range is not yet known |
| Source | Right | Declination | Source | Flux Density | Ecliptic | Ecliptic |
|---|---|---|---|---|---|---|
| Name | Ascension | Type | Range | Longitude | Latitude | |
| (J2000) | (J2000) | (Jy) | (degrees) | (degrees) | ||
| AO B0235+164 | 02:38:38.9 | +16:36:59 | IDV | 1.5 – 2.0 | 42.46 | 1.09 |
| PKS B0945+076 (3C227) | 09:47:46.4 | +07:25:12 | Calibrator | 1.9 | ||
| PKS B1144379 | 11:47:01.4 | 38:12:11 | IDV | 1.5 – 2.5 | 194.66 | -35.81 |
| PMN J13265256 | 13:26:49.2 | 52:56:44 | IDV | 1.2 – 2.0 | 222.38 | -39.36 |
| PKS B1519273 | 15:22:37.7 | 27:30:11 | IDV | 1.9 – 3.0 | 235.33 | -8.67 |
| PKS B1622253 | 16:25:46.9 | 25:27:39 | IDV | 2.4 – 3.2 | 248.80 | -3.74 |
| PKS B1934638 | 19:39:25.0 | 63:42:46 | Calibrator | 3.9 |

.