11email: Jean-Claude.Bouret@oamp.fr 22institutetext: Department of Astronomy, University of Maryland, College Park, MD 20742, USA
22email: tlanz@umd.edu 33institutetext: Department of Physics and Astronomy, University of Pittsburgh, Pittsburgh, PA 15260, USA
33email: hillier@pitt.edu
Lower mass loss rates in O-type stars: Spectral signatures of dense clumps in the wind of two Galactic O4 stars††thanks: Based on observations made by the NASA-CNES-CSA Far Ultraviolet Spectroscopic Explorer and by the NASA-ESA-SERC International Ultraviolet Explorer, and retrieved from the Multimission Archive at the Space Telescope Science Institute (MAST).
We have analyzed the far-ultraviolet spectrum of two Galactic O4 stars, the O4If+ supergiant HD 190429A and the O4V((f)) dwarf HD 96715, using archival FUSE and IUE data. We have conducted a quantitative analysis using the two NLTE model atmosphere and wind codes, Tlusty and CMFGEN, which incorporate a detailed treatment of NLTE metal line blanketing. From the far-UV spectrum, we have derived the stellar and wind parameters and the surface composition of the two stars. The surface of HD 190429A has a composition typical of an evolved O supergiant (nitrogen-rich, carbon and oxygen-poor), while HD 96715 exhibits surface nitrogen enhancement similar to the enrichment found in SMC O dwarfs which has been attributed to rotationally-induced mixing. Following studies of Magellanic Cloud O stars, we find that homogeneous wind models could not match the observed profile of O v1371 and require very low phosphorus abundance to fit the P v1118-1128 resonance lines. We show, on the other hand, that we are able to match the O v and P v lines using clumped wind models. In addition to these lines, we find that N iv1718 is also sensitive to wind clumping. For both stars, we have calculated clumped wind models that match well all these lines from different species and that remain consistent with H data. In particular, we have achieved an excellent match of the P v resonance doublet, indicating that our physical description of clumping is adequate. These fits therefore provide a coherent and thus much stronger evidence of wind clumping in O stars than earlier claims. We show that the success of the clumped wind models in matching these lines results from increased recombination in the clumps, hence from a better description of the wind ionization structure. We find that the wind of these two stars is highly clumped, as expressed by very small volume filling factors, namely for HD 190429A and for HD 96715. In agreement with our analysis of SMC stars, clumping starts deep in the wind, just above the sonic point. The most crucial consequence of our analysis is that the mass loss rates of O stars need to be revised downward significantly, by a factor of 3 and more. These lower mass loss rates will affect substantially the evolution of massive stars. Accounting for wind clumping is essential when determining the wind properties of O stars. Our study therefore calls for a fundamental revision in our understanding of mass loss and of O-type star stellar winds.
Key Words.:
Stars: winds - Stars: atmospheres - Stars: early-type - Stars: fundamental parameters - Stars: individual: HD 190429A, HD 967151 Introduction
The spectrum of hot, massive stars reveals signatures of dense, highly-supersonic mass outflows that are driven by the strong radiation field. These stellar winds have a significant effect on the evolution of massive stars, as O stars will lose a sizable fraction of their total mass during their lifetime. Mass loss rates are, therefore, a crucial parameter of stellar evolution models. These mass loss rates, like other basic stellar parameters, can be derived from spectrophotometric analyses based on model stellar atmospheres. For a recent review of the properties of hot star winds, see Kudritzki & Puls (2000).
During the last decade, major advances have been accomplished in constructing more realistic model atmospheres, which consistently account for the stellar wind, for departures from the Local Thermodynamic Equilibrium (LTE), and for metal line blanketing (Hubeny & Lanz 1995; Hillier & Miller 1998; Hauschildt et al. 1997; Pauldrach et al. 2001; Koesterke et al. 2002; Hubeny et al. 2003). Current state-of-the-art non-LTE (NLTE) model atmospheres assume smooth, homogeneous and stationary winds. There are, however, theoretical arguments as well as observational evidences that the winds of hot stars are extensively structured. Radiation hydrodynamics simulations of the line-driven flow’s nonlinear evolution show the line force to be highly unstable and lead to strong reverse shocks (see, e.g., Owocki et al. 1988; Owocki 1994; Feldmeier 1995; Owocki & Puls 1999). We thus expect the presence of density contrasts in the wind of O stars, which is supported by several lines of observations.
First, the soft X-ray emission of O stars is widely believed to originate from shocks propagating through the stellar wind (Lucy 1982; Cassinelli & Swank 1983). With the advent of high resolution X-ray spectroscopic capabilities on Chandra and XMM-Newton, detailed wind-shock models can be tested by fitting X-ray line profiles. The fitted lines indicate that the hot emitting plasma is located throughout the wind starting close to the photosphere (Kramer et al. 2003). However, the high opacity of their wind model has to be lowered in order to reproduce the X-ray flux level. Oskinova et al. (2004) recently offered a solution to this issue considering highly fragmented winds.
Second, temporal variability of O-star wind line profiles is well documented and might indicate the propagation of disturbances throughout the wind, most often observed as Discrete Absorption Components (see, e.g., Howarth et al. 1995; Massa et al. 1995). In the spectrum of the prototypical O supergiant Pup, Eversberg et al. (1998) observed stochastic variable substructures in He ii4686 that move away from the line center with time. They explained them as evidence of blobs or clumps moving outward in the stellar wind.
Third, Hillier (1991) showed that the weak electron scattering wings of He ii4686 in the spectrum of Wolf-Rayet (WR) stars can be explained by clumped wind models and can thus be used to diagnose density inhomogeneities in hot star winds. The inclusion of clumping in wind studies of WR stars resulted in lowering their mass loss rates by a factor of 2 to 4 (Moffat & Robert 1994; Hamann & Koesterke 1998; Hillier & Miller 1999).
Lastly, spectral evidence of clumping has been reported in recent studies of Magellanic Cloud (MC) O stars. Crowther et al. (2002b) and Hillier et al. (2003) found that phosphorus needs to be significantly underabundant relative to other heavy elements in order to match P v1118, 1128 in O supergiants. Alternatively, theoretical line profiles from clumped wind models match the observed P v lines, assuming a “standard” phosphorus abundance. ¿From studying the wind ionization of a large sample of LMC O stars, Massa et al. (2003) came to a similar conclusion about the P v resonance lines providing an indication of wind clumping. Moreover, Hillier et al. (2003) showed that the clumped wind models match strong Fe lines, while homogeneous wind models predict marked blue asymmetries that are not observed. Independently, Bouret et al. (2003) successfully matched for the first time the O v1371 line profile using clumped models. A good match to this line was never achieved with homogeneous wind models. Bouret et al. found that clumping starts just above the photosphere. They derived mass loss rates for several O dwarfs in the SMC cluster NGC 346, which are a factor of 3 to 10 smaller than those obtained from smooth winds. This reduced mass loss is expected to significantly alter the predicted evolution of these stars.
Puls et al. (1996) showed the existence of a tight correlation between the modified wind momentum and the stellar luminosity. This Wind momentum – Luminosity Relation (WLR) varies for Galactic and MC O stars because of the different metallicities. Stars with lower abundances of heavy elements have weaker winds (Walborn et al. 2000). Mass loss rates predicted using radiative line-driven wind theory bring support to the WLR (Vink et al. 2000), hence allowing a derivation of O star luminosities and of extragalactic distances. However, the dependence of the WLR with the luminosity class remains an open problem. Recent theoretical studies do not predict such a dependence while, empirically, a difference in the WLR for supergiants and for dwarfs has been found. Repolust et al. (2004) argued that this discrepancy between the empirical and theoretical WLR’s might be solved if the mass loss rates derived from H are affected by clumping in the lower wind region. Clumping would result in decreasing the mass loss rates of Galactic O stars with H emission by a factor of about .
Despite mounting evidence that hot star winds do not appear to be smooth and homogeneous, most studies still assume so with the hope of determining average wind properties at least. In MC O stars, however, spectral analyses accounting for clumping yield significantly lower mass loss rates, with potentially crucial consequences for our understanding of massive star evolution, and for the radiative line-driven wind theory and its application to extragalactic studies using the WLR. In this context, we believe that it is of special importance to extend the recent studies of MC O stars to Galactic O stars which have stronger winds. Furthermore, it is essential to show that a consistent picture may be drawn from the different diagnoses of clumping, in particular P v1118, 1128, O v1371, and H, ensuring that the spectral diagnoses of wind clumping are not spuriously affected by abundance or ionization effects.
| Star | RA | Dec | Spectral | FUSE | (H i) | ||||
|---|---|---|---|---|---|---|---|---|---|
| (J2000) | (J2000) | Type | ID | (mag) | (mag) | (mag) | (cm-2) | (cm-2) | |
| HD 96715 | 11 07 32.9 | -59 57 49 | O4V((f)) | P1024301 | 8.27 | 0.10 | 0.42 | 21.3 | 19.7 |
| HD 190429A | 20 03 29.4 | +36 01 30 | O4If+ | P1028401 | 7.12 | 0.14 | 0.51 | 21.5 | 20.3 |
In this paper, we investigate the properties of two Galactic O4 stars, HD 190429A and HD 96715, in order to derive their properties and address these issues. These two stars were chosen to cover a wide range of luminosity classes, thus investigating wind clumping in O dwarfs and in O supergiants, and to compare Galactic stars to SMC O4V stars for which Bouret et al. found evidence of clumping. The general stellar properties, along with the observational data and reduction are presented in §2. Sect. 3 considers our model atmospheres. We discuss the methodology used to derive the stellar parameters, chemical abundances, and wind parameters, and the related uncertainties, for each star, in §4. Our results are then put into a broader context in §5, comparing in particular the derived mass loss rates to other predictions based on homogeneous wind models. General conclusions are summarized in §6.
2 Stellar sample and observations
We have selected two Galactic O4 stars, HD 190429A and HD 96715, which have been previously observed in the far ultraviolet (FUV) by FUSE and IUE, to investigate the FUV spectral signatures of clumping (O v, P v). The two stars are hot enough (O4 spectral type) to reveal O v1371 in their spectrum. We have selected one supergiant and one dwarf providing an initial comparison between the two classes. The two stars are part of the FUSE atlas of Galactic O stars (Pellerin et al. 2002), from which we extracted basic stellar data (Table 1). HD 190429A is a bright O supergiant for which extensive observational and modeling work has been published (e.g., Walborn & Howarth 2000; Markova et al. 2004; Garcia & Bianchi 2004). Garcia & Bianchi (2004) recently reported the first detailed analysis of the O4V((f)) star HD 96715.
We have extracted IUE short wavelength, high resolution spectra from the Multimission Archive at the Space Telescope Science Institute (MAST). The SWP spectra cover the spectral range, 1150-2000 Å, at a resolving power . Each spectrum was processed with the NEWSIPS package. We have selected all spectra obtained through the large aperture, that is, 16 spectra for HD 190429A and 4 spectra for HD 96715 (Table 2). These spectra do not show conspicuous signs of variability, in flux as well as in line profiles. Although we cannot rule out definitively variability (in particular for the supergiant HD 190429A), this absence of variations justifies our co-adding all merged extracted spectra so as to form an average spectrum for each star. Data points flagged by the NEWSIPS software have been excluded; in particular, this concerns the saturated portion of the long-exposed images SWP 43980 and SWP 43981 at Å. Finally, we smoothed the co-added spectra to a resolution of 40 km s-1 in order to increase the signal-to-noise ratio. The spectra of both stars show a large number of narrow lines of interstellar (IS) origin. This IS contamination becomes an issue especially for HD 96715 because its apparent rotational velocity is relatively low (= 80 km s-1; Howarth & Prinja 1989).
The processed FUSE spectra have been retrieved from MAST too. The nominal spectral resolution is 20,000, or about 20 km s-1. Details about the observations and data reduction can be found in the FUSE atlas of Galactic OB spectra presented by Pellerin et al. (2002). Individual sub-exposures have been co-added for each segment and then merged to form a single spectrum, using Lindler’s FUSE-REGISTER program. We avoided contamination by the so-called worm artefact (Sahnow et al. 2000) by using only the LiF2A spectra on the long-wavelength side (1086-1183 Å) of the spectrum. Finally, the co-added merged spectra have been smoothed to a 30 km s-1 resolution to enhance the signal-to-noise ratio.
¿From the IUE and FUSE spectra, we have measured the atomic and molecular hydrogen column densities towards the two stars, fitting Ly and H2 lines, respectively. The values are listed in the rightmost columns of Table 1, indicating that the FUSE spectra suffer from severe blending from the broad absorption bands of H2. This absorption especially becomes a serious issue shortwards of 1006 Å (SiC2A channel), and thus little information about the stars can be inferred from the analysis of this part of the spectra. Furthermore, numerous IS metal lines are also present in the FUSE spectra, superimposed to the stellar lines. These lines are narrower than the stellar lines but, because of their large number (see Table 3, Pellerin et al. 2002), they may complicate the analysis of the stellar components (especially for weak lines in HD 96715).
| Star | Image | Obs. Date | |
|---|---|---|---|
| (s) | |||
| HD 96715 | SWP 21999 | 3000 | 1984-01-13 |
| SWP 22000 | 1800 | 1984-01-13 | |
| SWP 43980 | 9000 | 1992-02-13 | |
| SWP 43981 | 9000 | 1992-02-13 | |
| HD 190429A | SWP 04903 | 1515 | 1979-04-09 |
| SWP 38958 | 1500 | 1990-06-02 | |
| SWP 38965 | 1500 | 1990-06-02 | |
| SWP 38970 | 1500 | 1990-06-03 | |
| SWP 38973 | 1500 | 1990-06-03 | |
| SWP 38978 | 1500 | 1990-06-03 | |
| SWP 38981 | 1500 | 1990-06-03 | |
| SWP 38986 | 1500 | 1990-06-03 | |
| SWP 38989 | 1500 | 1990-06-03 | |
| SWP 38994 | 1500 | 1990-06-04 | |
| SWP 38998 | 1500 | 1990-06-04 | |
| SWP 39003 | 1500 | 1990-06-04 | |
| SWP 39006 | 1500 | 1990-06-04 | |
| SWP 39011 | 1500 | 1990-06-04 | |
| SWP 54573 | 1500 | 1995-05-02 | |
| SWP 55986 | 1500 | 1995-09-22 |
3 Modeling assumptions
Unified models, with a consistent treatment of the photosphere and the wind, are mandatory to analyze the P Cygni profile of strong lines in the UV spectra of O stars and, thus, to derive the basic wind parameters (mass loss rate, terminal velocity). However, the bulk of spectral lines in O stars are formed in the photosphere where velocities are small and geometrical extension is negligible. Hydrostatic, fully-blanketed, NLTE photospheric models may then remain a preferable alternative to unified models with a simplified treatment of metal line blanketing. We demonstrated this point in the case of low metallicity stars in the SMC, where stellar winds are weaker than those of Galactic stars (Bouret et al. 2003). Here, we deal with Galactic objects and, in particular, with an extreme O4If+ supergiant (HD 190429A) which exhibits a strong stellar wind. This is thus an exemplar case for studying the wind contribution to weak photospheric lines, comparing the predictions of photospheric and unified models to observations. We have performed such an analysis using model atmospheres calculated with the photospheric program, Tlusty (Hubeny & Lanz 1995), and with the unified model code, CMFGEN (Hillier & Miller 1998). The atomic data used by the two codes mostly come from the same sources, thus ensuring a meaningful comparison of the stellar parameters derived by the two codes. CMFGEN does not solve the full hydrodynamics, but rather assumes the density structure. We use a hydrostatic density structure computed with Tlusty in the deep layers, and the wind part is described with a standard -velocity law. The two parts are connected below the sonic point at km s-1. For more details on these two codes, we refer to Hubeny & Lanz (1995), Lanz & Hubeny (2003), Hillier & Miller (1998), Hillier et al. (2003), and Bouret et al. (2003).
Radiatively driven winds are intrinsically subject to instabilities, resulting in the formation of the discrete structures or “clumps”. As discussed in §1, there are several observational evidences as well as theoretical arguments that foster the concept of highly-structured winds. To investigate spectral signatures of clumping in the winds of HD 96715 and HD 190429A, and its insuing consequences on the derived wind parameters, we have thus constructed clumped wind models with CMFGEN. A simple, parametric treatment of wind clumping is implemented in CMFGEN, which is expressed by a volume filling factor, , and which assumes a void interclump medium and the clumps to be small compared to the photons mean free path. The filling factor is such that , where is the homogeneous (unclumped) wind density. The filling factor decreases exponentially with increasing radius (or, equivalently, with increasing velocity)
| (1) |
where is the velocity at which clumping starts. Hillier et al. (2003) and Bouret et al. (2003) found that clumping starts close to the photosphere. We have thus adopted, km s-1, that is, clumps start forming just above the sonic point.
The observation of strong resonance lines of highly-ionized species, like O vi1032, 1038 and N v1238, 1242, provides an indirect evidence of X-ray emission in the stellar winds. An important consequence of the X-ray and EUV shock radiation is to enhance photoionization that results in “wind superionization”. Auger processes are accounted for in calculating the wind ionization (Cassinelli & Olson 1979). X-rays probably originate from the cooling zone of post-shock regions, while shocks arise from radiative instabilities inherent to line-driven winds (Lucy & Solomon 1970; Lucy 1982; Owocki et al. 1988). X-ray emission has been observed in O-type stars of all luminosity classes (Chlebowski & Garmany 1991). To reproduce the O vi and the N v lines, we have accounted for shock-generated X-ray emission in the final modeling stage. Because the two selected stars have not been observed with X-ray satellites, we have assumed the luminosity ratios, , measured for stars of same spectral subtype and luminosity class. For HD 190429A, we have adopted = -7.1, quoted by Pauldrach et al. (2001) for the O4 I(n)f star Puppis, whose spectral and physical properties are expected to be quite similar to those of HD 190429A; for HD 96715, we have adopted = -6.6, measured for the O4V((f)) star HD 46223 (Chlebowski & Garmany 1991).
4 Spectral analysis
Following the methodology outlined in Bouret et al. (2003), we determined initial estimates of the stellar parameters with Tlusty model atmospheres (Lanz & Hubeny 2003). Subsequent analysis is performed with CMFGEN, using Tlusty parameters as initial inputs. At this stage, we still allowed for changes in the photospheric parameters, taking advantage of the realistic description of photospheric layers by CMFGEN. We always checked for consistency between Tlusty and CMFGEN determinations.
Hydrogen and helium lines in the optical spectrum are the classical diagnoses used in spectral analyses of O stars. In this paper, we present an analysis based on the far-ultraviolet spectrum exclusively. Heap et al. (2005) discussed in detail the UV lines and ionization equilibria that are good indicators of stellar parameters (effective temperature, surface gravity). Table 3 lists the most important lines used in our analysis and the quantities they are most sensitive to.
As a reference, we adopted the solar abundances from Grevesse & Sauval (1998). However, we note that significant downward revisions of the abundance of light elements in the solar photosphere have been recently proposed on the basis of a 3-D hydrodynamical model of the solar atmosphere (Asplund et al. 2004), bringing the latter values in better agreement with surface abundances of B-type stars in the solar neighborhood. In this paper, all chemical abundances are quoted by number density relative to hydrogen, or relative to Grevesse & Sauval (1998) solar values.
| Dependencies | |||
| Line | (Å) | HD 190429A | HD 96715 |
| S iv | 1073-99 | , , S/H | |
| P v | 1118-28 | , , P/H | , P/H |
| O iii | 1150-54 | , O/H | , O/H |
| C iv | 1169 | , , C/H | , , C/H |
| C iii | 1176 | , , C/H | , , C/H |
| N iii | 1182-84 | , N/H | , N/H |
| Fe vi | 1250-1350 | , , Fe/H | , , Fe/H |
| O iv | 1338-43 | , , O/H | , , O/H |
| O v | 1371 | , , , O/H | , , , O/H |
| Fe v | 1350-1500 | , , Fe/H | , , Fe/H |
| Si iv | 1393,1402 | , , | |
| C iii | 1426-28 | C/H, | |
| S v | 1502 | , , S/H | , |
| C iv | 1548-50 | , , | , , |
| Fe iv | 1500-1750 | , , Fe/H | , , Fe/H |
| He ii | 1640 | , , He/H | , He/H |
| N iv | 1718 | , , N/H | , , N/H |
| N iii | 1748-52 | , N/H | , N/H |
| C iv | 1860 | C/H, | |
| C iii | 1875-78 | C/H, | |
| N iii | 1885 | , N/H | |
4.1 HD 190429A - O4 If+
The IUE and FUSE spectra offer a broad range of ionization stages and diversity of species that may be used to constrain the effective temperature: He ii, C iii, C iv, N iii, N iv, S iv, S v, S vi, Fe iv, Fe v, Fe vi. Following Heap et al. (2005), we used in priority ratios between successive ions of C, N, O and Fe. Both the C iii1176/C iv1169 and the Fe iv/Fe v111Fe iv lines between 1500 and 1700 Å, and Fe v lines between 1300 and 1500 Å. line ratios indicate K. The Fe vi lines in the 1250-1350 Å range are quite weak at these temperatures. Moreover, the N iii981-991 lines are found to be very sensitive to , as noticed by Crowther et al. (2002b), and they set a lower limit K. The ionization ratio, O iv1338-1343/O v1371, further supports this lower limit on . On the other hand, Si iv1393-1402, which are also very sensitive to temperature, suggest K. It is unlikely, however, that a contamination of the IUE spectrum by the companion is responsible for this lower value. Indeed, the large IUE aperture contains both the primary and the companion HD 190429B (at ), but the O9.5 II spectral type of the companion (Walborn & Howarth 2000) implies that its contribution remains small (the luminosity ratio should be about 5). Overall, we found that the best fit is achieved for = 39,000 K, with an uncertainty better than 1000 K. This value is in excellent agreement with the results from Markova et al. (2004), who used a calibration of with the spectral type based on results obtained from the analysis of hydrogen and helium lines in the optical spectrum (Repolust et al. 2004). On the other hand, Garcia & Bianchi (2004) derived a slightly lower value, = 37,500 K, based on UV lines formed in the wind. These lines are sensitive to the detail of the wind ionization, hence to wind clumping that Garcia & Bianchi neglected. Moreover, they used carbon and oxygen lines assuming solar abundances while admitting that these two species might have highly non-solar abundances (see below).
Our initial estimate of the surface gravity comes from the relation between the spectral type and for luminosity class I stars (Fig. 2, Markova et al. 2004). This relation yields = 3.65 for an O4 supergiant. We then explored models with ranging from 3.5 to 3.75 (by steps of 0.05 dex, for fixed at 40,000 K). We found that the shape of the observed spectral energy distribution is indeed best reproduced for (see Lanz & Hubeny 2003, for the dependence of the SED as a function of , at a given ). We have adopted, = 3.6, for the rest of the analysis.
The visual photometry listed in Table 1 pertains to both components A+B. Based on the Hipparcos magnitude difference of the two components, Walborn & Howarth (2000) obtained for component A alone. The absolute visual magnitude is then derived, assuming a distance kpc for the CygOB3 association (Humphreys 1978). The stellar luminosity is calculated by applying a bolometric correction from Lanz & Hubeny (2003). The derivation of the stellar radius then follows straightforwardly.
The microturbulent velocity, , is determined from the iron line strengths (Fe iv and Fe v). The iron abundance is kept to the solar value throughout this analysis. As noted in Hillier et al. (2003) and in Bouret et al. (2003), O iv1338-1343 is also sensitive to . However, the oxygen abundance may have a non-solar value at the surface of an O4 If+ star (see below). A consistent fit to the aforementioned lines is obtained for = 15 km s-1. We note that these lines have been similarly used in other studies (Bouret et al. 2003; Heap et al. 2005), yielding a range of microturbulence values for O stars ( = 2–25 km s-1). It is therefore unlikely that the high microturbulence derived here results from inadequate model atoms.
.
The helium abundance is poorly constrained by the FUV spectrum alone. We first used = He/H = 0.1 (by number), but subsequently we increased the abundance to = 0.2. The higher helium abundance provides a better fit to He ii1640 (once the mass loss rate is fixed at the value derived from other lines). The photospheric He ii1085 line, which is not affected by the wind in our models, could not be used because of strong blends from IS N ii lines. The enhanced helium abundance is consistent with the evolutionary status of an O4 supergiant (Meynet & Maeder 2000), but we cannot rule out that it may be further revised when optical data is analyzed in addition to the FUV spectrum. A simultaneous fit of all He i and He ii lines throughout the spectrum is, however, rarely (if ever) achieved (see, e.g., Hillier et al. 2003). Additionally, we note that changes in the helium abundance impact the predicted P v1118-1128 lines, because the ionization threshold of P v is at 191 Å, close to the He ii Lyman limit. Models with = 0.2 yield a phosphorus abundance that is closer to the solar value compared to values derived with models. On the basis of these various arguments, we finally adopted = 0.2.
The carbon abundance is constrained by the C iii1176, C iii1923, and C iv1169 photospheric lines. Only models strongly depleted in carbon match these lines. A low carbon abundance is also consistent with the C iii977 and the C iv1548-1550 resonance lines, although these lines are not sensitive indicators because they show saturated P Cygni profiles that are only weakly sensitive to the wind velocity law. We also checked that the models do not predict a strong C iii4647-51 emission that is not observed in the optical spectrum (Walborn & Howarth 2000). The best fit to the lines discussed above is obtained for C/C⊙ = 0.05. This value is consistent with the evolved nature of HD 190429A.
All nitrogen FUV lines, but N iv1718, show that the surface of HD 190429A has been enriched in nitrogen. This conclusion is additionally supported by the observed N iii4634-4640 emission (see, e. g., Walborn & Howarth 2000). We have derived a nitrogen surface abundance, N/N⊙ = 4.0. The nitrogen enrichment of HD 190429A is consistent with its being highly evolved, as significant nitrogen enrichment together with carbon depletion is predicted by stellar evolution models for stars in the helium burning phase. Note in this respect that Conti et al. (1995) and Walborn & Howarth (2000) already suggested an advanced evolutionary status for HD 190429A based on K-band and optical data (respectively), which they interpreted as indications that the star is well advanced toward the WN stage.
The lack of wind-insensitive oxygen lines hampers an accurate determination of the oxygen abundance. The strong O vi1032-1038 are fully controlled by the X-ray flux and other wind parameters. The O v1371 line is rather weak and is most sensitive to the mass loss rate and clumping parameters. Finally, although mostly formed in the photosphere, the O iv1338-1343 lines show a blue asymmetry that indicates a contribution from the wind. Assuming = 15 km s-1 (see above), we had to adopt a low oxygen abundance, O/O⊙ = 0.1, in order to match the O iv1338-1343 lines. However, we always failed to reproduce the O v1371 line with homogeneous wind models. This low abundance is also supported by the weak O iii triplet (1150-1154 Å) in the FUSE spectrum.
Phosphorus and sulfur abundances are not expected to be affected by nucleosynthetic processes. We thus adopted initially (and kept for most of the analysis) solar abundances. There are, however, indications that both elements might be slightly depleted. For homogeneous wind models, a low phosphorus abundance, P/P⊙ = 0.1, is required to match the P v1118-1128 resonance doublet. On the other hand, we derive P/P⊙ = 0.5 from a clumped model with a filling factor (see below). All sulfur ions indicate that S/S⊙ = 0.5 for homogeneous models and S/S⊙ = 0.9 for clumped models (). Similarly, Hillier et al. (2003) derived lower than one-fifth solar-scaled P and S abundances for the SMC O7 Iaf+ supergiant AV 83. However, given the recent downward revision of the solar P and S abundances (Asplund et al. 2004), we argue that the abundances derived from the clumped wind model roughly remain in agreement with solar values within the uncertainties (0.1 to 0.2 dex).
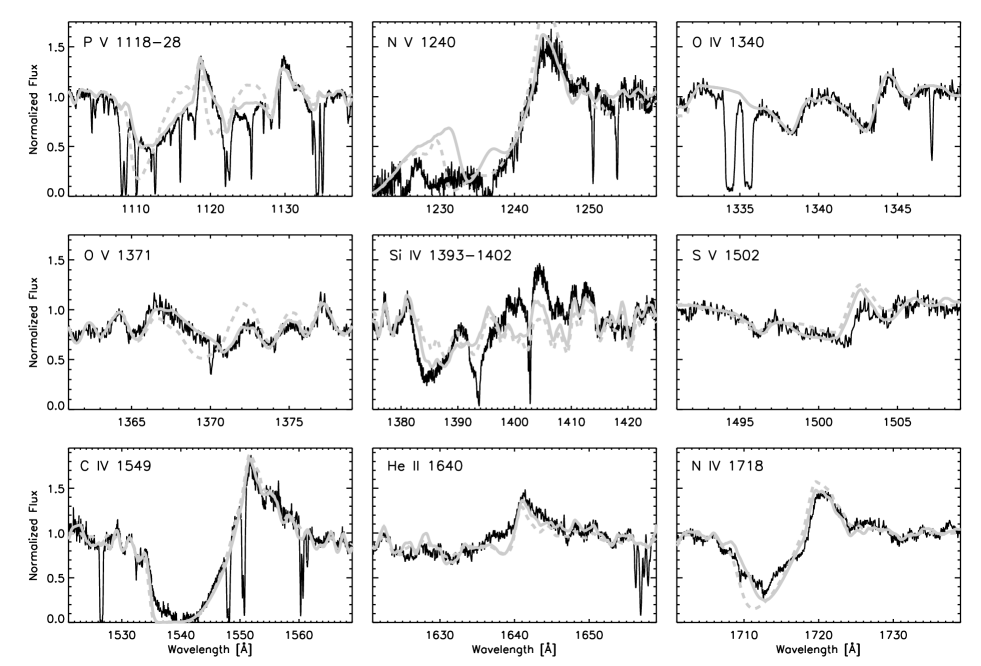
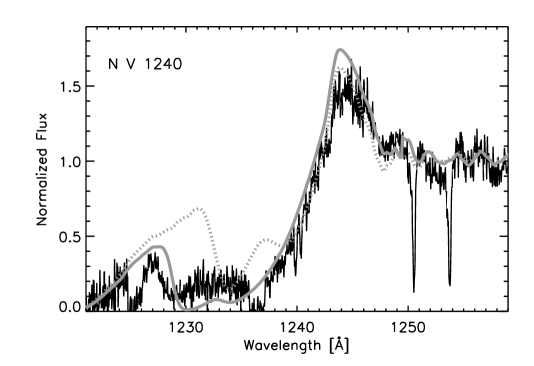
. The short wavelength side of N v1240 is affected by interstellar Ly absorption (see Table 1 for n(H i)). Notice in particular the excellent fit to both lines of the P v doublet achieved with the clumped wind model.
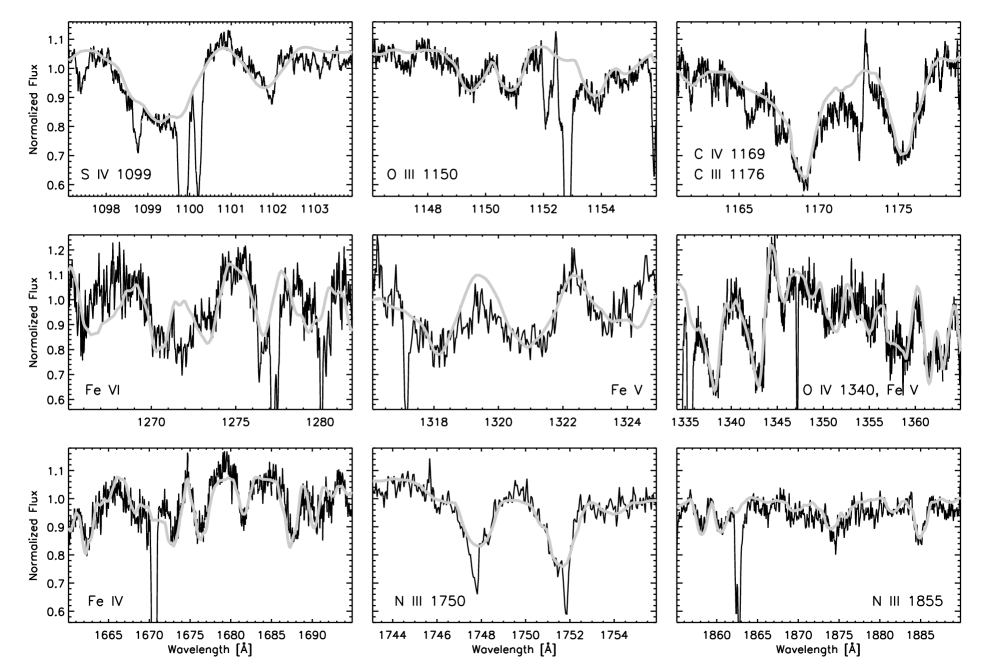
A detailed examination of the complete FUV spectrum reveals that only a few lines are influenced by the stellar wind, even for a supergiant with such an early spectral type and strong wind ( few M⊙ yr-1). In particular, these lines include a few strong Fe lines whose cores are filled a little by wind emission. For most other lines, we have a very good consistency between Tlusty and CMFGEN model spectra. This agreement demonstrates that we may use NLTE photospheric models to derive reliable stellar parameters and abundances, even for Galactic O supergiants with relatively dense winds. Furthermore, we stress that we had to use large ( = 15 km s-1) microturbulent velocities in CMFGEN wind models too. Despite an early comment by Kudritzki (1992), this demonstrates that the need for microturbulence is not restricted to hydrostatic models that neglect the atmospheric velocity field. We display in Fig. 1 the best CMFGEN model fit to some of the lines discussed above, which are only weakly sensitive to the wind properties.
We now turn to the analysis of the wind properties of HD 190429A. The parameters of the -type velocity law are derived from the saturated C iv1548-1550 doublet and from the N iv1718 P Cygni profile. A good match is achieved for = 0.8 and = 2300 km s-1. We have used an outward increasing microturbulence velocity from the photospheric value (15 km s-1) to a maximum of 200 km s-1.
To derive the mass loss rate, we started with an estimate based on H modeling, = 1.4 10-5 M⊙ yr-1 (Markova et al. 2004). Such a high value can be excluded from the FUV spectrum, because a wind model assuming this value predicts much stronger P Cygni profiles than those observed. Furthermore, this model also produces asymmetric Fe iv and Fe v lines with a blue extended absorption that is not observed. Garcia & Bianchi (2004) derived such a high mass loss rate value from the UV wind lines. However, from their Fig. 7, we see that their model predicts C iii1176 and O iv1340 emissions that are not observed. Generally, all other wind lines are also predicted too strong by their model. We then built a series of wind models, decreasing in several steps. Using homogeneous wind models, we have not been able to achieve a good match to most observed P Cygni profiles and to other wind sensitive lines like O iv1338-1343 and He ii1640.
Therefore, we switched to clumped wind models with the presumption that the high mass loss rate derived by Markova et al. (2004) was the result of the effect of clumps on H line formation (as already suggested by Repolust et al. 2004). We searched thus for a combination of and , keeping / 1.4 10-5 M⊙ yr-1. The best match to the FUV lines was obtained for = 1.8 10-6 M⊙ yr-1and (see Fig. 2). The fit to P v1118-1128 and to O v1371 line profiles are the most striking improvements achieved with the clumped wind model. The agreement with the observed profile gets also better for N iv1718, while there are little profile changes for the C iv resonance doublet or He ii1640 compared to profiles predicted by a homogeneous wind model. The sensitivity of P v lines to clumping was first established by Crowther et al. (2002b) and Hillier et al. (2003). We defer to §5 a discussion of the physical implications of clumping on line formation.
Other wind line profiles, such as O vi1036 and N v1240 are strongly influenced by X-ray wind emission (see §5.2 and Fig. 7), and provide little additional constraints on the mass loss rate or on the clumping properties of the wind of HD 190429A. P Cygni profiles of lower ions, like C iii977 or N iii991, are severely blended with H2 lines that hamper an accurate determination of from these lines.
4.2 HD 96715 - O4 V((f))
The IUE spectrum of HD 96715 exhibits conspicuous lines of Fe vi (1250-1350 Å), Fe v (1300-1550 Å) and Fe iv (1550-1700 Å), as well as O iv1338-1343, C iii1426-1428 and S v1502. The FUSE spectrum shows C iv1169 and C iii1176 lines, as well as O iii1150-1154, S iv1073-1099. The lines are relatively narrow, implying an apparent rotational velocity, = 80 km s-1, and resulting in less severe blending problems from iron lines.
Using the ionization balance between these ions, we derived a best overall match with a Tlusty model having = 43,500 K and = 4.0. A realistic estimate of the uncertainty on the determination is about 1500 K. On the other hand, the sensitivity of the FUV spectrum to is small. We can, however, firmly exclude models with gravities differing by 0.25 dex in , based on the comparison of theoretical spectral energy distributions with the IUE spectrum corrected for reddening (assuming , Table 1). The best overall agreement is obtained for models with = 3.9 0.1. The relation between spectral type and surface gravity for luminosity class V stars (Markova et al. 2004) yields = 3.9 in agreement with our estimate within the error bars. We have finally adopted = 4.0, see Table 4.
Garcia & Bianchi (2004) obtained a markedly lower value, = 39,0002,000 K. They established upper and lower temperature limits from the absence of P v1118, 1128 and O v1371. In particular, the weakness of the O v line constrains 40,000 K. Homogeneous wind models predict a very strong O v feature at temperatures higher than 40 kK, thus forcing an artificially low to be adopted. Garcia & Bianchi methodology yields temperatures that are systematically lower than all other recent analyses of optical and UV spectra of O stars (see Heap et al. (2005) and Martins et al. (2005) who provide a detailed comparison of these studies and who are led to exclude Garcia & Bianchi results). We believe that their methodology underestimates temperatures because of the reliance on wind lines that are sensitive to the wind structure and abundances as well as to .
We adopted the absolute magnitude, , from Howarth & Prinja (1989), and derived the stellar luminosity and radius using a bolometric correction from Lanz & Hubeny (2003). The stellar mass then follows from and .
The microturbulent velocity has been derived from O iv, Fe iv, Fe v, Fe vi, and S v lines. The best match is obtained for = 15 km s-1, assuming solar abundances for these species, consistently with the expected evolutionary status of HD 96715.
We started the analysis using a normal helium abundance, . Subsequently, we slightly decreased it to = 0.09 to improve the match to He ii1085 and He ii1640. Admittedly, this value should be considered as a provisional estimate until an analysis of the optical spectrum becomes available. Yet, there is no evidence of helium enrichment at the surface of HD 96715.
The carbon abundance was derived from the photospheric lines, C iv1169, C iii1176, and C iii1426-1428. Using a Tlusty model with the stellar parameters previously derived, we found that C/C⊙ = 0.5 matches well these carbon lines.
Like HD 190429A we constrained the nitrogen abundance from N iii1182-1184 and N iii1748-1752. We found that an enhancement of a factor of 4 with respect to the solar value is required to match the observed lines. Note that wind lines such as N iv1718 further support this determination since no match can be achieved without a significant nitrogen enrichment. Our result is also consistent with a line blend, N ii1084-1086, although the presence of superimposed IS lines makes the determination of the photospheric contribution difficult.
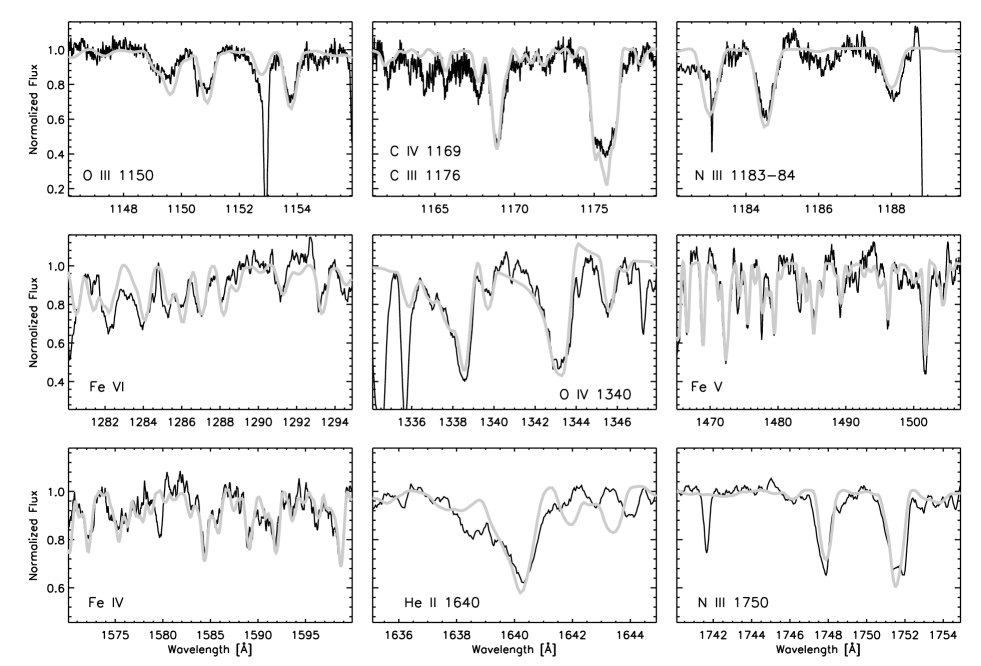
To measure the oxygen abundance, we relied on O iii1150-1154 photospheric lines, which are clearly seen in the FUSE spectrum. A very good fit to this triplet is obtained for O/O⊙ = 0.9, which also results in a good fit of O iv1338-1343. Fig. 3 displays the best model fit achieved with CMFGEN to the photospheric lines discussed in this section.
The wind velocity law has been determined on the saturated P Cygni profile of C iv1548-1550. The terminal velocity and maximum turbulent velocity have been measured on the blue-side of the absorption component; we have adopted a terminal wind velocity, = 3000 km s-1, and a maximum turbulent velocity in the wind of 250 km s-1. The P Cygni profile of C iv1548-1550 was preferred to N v1240 because the latter is affected by a significant contamination due to IS Ly and because of its well-known sensitivity to X-rays. The wind acceleration parameter, , and the mass loss rate have been inferred from the P Cygni profiles of C iv1548-1550 and N iv1718 together with other wind sensitive lines like O iv1338-1343 and He ii1640. For the adopted abundances, we found that a homogeneous wind model with = 0.8 and = 1.8 10-6 M⊙ yr-1 reproduces well these lines, although the match to N iv1718 remains poor.
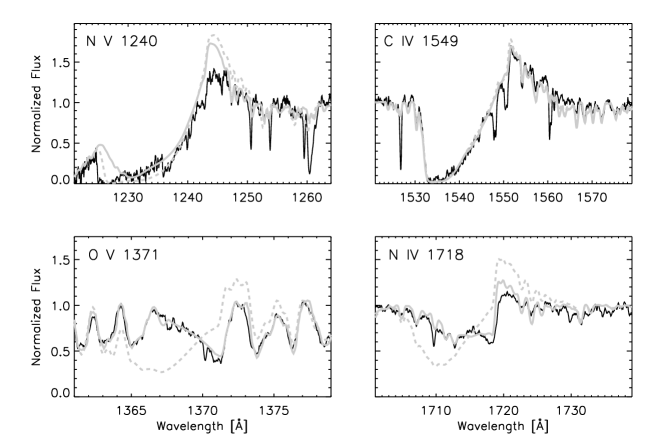
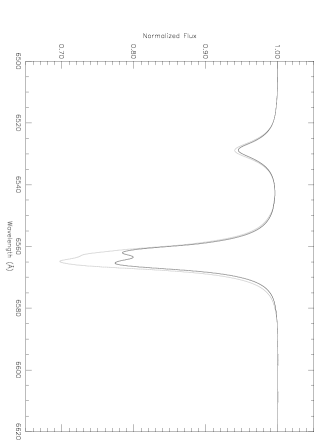
On the other hand, the O v1371 line profile predicted by homogeneous wind models is stronger than observed. This behavior has been found in all previous studies of O-type stars that show O v1371. More specifically, the wind models predict too strong absorption at moderate velocities, too little absorption at low velocities, and a too strong redward emission. Homogeneous wind models thus fail to reproduce this line as in our earlier study of main-sequence O stars in the SMC (Bouret et al. 2003). Therefore, we have calculated several models with different clump volume filling factors , adjusting the mass loss rate so as to maintain a good fit to C iv and N iv P Cygni profiles. Fig. 4 shows that we can achieve a good match of O v1371 when assuming a very small filling factor, , with a mass loss rate, = 2.5 10-7 M⊙ yr-1. A larger filling factor, , and a lower oxygen abundance by a factor of 4 also improves over the case of a homogeneous wind model, but does not fit the observed profile as well as a model with the smaller filling factor. Larger volume filling factors may seem more reasonable or, at least, they are more in line with earlier studies of Wolf-Rayet clumped winds (Hamann & Koesterke 1998) and of SMC O stars (Bouret et al. 2003). However, other oxygen lines, like O iii1150-1154 and O iv1338-1343, are no longer fitted with the lower oxygen abundance. These lines are indeed sensitive to changes in the adopted oxygen abundance since they are unsaturated. There is no compelling reason for adopting an oxygen abundance lower by a factor of 4 relative to the solar value, especially since carbon is not depleted as well. Carbon would indeed be expected to show first a depletion typical of CNO-cycle processed material. We have therefore adopted the clumped model with the very small volume filling factor.
The steep transition between the absorption and emission components indicates that clumps start forming at low velocities, km s-1, just above the sonic point. At this point, we discovered that N iv1718 behaves similarly to O v1371, and is thus sensitive to wind clumping too. The fit to N iv1718 is improved by using clumped wind models, especially at the transition between the absorption and emission components. The extended blue absorption is affected similarly to O v1371. The nitrogen abundance has been kept to the value derived from photospheric lines. Finally, we stress that we have achieved a good match of both the N iv and the O v lines using the same low filling factor for the clumps, which thus provides convincing support for the highly clumped model. The profile of other lines (C iv and N v) is not directly affected by clumping.
5 Discussion
Table 4 summarizes the results of our analysis. Conservative estimates of the uncertainties are 5% on , 0.1 dex on , 2 to 5 km s-1 on (for HD 190429A and HD 96715, respectively), and 0.1 to 0.2 dex on chemical abundances. Abundances are listed as number densities and refer to values adopted in clumped wind models (lower abundances might be preferred with homogeneous wind models in a few instances, see §4). The mass loss rates are derived with an accuracy of 10-20 % from the fitting process, though this does not include systematic errors. We discuss now the implications of our results, and compare them to other observational and theoretical studies.
5.1 Evidence of clumping from the FUV spectrum
¿From the foregoing analysis, we conclude that P v1118-1128 and O v1371 provide the best diagnostics of clumping in the wind of O stars, supporting the seminal studies of Crowther et al. (2002b), Hillier et al. (2003) and Bouret et al. (2003), and extending them to the case of Galactic stars. In attempting to reproduce the O v1371 line profile, Bouret et al. explored a number of alternative explanations besides clumping. They emphasized that the key point consists in predicting the correct O v/O iv ionization structure in the vicinity of the sonic point. To alter ionization, they considered X-ray emission from shocks in the wind (), adiabatic cooling, larger model atoms, and alternate recombination rates (Nahar 1999). All these changes resulted in essentially no difference in the model spectrum, and wind clumping remained as the only viable explanation.
| Star | HD 190429A | HD 96715 |
|---|---|---|
| Spectral Type | O4 If+ | O4 V((f)) |
| [K] | 39000 | 43500 |
| (cgs) | 3.6 | 4.0 |
| [] | 7.9 | 4.6 |
| [km s-1] | 15 | 15 |
| [km s-1] | 160 | 80 |
| Homogeneous winds | ||
| [M⊙ yr-1] | 6.0 | 1.8 |
| [km s-1] | 2300 | 3000 |
| 0.8 | 1.0 | |
| Clumped winds | ||
| [M⊙ yr-1] | 1.8 | 2.5 |
| 0.04 | 0.02 | |
| Surface abundancesa | ||
| (He/H) | 0.2 | 0.09 |
| C/C⊙ | 0.05 | 0.5 |
| N/N⊙ | 4.0 | 4.0 |
| O/O⊙ | 0.1 | 0.9 |
| Si/Si⊙ | 1.0 | 1.0 |
| P/P⊙ | 0.5 | 1.0 |
| S/S⊙ | 0.9 | 1.0 |
| Fe/Fe⊙ | 1.0 | 1.0 |
| N/Cb | 80 | 8 |
-
a
Solar abundances from Grevesse & Sauval (1998).
-
b
Abundance ratio relative to the solar ratio, N/C 0.25.
The case of P v is different. Crowther et al. (2002b) and Hillier et al. (2003) showed that an effect on the line profile similar to clumping could be obtained by drastically reducing the phosphorus abundance because P v reaches its maximum and is the dominant ion throughout the wind of late O supergiants. Hillier et al. (2003) achieved a good match to the observed P v doublet in the SMC O7Iaf+ supergiant AV 83 with homogeneous wind models using a low abundance P/P (compared to the adopted overall SMC metallicity, Z/Z). While there are remaining uncertainties relative to the phosphorus abundance baseline and the chemical evolution of the Magellanic Clouds leaving thus some leeway toward a definitive conclusion, we note that Pauldrach et al. (1994, 2001) similarly claimed that two Galactic supergiants, namely Puppis (O4 I(n)f) and Cam (O9.5 Ia) must have a very low phosphorus abundance based on their analysis of Copernicus data. In the case of Galactic stars, a low phosphorus abundance seems a much less likely explanation of the weak P v resonance lines, and we thus speculate that Pauldrach et al.’s results actually indicate that Puppis and Cam also possess a highly-clumped wind. Our study shows that clumping combined with a slightly reduced phosphorus abundance is required to match the P v resonance doublet in HD 190429A, while still fitting well the rest of the spectrum. Hillier et al. (2003) also achieved an excellent match of the full spectrum (from FUV to the optical) of AV 83 using = 0.1 and P/P⊙ = 0.08, but the evidence for a lower phosphorus abundance remains relatively weak because of the possibility of adopting a lower clump filling factor coupled to a higher abundance. These results, therefore, only hint at a depletion of P in O supergiants with respect to the other metal abundances.
In addition to O v and P v, we finally found that N iv1718 is also an indicator of wind clumping. The N iv line profile exhibits the same behavior as O v1371. The two lines correspond to the same transition, 2s(2S)2p 1P0 – 2p2 1D, in an isoelectronic sequence. The O v and the N iv lines can be fitted with a clumped wind model having the same clumping parameters.
For both stars, we found small volume filling factors, and 0.02, for HD 190429A and HD 96715, respectively. Although these small values may seem problematical, they are supported by other recent results about wind clumping. In the analysis of 25 O stars in the LMC, Massa et al. (2003) found that the P v ionization fraction never exceeds 0.20, although it is expected to be the dominant stage in some of the stars. They argued that this implies either that the calculated mass loss rates or the phosphorus abundance are too large, or that the winds are strongly clumped (). The first evidences of wind clumping were found in WR stars for which small filling factors () were derived too (Hamann & Koesterke 1998; Hillier & Miller 1999; Crowther et al. 2002a). Kurosawa et al. (2002) and Schild et al. (2004) derived even lower values, , for the WR stars V444 Cyg and Vel. Hydrodynamical 1-D calculations of line-driven wind instabilities support low volume filling factors (; Runacres & Owocki 2002), but initial results of a restricted 2-D approach indicate larger values (; Dessart & Owocki 2003).
5.2 Effect of clumping on wind ionization
We now examine the reasons why these line profiles are modified by clumping. Essentially, the presence of optically thick clumps separated by transparent voids has two major consequences: (i) the wind over-densities strengthen the emission of density-sensitive lines; (ii) the number of recombinations increases because of the higher density in the clumps, thus reducing ionization. The competition between these two effects may either increase or decrease emission. Because of the radial dependence of the volume filling factor, lines of different strength behave in different ways. This is shown in Fig. 2 and Fig. 4 where profiles for clumped and homogeneous models are compared for HD 190429A and HD 96715.
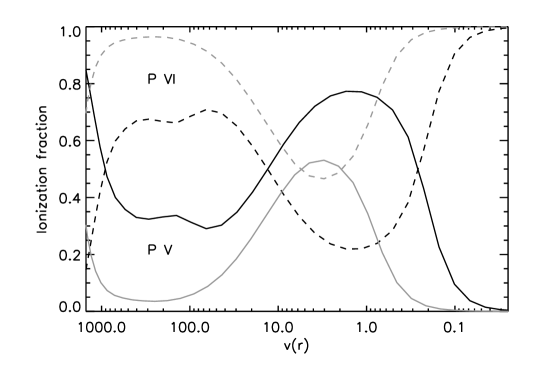
In O7 supergiants, P v is the dominant ionization stage of phosphorus throughout the wind (Hillier et al. 2003). However, HD 190429A being a hotter supergiant, P v (in the photosphere) and P vi (in the wind) are now the main ionization stages. The P iv fraction always remains small (less than 1%). Figure 5 illustrates the effect of clumps in the stellar wind: we find a lower ionization, P vi/P v, compared to the homogeneous wind model, demonstrating the increased recombination from P vi to P v in the clumps. In HD 190429A, the P v1118-1128 resonance lines reflect the factor of 2 between the -values of the two lines, thus indicating that these lines are unsaturated. The interpretation of the strength of these lines is, however, not straightforward, that is, it depends not only on the phosphorus density (a product of the mass loss rate and the phosphorus abundance), but it also depends on the detail of the wind ionization. The dependence with the clumping parameter, , is indirect through the requirement that the ratio / has to remain constant for keeping a good match to other lines, such as H and C iv1550. A low phosphorus abundance (P/P) must be adopted with a homogeneous wind model, thus implying significant clumping (low , hence low ) is necessary to increase the phosphorus abundance to a near-solar value. Massa et al. (2003) followed the same argument to explain the systematically low P v ionization fractions (20%) that they derived for 25 O stars in the LMC. We stress that our clumped wind model matches the two P v resonance lines very well, providing a strong evidence that the wind ionization is correct and that there is no particular issue such as covering factors with our treatment of clumps.
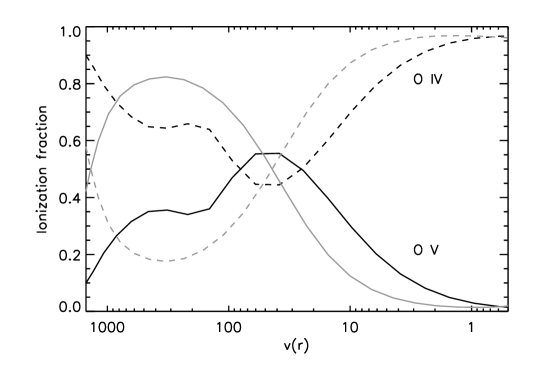
The oxygen lines, however, respond in a different way to clumping. They are affected by clumping via a lower ionization in the wind – see Fig. 6 for HD 96715. Notice that ionization in fact is not lower in the photosphere as Fig. 6 would suggest: there is a shift in velocity space because of the higher mass loss rate of the homogeneous wind model. At similar photospheric densities, the ionization is the same. On the other hand, O iv is the dominant ion throughout the wind of HD 190429A. The homogeneous model predicts an increase of O v at moderate velocities (over 30% at few 100’s km s-1), but increased recombination due to the presence of clumps keeps the O v fraction below a few percent in the clumped wind. The lower O v fraction in the clumped wind models weakens the blue-shifted line absorption substantially. The wind ionization is sensitive to the clumping parameter, , and O v1371 is the best indicator of clumping in the wind of HD 96715, similarly to the SMC O4 stars (Bouret et al. 2003).
Besides the O v and P v lines, we found that N iv1718 is also sensitive to clumping. It is a special interest because clumping decreases N v/N iv ionization in a way quite similar to O v/O iv. N iv is the dominant ion throughout the wind of HD 190429A, while it is the dominant ion only in the photosphere of HD 96715 (N v is the dominant stage in the wind). The N iv1718 responds to clumping like O v1371. The absorption component of N iv1718 is globally weaker in the clumped model, with the exception of velocities between 15 km s-1 and 650 km s-1 (Fig. 4). The direct mapping of the velocity law on the absorption component implies that these velocities correspond to the region where N v/N iv ionization is lower in the clumped model. In the outer wind, at higher velocities, N v recombines into N iv in the homogeneous and clumped models of HD 96715 because of lower temperatures. The predicted profile at these high velocities ( km s-1) then reflects the higher mass loss rate adopted for the homogeneous wind model.
Several other lines are displayed in Fig. 2, showing smaller changes because of clumping. For instance, S v1502 shows a slightly stronger blueshifted wing because of increased recombination from S vi to S v. On the other hand, the C iv resonance doublet is only marginally sensitive to clumping because these lines are saturated.
X-ray emission in the wind also changes the wind ionization structure, increasing the populations of “superions” like N v, O vi, and S vi. We found that the profiles of N v1240 and O vi1036 are substantially changed by X-ray emission (see Fig. 7; the O vi lines are not shown because of strong interstellar H2 absorption). All other FUV lines shown in Fig. 2, especially those sensitive to wind clumping, remain unaffected. In the outer wind of HD 190429A ( km s-1), the N v is increased by a factor of several up to several orders of magnitude at terminal velocity by the X-ray wind-shock emission compared to predictions neglecting X-rays. In the inner wind ( km s-1), N v increase is more modest (20% compared to predictions without X-rays). The N v fraction reaches about 10% in the inner wind and always remains larger than 1% in the outer wind while it precipitously drops in the model without X-rays. This change in the wind ionization structure results in the marked line profile change displayed in Fig. 7.
Finally, we need to stress here that clumping is not a simple numerical trick introduced to correct the ionization balance of a single species (e.g., O v/O iv). We showed here that our clumped models change in a consistent way the ionization balance of different species, with different ionization potentials, and affect the corresponding lines differently as they form in different parts of the wind and respond differently to the nature of clumping in the wind. We therefore conclude that our description of wind clumping, albeit simple, must be basically correct because of our ability to fit lines of different ions and species using the same clumping parameters. The clumped wind models therefore provide a sound basis for determining improved mass loss rates.
5.3 Clumping, H, and the mass loss rate
We discuss now the implication of wind clumping on the derived mass loss rates, comparing our results based on the analysis of the FUV spectrum with determinations based on H and thermal radio emission. Such a comparison is essential because the quantity that is actually measured from the FUV lines is the product of the mass loss rate by the appropriate ionization fraction, and we just argued that clumping results in changing the mean ionization in the wind. We believe that CMFGEN models provide a reliable description of the ionization structure of O star winds thanks to the detailed, unified treatment of NLTE metal line blanketing in the photosphere and in the wind. Yet, a comparison with results derived from H is crucial since the latter are much less sensitive to many factors influencing the wind ionization. Moreover, the FUV lines behave linearly with the wind density while H and the radio emission have a quadratic dependence.
H is a recombination line, and is sensitive to the densest regions of the wind. Therefore, this line is expected to constrain clumping deep in the wind. On the other hand, thermal emission in the radio probes the outer regions of the wind. Kudritzki & Puls (2000) argued that H should not be sensitive to wind clumping contrary to the submillimeter/radio emission because they expected clumps to form far out in the wind. This is contrary to our findings that clumps already form close to the sonic point.
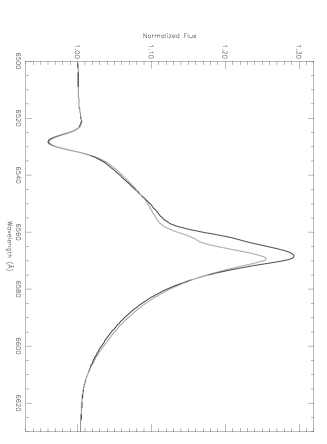
Although we have no H observations in hand, we can compare our predictions for homogeneous and clumped wind models with published results for HD 190429A. We display in Fig. 8 the predicted H profiles calculated with the parameters derived from our analysis (see Table 4). We found only little changes between the predicted profile for the homogeneous and clumped wind models, thus indicating that H observations alone would not exclude one or the other model (but different mass loss rates would be inferred). Our predicted line profiles are consistent with Walborn & Howarth’s (2000; their Fig. 2) published profile.
Table 5 lists the mass loss rates derived from H and radio observations and compares them to our results. The mass loss rates (H and radio) depend on the adopted distance, proportionally to (e.g., Scuderi et al. 1998). The values listed in Table 5 have been corrected of this dependence. The mass loss rate for a homogeneous wind derived from the FUV lines is consistent with earlier analyses of H (Leitherer 1988; Lamers & Leitherer 1993), but Scuderi et al. (1998) and Markova et al. (2004) derived a value twice as large. Unified comoving-frame models were used by Markova et al. and in our study, while the other analyses used the Sobolev approximation. Scuderi et al. (1998) also report an increase by a factor of 2 of the H equivalent width between 1988 and 1991. They obtained also a single observation of the free-free emission at 8.45 GHz. It is therefore difficult to reach a firm conclusion from this comparison since intrinsic stellar variability most likely is at the origin of some of the differences. The main conclusions thus remain that (i) the profile from the clumped wind model would match the observed H profiles as well as the predicted profile from the homogeneous wind, and (ii) the derived mass loss rate from the clumped wind model is a factor of 3 lower.
Finally, hydrogen infrared recombination lines such as Br and Br may be strongly affected by clumping in the wind, because of their sensitivity to the square of the local density. As pointed out by Lenorzer et al. (2004), clumping results in increased recombination rates inside the clumps (, assuming an infinite contrast of the clumps with the voids). The presence of clumps deep in the wind would thus explain the present discrepancies between observed and theoretical profiles (and EWs) of lines such as Br (Lenorzer et al. 2004). Indeed, clumping close to the photosphere (where Br forms) would increase the collisional excitation rates driving the excitation ratios closer to LTE. These recombination lines would thus exhibit (pure) emission profiles rather than P Cygni profiles (cf. Puls et al. 1996). An interesting point noted by Lenorzer et al. (2004) is that their predicted Br agree fairly well with observations. This suggests that the degree of clumping might not be constant throughout the wind, but rather peaks and then decreases further out in the wind. The location of the strongest clumping (expected to depend on the maximum line strength according to Runacres & Owocki (2002)) might then be in the region where Br forms. Br which forms over a larger volume (because of its larger oscillator strength) would then be less affected by clumping.
| Star | HD 190429A | HD 96715 |
|---|---|---|
| Mass Loss Rates [ M⊙ yr-1] | ||
| This study (far-UV) | ||
| Clumped wind | 1.80.3 | 0.250.05 |
| Homogeneous wind | 6.0 | 1.8 |
| H | ||
| Leitherer (1988) | 9.8 | |
| Lamers & Leitherer (1993) | 5.4 | |
| Scuderi et al. (1998) | 11.81.8 | |
| Markova et al. (2004) | 14.2 | |
| Radio | ||
| Scuderi et al. (1998) | 7.20.9 | |
| Modified Wind Momentum | ||
| ( | ||
| Clumped wind | 29.07 | 28.21 |
| Homogeneous wind | 29.66 | 29.07 |
| Repolust et al. (2004) | 29.54 | 29.11 |
| Vink et al. (2000) | 29.55 | 29.13 |
Our estimate of for HD 96715 derived from the homogeneous wind model compares well to mass loss rates for stars of same spectral type (Lamers & Leitherer 1993; Repolust et al. 2004). H is always observed in absorption for these stars, which is predicted both for the clumped and homogeneous wind models. Fig. 9 shows that H is somewhat filled by wind emission for the homogeneous wind model, but it remains unlikely that either model could be excluded based on H observations. The clumped model yields a mass loss rate that is 7 times lower than the value derived from the homogeneous wind model.
5.4 The Wind-momentum Luminosity Relation
The presence of clumps deep in the wind of O stars has been recently invoked by Puls et al. (2003) and Repolust et al. (2004) to explain their findings of two distinct Wind-momentum Luminosity Relations (WLR) for stars with H in emission and in absorption, respectively. While the WLR for the latter objects agrees with Vink et al. (2000) theoretical predictions, it is clearly separated from the empirical WLR for emission-line objects by a significant offset. As shown in Markova et al. (2004) and Repolust et al. (2004), this offset practically vanishes when the mass loss rates for the emission-line stars are reduced by a factor of 0.44. Because clumped winds mimic winds with higher mass loss rates, these authors suggested that the higher empirical WLR for emission-line objects reflects the influence of clumps in the H line formation region.
From our analysis, we conclude that mass loss rates from the homogeneous wind models are very similar to those predicted by the Vink et al. (2000) formula using the parameters derived for HD 190429A and HD 96715. Table 5 lists Vink et al.’s predicted modified wind momenta together with the values derived from our analysis. As might be expected from the lower mass loss rates derived from the clumped wind models, the wind momenta calculated from these models are significantly lower than the theoretical predictions. Our results cast doubt on Repolust et al. (2004) and Markova et al. (2004) tentative suggestion to lower supergiant mass loss rates in order to reunify the empirical WLRs with the theoretical one. We have indeed shown that a correction for clumping is required even for dwarfs that are expected to show H in absorption (or partially filled in by wind emission). This, in turn, implies that the mass loss rates should be lowered, leaving thus a difference between the supergiant and dwarf WLRs. Moreover, Repolust et al. (2004) mention that the blue Balmer lines in stars with H emission show too much wind emission in their cores, pointing to too high H mass loss rates. Clumps at the base of the wind might account for this behaviour. We finally note that the existence of a relatively deep-seated clumped region is compatible with recent, theoretical results (e.g. Feldmeier et al. 1997; Owocki & Puls 1999, and references therein) . Although the stellar sample is limited, we emphasized that we found evidence of wind clumping in all early O dwarfs that we have analyzed so far, see Bouret et al. (2003). A unique WLR for supergiants and dwarfs might eventually be empirically derived with clumped wind models once larger stellar samples have been analyzed. We found, however, that wind clumping results in revising down the mass loss rates by a factor larger than the factor of about 2.3 advocated by Repolust et al. (2004).
6 Conclusions
We have performed a quantitative analysis of the FUSE and IUE spectra of two Galactic O4-type stars, one supergiant (HD 190429A) and one dwarf (HD 96715), investigating the role of wind clumping and its resulting effect on stellar parameters and thus extending our recent studies of SMC O stars (Bouret et al. 2003; Hillier et al. 2003). Our analysis is based on the NLTE model atmosphere programs Tlusty and CMFGEN, that account for NLTE metal line blanketing and thus provide a detailed description of the photosphere and wind of O stars. We have first determined the stellar and wind parameters using homogeneous wind models, but failed to reproduce several key lines, e.g. O v1371, like all previous analyses of O stars. Similarly to the case of MC stars (Crowther et al. 2002b; Hillier et al. 2003), we have to adopt a very low phosphorus abundance in order to match the strength of the P v1118-1128 resonance lines with homogeneous wind models. We have then considered clumped wind models in order to test their ability to improve the fit to the observed spectra.
The clumped wind models consistently improve the match to lines of different species, especially P v1118-1128, O v1371 and N iv1718. The fit to strong Fe photospheric lines (similarly to AV 83, Hillier et al. 2003) and to Si iv1393-1402 (though still not excellent) is also improved in HD 190429A. In both stars, we need to adopt a highly clumped wind model, (HD 190429A) and (HD 96715), in order to match these lines. Based on measured phosphorus ionization fractions, Massa et al. (2003) argued that mass loss rates of O stars might be lower by a factor of 5, which is thus consistent with . In agreement with Hillier et al. (2003) and Bouret et al. (2003), clumping needs to start deep in the wind, just above the sonic point, at velocities as low as km s-1, to reproduce the steep transition between the emission and absorption components of clump-sensitive lines. This finding also supports the conjecture of Repolust et al. (2004) that their mass loss rates based on H were too high for supergiants due to clumping. We showed that the basic physical reason behind the better fits is the increased recombination in clumps that lowers the wind ionization. We argue that our clumped wind models accurately predict the ionization structure of O-type star winds because of their ability to consistently match lines of different species and ionization stages. Our results, therefore, provide a considerably more robust conclusion about the clumped nature of the wind of O stars than previous studies, and are in agreement with our earlier results on SMC O stars (Hillier et al. 2003; Bouret et al. 2003).
The main consequence of wind clumping is that mass loss rates need to be revised down substantially, here by a factor of 3 (HD 190429A) to 7 (HD 96715). This factor is of the same order as the correction derived for the SMC O stars (Bouret et al. 2003). We show that such a drastic correction remains in good agreement with H observations. Most earlier studies of O stars ignored the effect of deviations from standard winds models, i. e. assuming a globally stationary wind with a smooth density/velocity stratification, to determine the properties of stellar winds. It was argued that “this standard analysis yields reliable average models of the stellar wind” (Kudritzki & Puls 2000), although it was recognized that such models are inherently incapable of reproducing the spectral signatures that suggest the existence of extensive wind structures. Although this argument may hold for deriving the wind velocity structure, we have now demonstrated that this is not the case for determining mass loss rates. The present work, together with our recent work on SMC O stars, establishes that clumping likely is a general property of O star winds. Accounting for clumping will lead to a systematic and significant downward revision of mass loss rates. Because mass loss is a crucial aspect of massive star evolution, a revision of mass loss rates accounting for the effect of clumping is urgently needed. We note in parallel that two analyses of low-luminosity O stars also revealed mass loss rates much lower than those predicted by the theoretical WLR (Bouret et al. 2003; Martins et al. 2004). Our study therefore calls for a fundamental revision in our understanding of mass loss and of O-type star stellar winds.
Finally, the surface abundance of HD 190429A is in agreement with its advanced evolutionary stage, in particular showing CNO-cycle processed material (nitrogen overabundance, carbon and oxygen depletion) at the stellar surface. Similarly to SMC O dwarfs, we find also enhanced nitrogen at the surface of HD 96715, though the carbon depletion is much milder and oxygen is close to the solar abundance.
Acknowledgements.
We are grateful to Joachim Puls for a detailed and helpful referee’s report which contributed to improve our paper. All data used in this paper were extracted from the Multimission Archive at the Space Telescope Science Institute (MAST). STScI is operated by the Association of Universities for Research in Astronomy, Inc., under NASA contract NAS5-26555. Support for MAST for non-HST data is provided by the NASA Office of Space Science via grant NAG5-7584 and by other grants and contracts. J.-C. Bouret acknowledges CNES for financial support. T. Lanz is supported by a NASA ADP grant (NNG04GC81G); he is grateful for the hospitality and support of the Laboratoire d’Astrophysique in Marseille when this work was initiated. D. J. Hillier gratefully acknowledges support from a NASA-LTSA grant (NAGW-3828).References
- Asplund et al. (2004) Asplund, M., Grevesse, N., & Sauval, A. J. 2004, in Cosmic Abundances as Records of Stellar Evolution and Nucleosynthesis, ASP Conf. Ser., in press, astro-ph/0410214
- Bouret et al. (2003) Bouret, J.-C., Lanz, T., Hillier, D. J., et al. 2003, ApJ, 595, 1182
- Cassinelli & Olson (1979) Cassinelli, J. P. & Olson, G. L. 1979, ApJ, 229, 304
- Cassinelli & Swank (1983) Cassinelli, J. P. & Swank, J. H. 1983, ApJ, 271, 681
- Chlebowski & Garmany (1991) Chlebowski, T. & Garmany, C. D. 1991, ApJ, 368, 241
- Conti et al. (1995) Conti, P. S., Hanson, M. M., Morris, P. W., Willis, A. J., & Fossey, S. J. 1995, ApJ, 445, L35
- Crowther et al. (2002a) Crowther, P. A., Dessart, L., Hillier, D. J., et al. 2002a, ApJ, 579, 774
- Crowther et al. (2002b) Crowther, P. A., Hillier, D. J., Abbott, J. B., & Fullerton, A. W. 2002b, A&A, 392, 653
- Dessart & Owocki (2003) Dessart, L. & Owocki, S. P. 2003, A&A, 406, L1
- Eversberg et al. (1998) Eversberg, T., Lepine, S., & Moffat, A. F. J. 1998, ApJ, 494, 799
- Feldmeier (1995) Feldmeier, A. 1995, A&A, 299, 523
- Feldmeier et al. (1997) Feldmeier, A., Puls, J., & Pauldrach, A. W. A. 1997, A&A, 322, 878
- Garcia & Bianchi (2004) Garcia, M. & Bianchi, L. 2004, ApJ, 606, 497
- Grevesse & Sauval (1998) Grevesse, N. & Sauval, A. J. 1998, Sp. Sci. Rev., 85, 161
- Hamann & Koesterke (1998) Hamann, W.-R. & Koesterke, L. 1998, A&A, 335, 1003
- Hauschildt et al. (1997) Hauschildt, P. H., Baron, E., & Allard, F. 1997, ApJ, 483, 390
- Heap et al. (2005) Heap, S. R., Lanz, T., & Hubeny, I. 2005, ApJ, (in press, astro-ph/0412345)
- Hillier (1991) Hillier, D. J. 1991, A&A, 247, 455
- Hillier et al. (2003) Hillier, D. J., Lanz, T., Heap, S. R., et al. 2003, ApJ, 588, 1039
- Hillier & Miller (1998) Hillier, D. J. & Miller, D. L. 1998, ApJ, 496, 407
- Hillier & Miller (1999) Hillier, D. J. & Miller, D. L. 1999, ApJ, 519, 354
- Howarth & Prinja (1989) Howarth, I. D. & Prinja, R. K. 1989, ApJS, 69, 527
- Howarth et al. (1995) Howarth, I. D., Prinja, R. K., & Massa, D. 1995, ApJ, 452, L65
- Hubeny & Lanz (1995) Hubeny, I. & Lanz, T. 1995, ApJ, 439, 875
- Hubeny et al. (2003) Hubeny, I., Mihalas, D., & Werner, K. 2003, Stellar Atmosphere Modeling, ASP Conf. Ser. 288 (San Francisco: Astronomical Society of the Pacific)
- Humphreys (1978) Humphreys, R. M. 1978, ApJS, 38, 309
- Koesterke et al. (2002) Koesterke, L., Hamann, W.-R., & Gräfener, G. 2002, A&A, 384, 562
- Kramer et al. (2003) Kramer, R. H., Cohen, D. H., & Owocki, S. P. 2003, A&A, 592, 532
- Kudritzki (1992) Kudritzki, R. P. 1992, A&A, 266, 395
- Kudritzki & Puls (2000) Kudritzki, R. P. & Puls, J. 2000, ARA&A, 38, 613
- Kurosawa et al. (2002) Kurosawa, R., Hillier, D. J., & Pittard, J. M. 2002, A&A, 388, 957
- Lamers & Leitherer (1993) Lamers, H. J. G. L. M. & Leitherer, C. 1993, ApJ, 412, 771
- Lanz & Hubeny (2003) Lanz, T. & Hubeny, I. 2003, ApJS, 146, 417
- Leitherer (1988) Leitherer, C. 1988, ApJ, 326, 356
- Lenorzer et al. (2004) Lenorzer, A., Mokiem, M. R., de Koter, A., & Puls, J. 2004, A&A, 422, 275
- Lucy (1982) Lucy, L. B. 1982, ApJ, 255, 286
- Lucy & Solomon (1970) Lucy, L. B. & Solomon, P. M. 1970, ApJ, 159, 879
- Markova et al. (2004) Markova, N., Puls, J., Repolust, T., & Markov, H. 2004, A&A, 413, 693
- Martins et al. (2005) Martins, F., Schaerer, D., & Hillier, D. J. 2005, A&A, (in press, astro-ph/0503346)
- Martins et al. (2004) Martins, F., Schaerer, D., Hillier, D. J., & Heydari-Malayeri, M. 2004, A&A, 420, 1087
- Massa et al. (1995) Massa, D., Fullerton, A. W., Nichols, J. S., et al. 1995, ApJ, 452, L53
- Massa et al. (2003) Massa, D., Fullerton, A. W., Sonneborn, G., & Hutchings, J. B. 2003, ApJ, 586, 996
- Meynet & Maeder (2000) Meynet, G. & Maeder, A. 2000, A&A, 361, 101
- Moffat & Robert (1994) Moffat, A. F. J. & Robert, C. 1994, ApJ, 421, 310
- Nahar (1999) Nahar, S. N. 1999, ApJS, 120, 131
- Oskinova et al. (2004) Oskinova, L. M., Feldmeier, A., & Hamann, W.-R. 2004, A&A, 422, 675
- Owocki (1994) Owocki, S. P. 1994, Ap&SS, 221, 3
- Owocki et al. (1988) Owocki, S. P., Castor, J. I., & Rybicki, G. B. 1988, ApJ, 335, 914
- Owocki & Puls (1999) Owocki, S. P. & Puls, J. 1999, ApJ, 510, 355
- Pauldrach et al. (2001) Pauldrach, A. W. A., Hoffmann, T. L., & Lennon, M. 2001, A&A, 375, 161
- Pauldrach et al. (1994) Pauldrach, A. W. A., Kudritzki, R. P., Puls, J., Butler, K., & Hunsinger, J. 1994, A&A, 283, 525
- Pellerin et al. (2002) Pellerin, A., Fullerton, A. W., Robert, C., et al. 2002, ApJS, 143, 159
- Puls et al. (1996) Puls, J., Kudritzki, R.-P., Herrero, A., et al. 1996, A&A, 305, 171
- Puls et al. (2003) Puls, J., Repolust, T., Hoffmann, T. L., Jokuthy, A., & Venero, R. O. J. 2003, in A Massive Star Odyssey: From Main Sequence to Supernova, Proc. IAU Symp. 212, 61
- Repolust et al. (2004) Repolust, T., Puls, J., & Herrero, A. 2004, A&A, 415, 349
- Runacres & Owocki (2002) Runacres, M. C. & Owocki, S. P. 2002, A&A, 381, 1015
- Sahnow et al. (2000) Sahnow, D. J., Moos, H. W., Ake, T. B., et al. 2000, ApJ, 538, L7
- Schild et al. (2004) Schild, H., Güdel, M., Mewe, R., et al. 2004, A&A, 422, 177
- Scuderi et al. (1998) Scuderi, S., Panagia, N., Stanghellini, C., Trigilio, C., & Umana, G. 1998, A&A, 332, 251
- Vink et al. (2000) Vink, J. S., de Koter, A., & Lamers, H. J. G. L. M. 2000, A&A, 362, 295
- Walborn & Howarth (2000) Walborn, N. R. & Howarth, I. D. 2000, PASP, 112, 1446
- Walborn et al. (2000) Walborn, N. R., Lennon, D. J., Heap, S. R., et al. 2000, PASP, 112, 1243