Search for extraterrestrial point sources of high energy neutrinos with AMANDA-II using data collected in 2000-2002
Abstract
The results of a search for point sources of high energy neutrinos in the northern hemisphere using data collected by AMANDA-II in the years 2000, 2001 and 2002 are presented. In particular, a comparison with the single-year result previously published shows that the sensitivity was improved by a factor of 2.2. The muon neutrino flux upper limits on selected candidate sources, corresponding to an neutrino energy spectrum, are included. Sky grids were used to search for possible excesses above the background of cosmic ray induced atmospheric neutrinos. This search reveals no statistically significant excess for the three years considered.
pacs:
95.85.Ry,95.55.Vj,96.40.Tv,98.54.-hThe detection of high energy cosmic rays raises fundamental questions about their generation and the mechanisms responsible for such energies. The origin of cosmic rays above the “knee” () still remains uncertain. Nevertheless there is evidence that below such energies they are generated through acceleration mechanisms in expanding supernova remnant shocks snr and in microquasars mquasar1 ; mquasar2 ; mquasar3 , although we cannot exclude the possibility of extragalactic sources at these energies. The interaction of accelerated protons with ambient matter or radiation leads to pion production and, consequently, to neutrinos and gamma rays following a power-law energy spectrum. High energy gamma rays are affected by absorption during propagation and may also be produced by inverse Compton scattering of shock-accelerated electrons. Therefore detection of gamma rays alone is insufficient evidence for hadronic acceleration. Neutrinos can provide a link to increased understanding of high energy cosmic rays, although most predictions of high energy extraterrestrial neutrino fluxes conservatively require kilometer-scale detectors gaisser ; learned ; halzen .
AMANDA-II amanda2 operates at the geographic south pole. It is composed of 677 optical modules (OMs) – photomultiplier tubes encased in glass pressure vessels – spaced along 19 vertical cables (strings) arranged in concentric circles. The instrument spans a geometrical volume of clear glacial ice between depths of and m, with a diameter of m. The AMANDA-II neutrino telescope has been in operation since 2000. In this letter, we follow up on a previously published search for high-energy neutrino point sources from the data sample collected in 2000 2000ps , using data from the three years, 2000 to 2002. The sensitivity for the detection of point sources has significantly improved in AMANDA, compared to 1997 1997ps and 1999 results ecrs , due to both detector performance and analyses technique improvements.
A high-energy muon neutrino interacting with the ice or bedrock in the vicinity of the detector produces a high-energy muon propagating a few kilometers when above 1 TeV. At these energies the mean angular offset between the muon track and incident neutrino is less than . The muon track is reconstructed using the detection of Cherenkov light emitted as it propagates through the array of OMs, and the likelihood of arrival time of detected photons at each OM location. The resulting zenith-dependent median pointing resolution varies between 1.5∘ and 2.5∘ reco .
Muons are also produced by the interactions of cosmic rays in Earth’s atmosphere. These atmospheric muons dominate the AMANDA-II trigger rate so the search for neutrino-induced muon tracks is only conducted in the northern hemisphere, using Earth as an atmospheric muon filter. A second source of background is represented by atmospheric muon tracks reconstructed as up-going. These events can be rejected using track quality criteria. The most important source of background is the residual up-going flux of neutrinos produced in the atmosphere by the impact of cosmic rays. These atmospheric neutrinos also serve as a verification of the detection principle and demonstrates AMANDA’s capability as a neutrino detector atmnu1 ; atmnu2 . The search for possible extraterrestrial neutrinos begins with a dataset dominated by the well-understood atmospheric neutrinos. This analysis selects a three-year sample of events with median energy of and extending up to 100 TeV. Extraterrestrial neutrinos are beleived to be distinguished by a harder energy spectrum, taken as proportional to in this analysis.
The exposure of the present analysis is three times higher than that of the previous analysis 2000ps . A different search strategy is used, which includes an explicit high energy event selection to reduce the expected lower energy atmospheric neutrino background.
I Data Analysis
The data used for this analysis were collected between the months of February and November in the years 2000, 2001 and 2002 (see Table I).
| year | livetime (days) | triggers | ||
|---|---|---|---|---|
| 2000 | 197 | |||
| 2001 | 194 | |||
| 2002 | 216 |
The experimental sample used in this analysis corresponds to a total of 607 days of livetime and contains almost 5.6 billion triggers. Starting from 2002, a first level filter is performed at the South Pole during data taking. The reduced amount of data is transferred via satellite to the northern hemisphere for analysis. After the application of an iterative maximum-likelihood reconstruction algorithm and the selection of tracks that are likely to be upgoing reco , about 0.45 million events with reconstructed declination remain. Since AMANDA-II is located at the south pole, corresponds to horizontal and to vertical up-going directions. These events, containing mostly mis-reconstructed atmospheric muons and a contribution of atmospheric neutrinos, were used as an experimental background for selection optimization.
To avoid biasing the event selection the data were scrambled by randomizing the reconstructed right ascension () of each event. The optimization procedure makes use of three observables: the number of hit OMs for each event (), the reconstructed track length in the array and the likelihood ratio between the muon track reconstruction and a muon reconstruction constrained by using an atmospheric muon prior hill01 . A full simulation chain, including neutrino absorption in the Earth, neutral current regeneration, muon propagation and detector response for the given data taking periods, is used to simulate point sources of muon neutrinos and anti-neutrinos 2000ps . Events are simulated at the center of each band of declination (), according to an energy spectrum. The final cuts on these observables and the optimum size of each circular search bin were independently determined for each declination band in order to have the strongest constraint on the signal hypothesis. This corresponds to the best sensitivity, i.e. the average flux upper limit obtained in an ensemble of identical experiments assuming no signal mrp . The true directional information was then restored for the calculation of the limits.
The upper limits of this analysis were calculated using the background measured using the events off-source in the corresponding declination band, and the expected number of events, , from a simulated point source of known flux : . Here is the number of observed events in the given source bin, and is the upper limit on the number of events following the unified ordering prescription of Feldman and Cousins fc98 . The three years were analyzed both separately and as combined data samples.

II Calibration and Systematic Uncertainty
Using the three-year experimental sample the absolute normalization of the detector simulation, with respect to atmospheric neutrino flux, was determined to be . This normalization factor is different from the value in reference 2000ps , but consistent with the theoretical uncertainty of 25% lipari93 . The optical properties of the fiducial ice, needed for the detector simulation, are determined using down-going muon data and in-situ calibration lasers kurt . The overall experimental systematic uncertainty in the acceptance was evaluated to be 30% down . The absolute pointing accuracy, determined with coincident events between the SPASE air shower array spase and AMANDA-II, is better than 1∘, i.e. smaller than the angular resolution. These systematic uncertainties do not affect significantly the limit calculations 2000ps .
III Results
Figure 1 shows the calculated sensitivity versus declination for energies above 10 GeV. The event selection used produces a sensitivity which is fairly constant over all declinations. For (0 sin() 0.09) the background contamination is 4 times higher than for , and the sensitivity is poorer. For (sin() 0.98), on the other hand, the solid angle aperture is small and the background evaluation is affected by higher relative statistical fluctuations. The sensitivity improves with the detector exposure and for the three-year sample it is 2.2 times better than for a single year. This improvement is better than would be expected from longer exposure alone in the presence of background, due to improved analysis techniques.
| year | |||
|---|---|---|---|
| 20002000ps | 601 | 676 | 133 |
| 2000 | 306 | 296 | 111 |
| 2001 | 347 | 364 | 115 |
| 2002 | 429 | 429 | 131 |
| 00-02 | 646 | 635 | 297 |
The final three-year sample consists of 646 upward () reconstructed muons (see Table II). The predicted number of atmospheric neutrinos is 635. In the year 2000 alone, the number of selected events is 306, compared with the 601 (699 for ) in reference 2000ps . The difference between the two samples is due to the different choice of observables used for the selection optimization. In particular the use of the observable, which is correlated to the energy released by the muon in the array and, ultimately, to the neutrino energy, selects 26% higher median energies than those in 2000ps (from to for a single year). This selection is obtained at the price of removing a significant fraction of atmospheric neutrino events: for instance only 221 events in 2000ps would survive the new selection, 94% of which (i.e. 207) are also found in the new sample from the year 2000.
As shown in Table II the number of events in the final sample () does not sum up with experimental exposure. Since the signal hypothesis predicts a higher event intensity at high energy than the atmospheric neutrino background, a longer exposure allows a stronger constraint on a given model by requiring a stronger energy cut (the median energy increases from for a single year to for the three-year sample), which rejects more background events and results in stricter limits. Consequently the three-year sample contains 40% fewer observed events than the sum of single years, but only 17% of the high energy neutrino signal events are lost.

The detector performance is assessed by the neutrino effective area , which contains the neutrino interaction probability, muon propagation, detector response and the analysis selection. It is defined by the relation between the differential neutrino flux and the predicted number of neutrino events , through the equation
| (1) |
Figure 2 shows the muon neutrino effective area as a function of neutrino energy for the three-year optimized selection. The curves are shown for different declinations. Above 1 neutrinos begin to be absorbed by the Earth, except for the events that enter AMANDA-II horizontally.
A binned search for excesses in the region was performed on the three-year event sample. The search grid contains 290 rectangular bins with declination-dependent width ranging from to , based on the optimized search bin diameter. The grid is shifted 4 times in and to fully cover boundaries between the bins of the original configuration. A higher number of grid shifts showed no improvement in the average maximum statistical significances on simulated Poisson-fluctuated signal with intensities comparable to the background. The probability distribution for background fluctuations in the ensemble of bins was evaluated by using 20,000 experimental samples with scrambled and calculating the highest value of the maximum statistical fluctuation significance over the entire sky.
| Candidate | from | 2000ps | this | work | ||||
| (∘) | (h) | |||||||
| TeV Blazars | ||||||||
| Markarian 421 | 38.2 | 11.07 | 3 | 1.50 | 3.5 | 0 | 1.35 | 0.34 |
| Markarian 501 | 39.8 | 16.90 | 1 | 1.57 | 1.8 | 3 | 1.31 | 1.49 |
| 1ES 1426+428 | 42.7 | 14.48 | 1 | 1.62 | 1.7 | 2 | 1.13 | 1.16 |
| 1ES 2344+514 | 51.7 | 23.78 | 1 | 1.23 | 2.0 | 1 | 1.25 | 0.82 |
| 1ES 1959+650 | 65.1 | 20.00 | 0 | 0.93 | 1.3 | 0 | 1.59 | 0.38 |
| GeV Blazars | ||||||||
| QSO 0528+134 | 13.4 | 5.52 | 1 | 1.09 | 2.0 | 1 | 1.88 | 0.57 |
| QSO 0235+164 | 16.6 | 2.62 | 1 | 1.49 | 1.7 | 3 | 2.15 | 1.12 |
| QSO 1611+343 | 34.4 | 16.24 | 0 | 1.29 | 0.8 | 0 | 1.66 | 0.31 |
| QSO 1633+382 | 38.2 | 16.59 | 1 | 1.50 | 1.7 | 1 | 1.33 | 0.75 |
| QSO 0219+428 | 42.9 | 2.38 | 1 | 1.63 | 1.6 | 0 | 1.15 | 0.37 |
| QSO 0954+556 | 55.0 | 9.87 | 1 | 1.66 | 1.7 | 2 | 1.04 | 1.50 |
| QSO 0716+714 | 71.3 | 7.36 | 2 | 0.74 | 4.4 | 3 | 0.93 | 1.91 |
| Microquasars | ||||||||
| SS433 | 5.0 | 19.20 | 0 | 2.38 | 0.7 | 1 | 2.21 | 0.55 |
| GRS 1915+105 | 10.9 | 19.25 | 1 | 0.91 | 2.2 | 3 | 1.84 | 1.26 |
| GRO J0422+32 | 32.9 | 4.36 | 2 | 1.31 | 2.9 | 2 | 1.49 | 1.08 |
| Cygnus X1 | 35.2 | 19.97 | 2 | 1.34 | 2.5 | 0 | 1.59 | 0.31 |
| Cygnus X3 | 41.0 | 20.54 | 3 | 1.69 | 3.5 | 1 | 1.26 | 0.75 |
| XTE J1118+480 | 48.0 | 11.30 | 1 | 0.92 | 2.2 | 1 | 1.12 | 0.80 |
| CI Cam | 56.0 | 4.33 | 0 | 1.72 | 0.8 | 2 | 1.05 | 1.44 |
| LS I +61 303 | 61.2 | 2.68 | 0 | 0.75 | 1.5 | 5 | 1.67 | 2.43 |
| SNR, magnetars & miscellaneous | ||||||||
| SGR 1900+14 | 9.3 | 19.12 | 0 | 0.97 | 1.0 | 2 | 1.78 | 0.94 |
| Crab Nebula | 22.0 | 5.58 | 2 | 1.76 | 2.4 | 4 | 1.86 | 1.43 |
| Cassiopeia A | 58.8 | 23.39 | 0 | 1.01 | 1.2 | 2 | 1.12 | 1.38 |
| 3EG J0450+1105 | 11.4 | 4.82 | 2 | 0.89 | 3.2 | 1 | 1.83 | 0.59 |
| M 87 | 12.4 | 12.51 | 0 | 0.95 | 1.0 | 3 | 1.83 | 1.24 |
| Geminga | 17.9 | 6.57 | 3 | 1.78 | 3.3 | 2 | 2.06 | 0.81 |
| UHE CR Triplet | 20.4 | 1.28 | 2 | 1.84 | 2.3 | 0 | 2.15 | 0.20 |
| NGC 1275 | 41.5 | 3.33 | 1 | 1.72 | 1.6 | 1 | 1.14 | 0.78 |
| Cyg. OB2 region. | 41.5 | 20.54 | 3 | 1.72 | 3.5 | 1 | 1.14 | 0.78 |
| UHE CR Triplet | 56.9 | 12.32 | 1 | 1.48 | 1.9 | 1 | 1.17 | 0.93 |
The bin with the most statistically significant excess from the three-year experimental sample is at about and , with 10 observed events in the search bin on a background of 2.38 events, estimated from the corresponding declination band. The observed excess has a statistical significance of 1.9 (3.73 ). The chance probability of such an excess, in the ensamble of bins, is 28%.
Table III shows the 90% CL neutrino flux limits for northern hemisphere TeV blazars, selected GeV blazars, microquasars, magnetars and selected miscellaneous candidates. The limits are compared with the values from 2000ps , they are compatible with the average flux upper limit, or sensitivity, of Figure 1 and the deviations from it are due to statistical fluctuations in the observed sample.
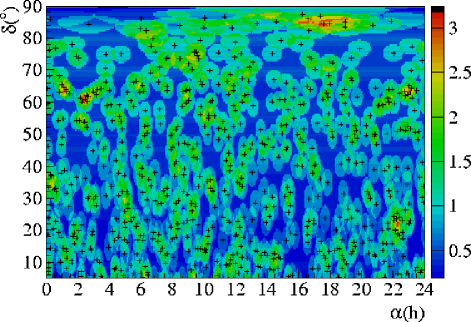
Figure 3 shows the 90% CL neutrino flux upper limits in equatorial coordinates. The limits are calculated by scanning the sky and counting the events within the optimized search bins at the given declination. The highest upper limit in the Figure corresponds to the previously discussed statistically significant bin. Other high limit spots visible in the figure have statistical significances smaller than 3.4 .
We analyzed the 2000-02 data sample collected by the AMANDA-II detector to search for point sources of high energy neutrinos. We performed both a non-targeted binned search and a targeted search focussing on known objects that are potential high energy neutrino emitters (as in reference 2000ps ). We found no evidence of a significant flux excess above the background. A km-scale experiment, such as IceCube icecube , will be able to increase the detection sensitivity by at least a factor of 30 in the same time scale.
IV Acknowledgments
We acknowledge the support of the following agencies: National Science Foundation–Office of Polar Programs, National Science Foundation–Physics Division, University of Wisconsin Alumni Research Foundation, Department of Energy, and National Energy Research Scientific Computing Center (supported by the Office of Energy Research of the Department of Energy), UC-Irvine AENEAS Supercomputer Facility, USA; Swedish Research Council, Swedish Polar Research Secretariat, and Knut and Alice Wallenberg Foundation, Sweden; German Ministry for Education and Research, Deutsche Forschungsgemeinschaft (DFG), Germany; Fund for Scientific Research (FNRS-FWO), Flanders Institute to encourage scientific and technological research in industry (IWT), and Belgian Federal Office for Scientific, Technical and Cultural affairs (OSTC), Belgium; I.T. acknowledges support from Fundación Venezolana de Promoción al Investigador (FVPI), Venezuela; D.F.C. acknowledges the support of the NSF CAREER program.
References
- (1) F. A. Aharonian et al., Nature 432, 75 (2004).
- (2) M. Massi et al. (2004), astro-ph/0410504.
- (3) V. Bosch-Ramon and J.M. Paredes (2004), astro-ph/0401260.
- (4) C. Distefano, D. Guetta, A. Levinson and E. Waxmann, Astrophys. J. 575, 378 (2002).
- (5) T. K. Gaisser, F. Halzen and T. Stanev, Phys. Rept. 258, 173 (1995).
- (6) J. G. Learned and K. Mannheim, Ann. Rev. Nucl. Part. Sci. 50, 679 (2000).
- (7) F. Halzen and D. Hooper, Rept. Prog. Phys. 65, 1025 (2002).
- (8) E. Andrés, et al., Astropart. Phys. 13, 1 (2000).
- (9) J. Ahrens et al., Phys. Rev. Lett. 92, 071102 (2004).
- (10) J. Ahrens et al., Astrophys. J. 583, 1040 (2003).
- (11) P. Desiati et al., in Proceedings of the 19th European Cosmic Ray Symposium, Florence, Italy (2004), to be published in Int. J. Mod. Phys. A.
- (12) J. Ahrens et al., Nucl. Inst. Meth. A524, 169 (2004).
- (13) E. Andrés, et al., Nature 410, 441 (2001)
- (14) J. Ahrens et al., Phys. Rev. D66, 012005 (2002)
- (15) G. C. Hill, in Proceedings of the 27th ICRC, Hamburg, Germany, HE 267, 1279, edited by K.-H. Kampert, G. Hainzelmann and C. Spiering, Copernicus Gesellschaft e.V., Katlemburg-Lindau, Germany, vol. HE 267, p. 1279.
- (16) G. C. Hill and K. Rawlins, Astropart. Phys. 19, 393 (2003).
- (17) G. J. Feldman and R. D. Cousins, Phys. Rev. D57, 3873 (1998).
- (18) P. Lipari, Astropart. Phys. 1, 195 (1993).
- (19) K. Woschnagg et al., in Proceedings of the 21st International Conference On Neutrino Physics And Astrophysics (Neutrino 2004), Paris, France (2004), to be published in Nucl. Phys. B (Proceedings Supplement), astro-ph/0409423.
- (20) P. Desiati et al., in Proceedings of the 28th ICRC, Tsukuba, Japan, edited by T. Kajita, Y. Asaoka, A. Kawachi, Y. Matsubara, M. Sasaki (Univ. Acad. Pr., Tokyo, 2003), vol. HE 2.3, p. 1373.
- (21) J. E. Dickinson et al., Nucl. Inst. Meth. A440, 95 (2000).
- (22) J. Ahrens et al., Astropart. Phys. 20, 507 (2004).