Fundamental Properties of O-Type Stars11affiliation: Based on observations with the NASA/ESA Hubble Space Telescope, obtained at the Space Telescope Science Institute, which is operated by the Association of Universities for Research in Astronomy, Inc., under NASA contract NAS5-2655. Also based on observations made with the NASA-CNES-CSA Far Ultraviolet Spectroscopic Explorer, which is operated for NASA by the Johns Hopkins University under NASA contract NAS5-32985.
Abstract
We present a comprehensive analysis of high-resolution, far-ultraviolet HST/STIS, FUSE, and optical spectra of 17 O stars in the Small Magellanic Cloud. Our analysis is based on the OSTAR2002 grid of NLTE metal line-blanketed model atmospheres calculated with our NLTE model atmosphere code TLUSTY. We systematically explore and present the sensitivity of various UV and optical lines to different stellar parameters. We have obtained consistent fits of the UV and the optical spectrum to derive the effective temperature, surface gravity, surface composition, and microturbulent velocity of each star. Stellar radii, masses, luminosities and ages then follow directly. Similarly to recent but more limited studies, we derive cooler temperatures than the standard effective temperature calibration of O stars. We propose a new calibration between the spectral type and effective temperature based on our results from UV metal lines as well as optical hydrogen and helium lines. For stars of the same spectral subtype, we find a general good agreement between determinations obtained with TLUSTY, CMFGEN, and FASTWIND models. The lower effective temperatures translate into lower bolometric corrections and lower ionizing fluxes. We derive ionizing luminosities that are smaller by a factor of 3 compared to luminosities inferred from previous standard calibrations. The chemical composition analysis reveals that the surface of about 3/4 of the program stars is moderately to strongly enriched in nitrogen, while showing the original helium, carbon, and oxygen abundances. Our results support the new stellar evolution models that predict that the surface of fast rotating stars becomes nitrogen-rich during the main sequence phase because of rotationally-induced mixing. We find, however, enrichment factors (up to a factor of 40) that are larger than predicted by stellar evolution models. Most stars exhibit the “mass discrepancy” problem, that is, the spectroscopic masses are lower than the evolutionary masses. We interpret this discrepancy as a result of fast rotation which lowers the measured effective gravity. Nitrogen enrichment and low spectroscopic masses are therefore two manifestations of fast rotation. Our study thus emphasizes the importance of rotation in our understanding of the properties of massive stars and provides a framework for investigating populations of low metallicity massive stars at low and high redshifts.
1 INTRODUCTION
We present a determination of the the fundamental properties of O-type stars in order to provide a solid basis for understanding the evolution of massive stars forming today or long ago, and for determining the properties of unresolved starbursts both near and far. A knowledge of a star’s mass, luminosity, and effective temperature is essential for understanding the evolution of massive stars, the initial mass function, and ages and properties of clusters and H II regions. The fundamental properties of O-type stars are also essential for interpreting the spectra of unresolved star-forming regions and of starburst galaxies. Most efforts to synthesize the spectra of starburst galaxies use observed spectra of relatively nearby stars as templates. However, even these so-called empirical methods involve a calibration of spectral type in terms of fundamental stellar parameters (e.g. mass, effective temperature, bolometric luminosity) and then a subsequent calibration of these parameters in terms of initial mass and age via a comparison with evolutionary tracks.
There are already several spectral calibrations in general use today. One is by Vacca et al. (1996), which is based on spectral analyses of galactic O stars carried out in the 1980’s. Another, which has been incorporated in the starburst99 code of Leitherer et al. (1999), uses the spectral calibration of Schmidt-Kaler (1982). In the last twenty years, great strides have been taken in increasing the quality of the observed spectra and in increasing the physical realism of model atmospheres and spectra. Our work takes advantage of both advances. We make use of the high-quality, high-resolution spectra of O-type stars in the Small Magellanic Cloud (SMC) (). In this respect, we are extending the recent studies of selected types of O stars (e.g. O supergiants: (Bianchi & Garcia, 2002; Crowther et al., 2002; Heap & Lanz, 2002; Martins et al., 2002; Massey et al., 2004), O dwarfs: (Herrero et al., 2002; Bouret et al., 2003; Massey et al., 2004). Our study encompasses 17 stars in the SMC that are well distributed in spectral type and luminosity class while homogeneous in metallicity. The breadth of the sample enables us to evaluate the sensitivity of optical and ultraviolet spectral features to temperature, gravity, and microturbulence ()
To interpret these spectra, we use the new, fully line-blanketed NLTE model atmospheres and spectra calculated by Lanz & Hubeny (2003) (. We paid particular attention to blanketing by metal lines on the structure of the atmosphere and emergent spectrum. We find that back-warming of the atmosphere produced by the millions of metal lines – all treated in NLTE – not only affects the metal-line spectrum but also the helium lines, leading to a lower lower (i.e. normal) helium abundance in O-type stars and a lower temperature scale (). The lower temperature scale translates to lower the bolometric corrections, bolometric luminosities, and ionizing fluxes. A new calibration of ionizing luminosities with spectral type is presented in §6.4.
Including the myriad of metal lines in our models brings other benefits as well. The most obvious is the expanded set of spectral diagnostics in the ultraviolet, which is replete with metal lines. A less obvious benefit is the high level of internal consistency of the model spectrum: ionization balance of helium, iron, and carbon now yield the same effective temperature; and helium singlets now give the same results as the helium triplets.
We find that the temperature scale depends on metallicity. Based on TLUSTY models, O-type stars of solar metallicity are about 1,000 to 2,000 K cooler than SMC O stars of the same spectral type. We also find that luminosity class is more closely correlated with the ratio of luminosity to spectroscopic mass than it is to bolometric luminosity. However, spectroscopic mass is often lower than the mass derived from a star’s position on the HR diagram – a circumstance known as the “mass discrepancy”. We find that the mass discrepancy is generally greatest for stars whose atmospheres are highly enriched in nitrogen. Both anomalies – the low spectroscopic masses and high nitrogen abundances – can be explained if the stars are rapid rotators (Heap & Lanz, 2004). Conclusions are presented in .
2 OBSERVATIONS
The program stars in this study are the same as those selected for an ultraviolet spectroscopic survey of O-type stars with the Space Telescope Imaging Spectrograph (STIS) on the Hubble Space Telescope (HST) (HST GO Program 7437, Lennon=PI). This survey targeted 17 O-type stars in the Small Magellanic Cloud for ultraviolet spectroscopy. The resultant ultraviolet spectra along with optical spectra obtained at ground-based telescopes are displayed in an atlas of O-type stars in the Small Magellanic Cloud constructed by Walborn et al. (2000).
We selected O-type stars in the Small Magellanic Cloud because of the known distance, low metallicity, and generally low reddening of this nearby satellite galaxy. In this study, we adopt a distance, kpc, or equivalently, a distance modulus, , in agreement with recent determinations based on Cepheids [, Groenewegen 2000; , Kovács 2000] and the tip of the Red Giant Branch [, Cioni et al. 2000].) Because the program stars are at the same distance, we can examine the correspondence between luminosity class and bolometric luminosity. The low metallicity of the SMC (; Venn 1999; Bouret et al. 2003) makes it an ideal surrogate for star-forming galaxies at high redshift, which generally have a low metal content. The low metallicity also gives us a practical benefit: the winds of O-type stars in the SMC, which are driven by radiation pressure in metal lines, are particularly weak, so that our approach of photospheric analysis is justified.
The program stars form an unbiased sample of SMC O-type stars except that they were chosen for their narrow-lined spectra in order to avoid problems with line-blending in the analysis. Since O stars tend to be rapid rotators, this one bias means that we are viewing the stars pole-on.
The observational data include not only the STIS and ground-based optical spectra of 17 program stars (Walborn et al. 2000), but also far-UV spectra (905-1187 Å) from the Far Ultraviolet Spectroscopic Explorer (FUSE) for 9 of the program stars. The FUSE data broaden the UV spectral coverage to 905-1700 Å and enable better temperature determinations through ionization balance of elements such as C, N, Si, and S. Table 1 lists the program stars, their spectral types (Walborn et al., 2000, 2002), the observatory at which the optical spectrograms were obtained, and the availability of STIS or FUSE spectra. Our sample contains two more stars, NGC 346 MPG 487 and MPG 682, than Walborn et al.’s because STIS spectroscopy of these stars was secured at a later date.
We examined each of the STIS target-acquisition images, which consists of a picture obtained with a wide-band, red filter ( Å). None of the targets appears to be multiple. Of course, at a 2-pixel resolution of , a target-acquisition image cannot resolve systems whose separations are less than 6300 AU, so this was not a stringent test. We also checked that the target-acquisition sequence found the right star. We found that STIS failed to acquire NGC 346 MPG 682, in that the initial field was blank. When this happens, the acquisition software still tries to center the brightest spot in the image (undoubtedly a cosmic-ray hit) and repeats the sequence of taking an image and centering. We found that the (unknown) star that was actually observed was hotter than would be expected from its optical spectrum, so we concluded that the wrong star was observed. Acquisition of NGC 346 MPG 12 may have also failed, but since the STIS and ESO spectra of NGC 346 MPG 12 lead to the same spectral classification, we retained the STIS spectrum of this star for further analysis.
Both STIS and optical data and data-processing are described in detail by Walborn et al. (2000). Here, we only describe the FUSE observations. See Moos et al. (2000), Sahnow et al. (2000), for a description of the FUSE instrument and performance. All publicly available FUSE spectra of the program stars were obtained with the star placed in the LWRS () aperture. For the majority of targets, the starfield is sufficiently sparse that the target was the dominant star in the field of view. However, LWRS spectra of stars in NGC 346 are clearly composite: they disagree with STIS spectra in the region of overlap (1150-1187 Å). We therefore discarded them. In our Cycle 2 FUSE program B134, we observed MPG 12 using the MDRS () aperture to avoid the crowding problem. However, the resulting spectral coverage was limited because of the imperfect alignment of FUSE optical channels. Accordingly, we only used data obtained in the LiF channels, covering the range 990-1187 Å.
A FUSE spectrum is recorded in eight segments, which together cover the spectral region between 905 and 1187 Å at a resolving power, . We acquired the raw data segments from the Multi-Mission Archive at Space Telescope (MAST) and reprocessed the data using the calfuse (v2.0.5) reduction software. We next co-added multiple exposures, if any. We then registered, adjusted the flux levels, and combined the 8 spectral segments. Finally, we registered and scaled the spectral flux to match the STIS spectrum in the region of overlap (1150–1187 Å), which includes the C III 1176 multiplet, which was used as a wavelength fiducial. The combined spectrum was binned to a 2-pixel resolving power, . The typical signal-to-noise ratio in the continuum is 15-20 per resolution element.
3 MODEL ATMOSPHERES AND SPECTRA
We used the new, fully line-blanketed NLTE model atmospheres and spectra of Lanz & Hubeny (2003, OSTAR2002).444Available at http://tlusty.gsfc.nasa.gov/ These model atmospheres cover the parameter range: 27,500 K K, with a sampling step of 2500 K; , down to the Eddington limit with intervals of 0.25 dex; 10 metallicities, from metal-rich models (twice the solar metallicity) to extremely metal-poor models. All models in the grid have a normal helium abundance, He/H = 0.1 by number density, and a microturbulent velocity, km s-1. OSTAR2002 models relevant to the Small Magellanic Cloud are the “S” models () and the “T” models (). If needed to achieve an overall match to observations, we interpolated logarithmically between model atmospheres for the chosen stellar parameters and then computed the spectrum of the interpolated model with SYNSPEC. See Lanz & Hubeny (2003) for a discussion comparing different interpolation strategies in the OSTAR2002 grid.
We calculated the NLTE model atmospheres with our computer code, TLUSTY, using the Complete Linearization/Accelerated Lambda Iteration method (Hubeny & Lanz, 1995). The program solves the basic structural equations in a plane-parallel geometry: radiative transfer, hydrostatic equilibrium, radiative equilibrium, statistical equilibrium, and charge and particle conservation. The critical ingredients of such models are the completeness of opacity sources and energy levels treated explicitly in the statistical equilibrium equations. The model atmospheres include the opacities of about 2 million lines dynamically selected from a list of 12 million lines, and they account for about 100,000 individual atomic levels of 45 ions. The spectrum is typically sampled at 180,000 to 200,000 frequencies. Further information about the models, Opacity Distribution Functions, and Opacity Sampling options to treat the line opacity of iron-peak elements is given in Lanz & Hubeny (2003). Finally, we calculated detailed spectra with our spectrum synthesis code, SYNSPEC, based on the atmospheric structure and NLTE populations provided by TLUSTY.
The reliability of the metal-line spectrum is highly dependent on the quality of the model atoms. Since UV absorption lines tend to arise from ground-state or low-lying energy levels, the model atoms for those ions are thought to be quite reliable. They should also be adequate for higher energy levels involved in the formation of optical lines. The only exception is the C III model atom, which oversimplifies the very high energy levels and may therefore lead to an underestimate of the total recombination rates and, consequently, the optical recombination lines are predicted too weak (Bouret et al., 2003). However, the net global error on the ionization level of carbon remains insignificant and, in any case, it can be checked through a comparison of the effective temperature derived from carbon ionization balance with temperatures derived from other elements.
3.1 Photospheric vs. Unified Models
Since O-type stars are known to have have strong, supersonic winds, the validity of static, photospheric models must be addressed. However, in low-metallicity stars like those in the SMC, only a few strong resonance lines show the signature of a wind; most lines are symmetric, indicating that they are formed in a quasi-static photosphere. Even so, the hydrostatic density structure of the photosphere is complex because it is determined by the effective gravity, i.e. the Newtonian gravity corrected for radiative acceleration due to the outward-directed force of radiation pressure. Realistic models must account for all the lines, especially those in spectral regions of high flux. In fact, it is preferable to use sophisticated photospheric models such as the OSTAR2002 models for stars with moderate or weak winds rather than rely on “unified” (photosphere+wind) models with a simplified description of the deep, quasi-static layers.
To verify the validity of photospheric models as applied to SMC O-type stars, we compared TLUSTY/SYNSPEC spectra to spectra computed with CMFGEN, Hillier and Miller’s (1998) code for “unified” models. Like TLUSTY, CMFGEN treats NLTE line blanketing in detail and thus describes the photospheric structure with similar sophistication. We performed extensive comparisons in collaboration with John Hillier, and both codes were upgraded in the process. We found that spectral lines formed in the inner region of the atmosphere show identical profiles in the CMFGEN and TLUSTY/SYNSPEC spectra even for SMC supergiants (Hillier et al., 2003; Hillier & Lanz, 2001; Bouret et al., 2003). [However, static models are definitely inappropriate for Wolf-Rayet stars and for extreme supergiants, especially at high metallicities.]
3.2 Line-Blanketed vs. H-He Models
Previous studies show that absorption by numerous metal lines causes cooling at the surface and heating of the inner regions of the atmosphere (Mihalas, 1978). This back-warming effect raises the ionization level of many diagnostic spectral lines. Figure 1 shows the effects of metal line-blanketing on the hydrogen and helium lines used for spectral classification and calibration. NLTE line-blanketing produces only slightly narrower profiles of H (Lanz et al., 1996) thereby yielding marginally higher (0.05 to 0.1 dex) surface gravities. Its main effect is on effective temperature. He I 4471 line is strengthened at temperatures below 40,000 K but weakened above 40,000 K. He II 4542 is also strengthened by line blanketing at all temperatures, although less so at higher temperatures. The net result, shown in Fig. 2, is that line blanketing by metals produces a decrease of about 1000 – 3000 K in derived from solar composition models compared to H-He models. At lower metallicities, this systematic decrease in is smaller and is mostly found in hotter models. These results are in good agreement with previous studies (Hubeny et al., 1998; Martins et al., 2002).
Metal line-blanketing also affects the derived helium abundance. As shown in Fig. 3, both He I and He II lines are stronger in a line-blanketed model than in a pure H-He model having the same parameters, and . To match the observed strengths of He I 4471 and He II 4542 with a H-He model would require a higher gravity or a higher helium abundance. Since the strength and profile of the gravity indicator, H , is unaffected by line blanketing, the higher-gravity solution is ruled out, and one would adopt an enhanced helium abundance. There is therefore good reason to be skeptical about the extent of enhancement in helium abundances in O-type stars if derived from pure H-He model atmospheres (Herrero et al., 1992). And in fact, we derive normal helium abundances for all the program stars, even for those that are highly enriched in nitrogen.
4 SPECTRAL DIAGNOSTICS
4.1 Atmospheric Parameters from the Hydrogen and Helium Lines
There are two types of spectral classification systems in use for O-type stars: a quantitative scheme devised by Petrie (1947) and Conti & Alschuler (1971) based on the equivalent widths of H , He I 4471, and He II 4542; and a qualitative scheme developed by Walborn (1971, 1972), based on visual inspection of the H, He, and metal lines. Both schemes estimate spectral type by the ratio of He II and He I line strengths, and luminosity class by the strength of Stark-broadened wings of H (Walborn also makes use of various He lines as well). In this study, we adopt Walborn et al.’s (2000) classifications for the program stars. In any case, the two schemes usually agree to better than a spectral type, as shown in Fig. 4. The two exceptions are: AV80 (O4-6n(f)p), a rapidly rotating star whose line strengths are difficult to measure; and NGC 346 MPG 682 (O9-O9.5V), which has also been classified as O8V, in which case there is no disagreement.
Spectral classification becomes more difficult for stars embedded in nebulosity because of contamination from nebular emission lines. This is the case for some stars in NGC 346. Figure 5, which compares the optical spectra of two stars in NGC 346, illustrates the problem. Walborn et al. (2000) classified the spectrum of NGC 346 MPG 324 as O4V because of its weak He I absorption lines. However, the He I lines may be weak because they are filled in by nebular emission. In cases such as this, we used the UV spectrum to check for consistency with the optical spectral type.
If nebular emission is significant, we can only analyze the wings of the H and He line profiles. Without reliable equivalent widths, there is some uncertainty regarding rotational vs. pressure (Stark) broadening of the H and He lines. This ambiguity is not serious in most cases since the rotational velocity, , can usually be estimated from the profile of the C III 1176 multiplet. As shown in Fig. 6, individual components of the multiplet start to merge as increases. The profile of C III 1176 is a useful diagnostic at all rotational velocities seen in our sample, from km s-1 or less (NGC 346 MPG 487) to km s-1 or more (AV 80).
Other reasons to expand the list of lines for spectral analysis from just the three strong H and He lines are to check for consistency and to make finer distinctions. Fig. 7 compares the helium spectrum of AV83 (O7Iaf+) and AV69 (OC7.5III). Despite their different spectral classifications, the line strengths of He I 4471 (a triplet) and He II 4542 are identical, and our models indicate that the two stars have similar effective temperatures, 35,000 K. However, the He I singlet lines are different in the two spectra: they are strong in AV69 but almost absent in AV83. Our models, which match both the singlet and triplet lines of He I, indicate that this difference is due to the higher surface gravity of AV69 () than in AV83 (). He I singlets respond differently from He I triplets to non-LTE effects on the level populations because of the different structure of their energy levels (singlet lines are connected to the ground level of helium, whereas the lowest triplet level is metastable). Because of its lower gravity (lower atmospheric density), non-LTE effects are stronger in the spectrum of AV83. The weaker Stark-broadened wings of the Balmer lines and the strong emission of He II 4686 provide consistency checks for the lower gravity of AV83.
4.2 Temperature Estimation from Metal Lines
As discussed above, we made full use of hydrogen and helium lines in the optical spectrum for calibration. However, because of problems with nebular masking of He I lines (Fig. 5), we also use lines of heavier elements for estimating temperature. Below, we describe how optical and UV metal lines can be used as supporting evidence on .
Most metal lines in the optical spectral region can appear in either absorption or emission. These “Of emission lines” include N IV 4058, Si IV 4088, 4116, N III 4634-41, C III 4647-51, and S IV 4486, 4503. There is observational and theoretical evidence that the emission is due to non-LTE effects (overpopulation of the upper level of a transition) rather than to emission in an extended atmosphere. As shown in Fig. 8, our plane-parallel models with show noticeable N IV 4058 emission at K if N=N☉; N III 4634-41 emission occurs at K if N N☉; but Si IV 4088, 4116 emission occurs only at very high temperatures ( K) and then, only weakly. However, before we can use these lines to make reliable estimates of and abundances, we must first improve the treatment of dielectronic recombination as well as the model atoms, because these lines involve highly-excited energy levels.
We therefore directed our attention to the UV metal lines, which provide useful supporting material for temperature estimation, especially for those stars whose H I and He I lines are masked by nebular emission. Fig. 9 illustrates the case of the carbon ionization balance. While both C III 1175 and C IV 1169 grow stronger with increased gravity, higher carbon abundance and microturbulent velocity, the ratio of line strengths is most sensitive to temperature, so the effective temperature can be estimated with reasonable accuracy, although there is a small offset toward higher temperatures ( K) if a nebular carbon abundance is assumed. Despite its successes, UV metal lines cannot be the primary and only means of estimating effective temperature because the ionization level of an element depends on gravity as well as temperature (). Contrary to the optical spectrum, gravity cannot be derived in the UV from the H I Lyman lines because they are masked by interstellar absorption.
4.3 Sensitivity of Photospheric Spectrum to Fundamental Parameters
The main objection to photospheric analysis is that photospheric lines strong enough to be measured may already be saturated. To investigate this possibility, we computed a set of model UV spectra over the temperature range, = 30,000 – 50,000 K, for and km s-1. These spectra are shown in Fig. 10 (only Fig. 10a is shown in the paper edition). Table 2 gives a summary description of the key UV lines that are sensitive to temperature but not significantly contaminated by interstellar contributions. The range of over which a spectral is sensitive to temperature is listed for models with . At lower gravity, the temperatures are about 2000 K higher. As expected, resonance lines of abundant elements like C IV 1549 are insensitive to temperature because they are saturated. Some subordinate lines, such as C IV 1169 and S V 1502, are not useful temperature indicators by themselves because their strength does not change monotonically with , although they can be used for ionization balance (see Fig. 9). Most of the lines that are sensitive temperature indicators arise from ions that are in trace ionization states. Below 35,000 K, most lines in Table 2 are insensitive to temperature. There are other, lower-ionization lines that could, but they are usually contaminated by interstellar contributions. Excited lines of these ions such as Si III 1294-1303, are a good temperature indicators for late O and early B stars (see Fig. 10j). Fortunately, the optical He I and He II lines work very well to determine of late O-type stars. For very early O stars, we have the opposite problem: helium ionization balance does not work because He I lines are no longer present. Likewise, C III lines at 1176 and 1247 Å have also disappeared. New criteria for spectral classification and analysis must be used. Walborn et al. (2002) define O2-type stars as those in which N IV 4058 emission is stronger than N III 4634-41 emission lines. As shown in Fig. 8, such stars must have K. We find that O V 1371 and the Fe VI 1260-1280 complex present adequate criteria for very hot stars in the UV as shown in Fig. 10i and 10r.
4.4 Ionization Balance and Surface Gravity
It is well known from the Saha equation that the level of ionization depends not only on temperature but also on the atmospheric density, or surface gravity. Departures from LTE amplify this dependence, because NLTE “overionizes” a species relative to LTE, and this effect is larger at lower densities. As discussed in connection with Fig. 7, the differences in He I line strengths are mainly the result of different surface gravities. Fortunately, the C IV/C III ratio is nearly independent of gravity (Fig. 9).
The iron ionization level is also a good indicator of temperature of O-type stars: Fe IV lines are strong in late O stars, Fe V dominates in mid-O-type spectra, and Fe VI lines are present in early-O spectra (see Fig. 9 of Lanz & Hubeny 2003). To investigate the effect of gravity on the iron ionization balance, we take advantage of the numerous Fe IV and Fe V lines in the ultraviolet to construct an ionization index,
By using equivalent widths, we account automatically for differences in the continuum of different models. We display this ionization index for the ‘S’ models in Fig. 11. The index increases with as ionization increases, but the index is also sensitive to gravity, except around K (at high temperatures, Fe IV lines weakened and the index also measures the contribution of other lines in the selected range). If can be determined from the carbon or helium lines, then we can determine the surface gravity of O stars from UV iron lines if the metallicity and microturbulent velocity are known. In practice, we used the iron ionization index as supporting evidence for the parameters derived from the He and C lines () and from the Balmer line wings (), searching for a consistent match of the complete spectrum.
The idea of using the iron ionization balance to determine surface gravities can be extended to early B/late O stars using the Fe IV to Fe III balance and to early-O stars by using the Fe VI to Fe V balance. The range of gravities in early-O stars is however limited; moreover, the integrated contribution of Fe VI lines in the 1250-1300 range remains small (see Fig. 10r) making the definition of a sensitive index difficult.
The case of iron ionization illustrates well the potential of using lines from different species to determine the stellar parameters. For instance, the Si IV resonance lines are also known to be sensitive to luminosity (Walborn & Panek, 1984; Howarth & Prinja, 1989). Matching the full UV and optical spectrum provides additional checks and reliability that analyses based on H and He lines only lack. A crucial ingredient, however, is an extensive treatment of NLTE line blanketing – as incorporated in TLUSTY and CMFGEN models – to ensure that ionization balance of heavier elements is predicted accurately.
4.5 Microturbulence and Abundances
“Microturbulence” was first invoked by Struve (1932) to explain the large Doppler widths of lines seen in supergiant spectra. Although a useful device for matching observed line strengths, microturbulence plays havoc with abundance determinations. As Kudritzki (1992) warned, photospheric models ignoring the presence of an atmospheric velocity gradient may require significantly higher microturbulent velocities to achieve the same equivalent widths. Velocity fields are essential for determining abundances of weak ‘pseudophotospheric’ metal lines in relatively dense winds in which these lines are formed around the sonic point. In less dense stellar winds, as those observed in SMC O stars, metal lines are formed deeper in the quasi-static photosphere. Using CMFGEN wind models, and thus accounting for the velocity field, we had nevertheless to adopt microturbulent velocities between 5 and 20 km s-1 to match the observed strength of UV metal lines (Hillier et al., 2003; Bouret et al., 2003). The effect of microturbulence can be seen in the left panel of Fig. 9, where an increase in from 10 to 20 km s-1 is more than enough to compensate for a factor of 2.3 lower carbon abundance. No model to date, either photospheric or unified model, has evaluated the depth-dependent velocity fields in the subsonic regions of an atmosphere. The main point for this study is that the temperature derived from the C IV/C III ratio (Fig. 9, right panel) is changed in only a minor way by the assumed microturbulent velocity.
The abundance of oxygen in the H II regions in a galaxy is often taken as an indicator of the overall metallicity of the stellar population. Recent studies of H II regions in the SMC concur on an oxygen abundance555Throughout this paper, abundances are given in logarithm of the number density, in a scale where the hydrogen abundance is [H]=12.0, [O]= 8.1 (e.g., Garnett et al. 1995, Kurt et al. 1999), that is, one fifth of the solar value. Stellar studies in the SMC of F-K supergiants (Spite et al., 1989), of A supergiants (Venn, 1999), and of O stars (Haser et al., 1998; Hillier et al., 2003; Bouret et al., 2003) yield metallicities consistent with the nebular value. These same studies, however, show that the N/C abundance ratio is not solar. Table 3 provides a compilation of SMC abundances derived from analyses of H II regions and B and A-type stars. In our spectral analysis (§5), we started out using the ‘S’ grid of model spectra supplied by Lanz & Hubeny (2003). In the S grid, metal abundances are uniformly set to one fifth of their solar values. In agreement with previous abundance studies, we soon found that we had to modify the abundance mix and/or the microturbulent velocity to achieve a match with observations. The nebular analyses suggest that the S grid of model spectra should be adequate for elements other than nitrogen and carbon. However, the S models overestimate both the nitrogen and carbon abundances if the stellar surface abundances still reflect the original, nebular abundances. We therefore re-computed the spectra based on the S grid of model atmospheres, but this time with SMC nebular abundances for CNO and with the SMC A-star abundance for Si and Fe. We refer to these model spectra as the ‘NEB’ grid of spectra. Evolutionary models of rotating SMC stars show that there can be considerable enhancement of the surface abundance of nitrogen in the main-sequence phase (Maeder & Meynet, 2001), supported by our analysis of NGC 346 stars (Bouret et al., 2003). We therefore calculated another series of spectra, this time with solar nitrogen abundance, which we call ‘N5X’ spectra. Thus, the nitrogen abundance in the various spectral grids range over a factor over 30 (N/N). Maeder & Meynet (2001) predict that helium enrichment occur at much later phases. We therefore employed a solar helium abundance for all the spectral grids. In our analyses, we did not find any evidence to the contrary, although Hillier et al. (2003) report that helium may be enhanced in the atmosphere of AV83. Table 3 summarizes also the abundance mix of the various models.
The results of our sensitivity study of previous sections indicate that the S models can be used for a first estimate temperature from the He II/He I and the C IV/C III line strength ratios. However, the carbon-based temperature so derived can be up to K too low if the microturbulent velocity is higher than assumed in the S model ( km s-1) and/or if the carbon abundance is lower than assumed in the S model (C/C☉ = 0.2). A knowledge of can be found from the strengths of the O IV 1340 triplet and S V 1502 line, which are assumed to have abundances close to one-fifth solar.
5 SPECTRAL ANALYSIS
For consistency, we used as a starting point the same spectral-classification lines of hydrogen and helium to determine effective temperature and surface gravity. In addition, we took advantage of high-resolution UV spectra from STIS and FUSE, which enabled us to extend the principle of ionization balance to other elements, such as carbon, iron, and sulphur. In all cases, we assumed that program stars are single and that rotation works only to broaden the spectral lines. Our model grid samples the parameter space as in Lanz & Hubeny (2003), with 2500 K steps in temperature and 0.25 dex in gravity. In several cases, it was obvious that the best match to the observations could be achieved with a model between grid points. As discussed by Lanz & Hubeny (2003), we interpolated the atmospheric structure and the NLTE level populations for the adopted temperature and gravity, before recomputing the spectrum.
We estimated errors on the derived parameters by comparing observations and models with parameters close to those adopted. Models that can be clearly excluded thus provide an upper limit to uncertainties. Conservatively, we estimated errors to be 2000 K in , 0.2 dex in , 5 km s-1 in , and less than a factor of 2 in abundances. The accuracy might be better in some cases. The results of our analysis are summarized in Table 4. We discuss our results for each individual object in the following sections.
5.1 O-type Dwarfs
All six O-type dwarfs in the sample are members of the young cluster, NGC 346. Together, they cover the full range of O spectral types, from O4V to 09.5-B0V, so they are useful in establishing the age of the cluster. We refer to them by their MPG number (Massey et al., 1989). We also include here NGC 346 MPG 355 (ON2III; Walborn et al. 2002), as part of the dwarf sequence because of its proximity to the zero-age main sequence. MPG 355 and MPG 12 (O9.5-B0V (N strong)) have anomalously strong nitrogen features in their spectra, while MPG 113 (OC6 Vz) has anomalously strong carbon lines in its spectrum according to Walborn et al. (2002). This disparity in nitrogen or carbon predominance implies that evolutionary abundance changes have already taken place in some members of NGC 346. Our approach as described below was to analyze the spectrum of each star independently and only then to attempt to discern evolutionary abundance patterns. Unless noted otherwise, we make use of the ‘S’ model spectra (, =10 km s-1) for analysis.
Bouret et al. (2003) already reported on the NGC 346 stars, based on an analysis conducted fully independently to the present study. They used both TLUSTY and CMFGEN models to match photospheric and wind lines. They obtained an excellent agreement between the two codes demonstrating that most lines are indeed formed in a quasi-static photosphere. The results of the two studies are consistent.
NGC 346 MPG 355 (ON2III(f∗)).— Earlier studies of this star (Kudritzki et al., 1989; Haser et al., 1998) estimated the stellar parameters, = 55,0005000 K, =3.90.1. We also find a very high temperature, = 52,5002000 K, and . A high temperature is inferred from the strength of N V4603, 4619 relative to N IV1718, the strength of Fe VI relative to Fe V lines in the UV, and the emission strength of N IV4058, 7109, 7123 and of C IV5801, 5812. An unusually high microturbulent velocity, = 25 km s-1, is required to match the strength of metal lines in the UV. The atmosphere appears to be greatly enhanced in nitrogen to solar or super-solar values. The C IV5801, 5812 emission lines are well fit by a model with the nebular carbon abundance. We were not able to analyze O V1371, N IV1718, or He II1640, because these lines are asymmetric and presumably arise in the wind. (See Bouret et al. 2003 for a discussion of the wind properties).
NGC 346 MPG 324 (O4V((f))).— Visible structure in the C III1175 feature and the sharpness of UV Fe and Ni lines imply a rotational velocity, km s-1. At this , He I4471 is relatively narrow, so most of the line profile is contaminated by nebular emission, and the line cannot be used for helium ionization balance. In the UV, the ionization balances of C IV/C III and Fe V/Fe IV point toward a temperature slightly hotter than = 40,000 K with =4.0. The optical H I, He I and He II lines are consistent with this result. N IV1718 and the Si IV1400 doublet are well fit by the model. The strengths of O IV1340 triplet and S V1502 imply a high microturbulent velocity, = 15 km s-1. Nitrogen is enhanced but not to the extent of the enrichment found in MPG 355. The absence of C IV5801, 5812 indicates a low carbon abundance.
NGC346 MPG 368 (O4-5V((f))).— The optical spectrum of this star is quite noisy and heavily contaminated by nebular emission. In addition, the severe disagreement in the radial velocity of the star measured from the optical (130 km s-1) and from the UV (200 km s-1) spectrum suggests either that MPG 368 is a previously undetected spectroscopic binary or that different stars were observed by HST and the AAT. Nevertheless, a model with = 40,000 K, , = 15 km s-1, and enhanced nitrogen and low carbon abundances, produces an acceptable fit to both optical and UV CNO lines (e.g., N III1182, 1184, 4097, 4631, 4634; N IV1718). This same model produces a poor fit to the blue spectrum: the model hydrogen and helium lines are all too strong.
NGC346 MPG 113 (OC6Vz).— In the spectrum of this star, the components of the C III1175 multiplet are nicely resolved, implying a low rotational velocity, km s-1. The best-fit model in the grid has the parameters, = 40,000 K and . The nitrogen and carbon lines are best fit with a SMC nebular abundance.
NGC346 MPG 487 (O8V).— Like MPG 113, this star has a very sharp-line spectrum ( km s-1). The H and He lines indicate = 35,000 K and . However, most of the model UV metal lines are too strong even if lower metal abundances are assumed. Lowering the microturbulence to km s-1 greatly ameliorates the problem. The carbon and nitrogen lines favor a low (nebular) abundance.
NGC346 MPG 682 (O9-O9.5V).— Because of a failed target acquisition by STIS, we cannot be sure that the target observed was really MPG 682. We therefore restricted our analysis to the optical spectrum only. The best fit model is = 32,500 K and , with low (nebular) carbon and nitrogen abundances.
NGC346 MPG 12 (O9.5-B0V).— Two models, = 32,500 K and , and = 30,000 K and , fit equally well the UV and the optical spectrum. So, we adopted intermediate parameters, = 31,000 K and . The Si IV1400/Si III1296 balance constrains well the parameters. Our best fit requires that km s-1. Even with a relatively low microturbulent velocity, we derived a low carbon abundance to fit C III1175, 1247, 4650. The nitrogen abundance had to be enhanced to nearly solar value in order to match the observed N III4097, 4634, 4641 and N IV1718.
5.2 O-type Giants
With the exception of AV80, all the O giants in the sample have been observed by FUSE as well as STIS. The extension of the observed spectra into the FUSE spectral range (904 – 1187 Å) provides additional elements for ionization balance, such as N IV1718/N III980 (if N IV1718 was included in a STIS spectrogram) and S V1502/S IV1073, as well as giving additional evidence on elemental abundances.
AV80 (O4-6n(f)p).— This star is a hotter analogue of a Be star in showing rotationally broadened lines and double-peaked emission of He II4686. Because of the high rotational velocity ( km s-1), only the strongest lines, such as the H and He lines and C III1175, are useful for analysis. A model with = 38,000 K and produces an acceptable fit to the observations. The strength of N III4097 (blended with H), moderately strong emission of N IV4058 (unmatched by the model), and a strong N V1240 P Cygni feature indicate that nitrogen is enhanced, but the N III line cannot be used to derive a quantitative estimate and the model does not reproduce the N IV and N V lines formed in the wind. The UV carbon lines indicate a low carbon abundance. In the UV, the iron lines, O IV1340 and S V1502 indicate a high microturbulence, km s-1.
AV75 (O5III(f+)).— The H and He lines indicate = 38,500 K and or lower. The moderately strong N III4634, 4641 emission and strong N III980 absorption together with the absence of N IV4058 emission are compatible with this estimate, as are the C IV/C III, S V/S IV, and Fe V/Fe IV ion ratios. There are indications of a strong nitrogen enhancement and a low (nebular) carbon abundance. Spectral lines of P V, S V, Si IV – elements not involved in nuclear processing – are all stronger than predicted unless the microturbulence is increased to km s-1.
AV 220 (O6.5f?p).— The question mark in the spectral classification does not signify a question of whether the star is an Of-type star. The spectrum of AV 220 shows very strong He II4686 emission, the defining characteristic of Of-type spectra. Instead, the question mark denotes doubt that it is a normal Of supergiant because the C III4650 emission lines are as strong as the N III4634, 4641 emission lines. Walborn et al. (2000) assert that such spectral peculiarities involve “ejected shell phenomena”. Our models are inappropriate for such stars, so our results are uncertain. Although the spectrum is rather noisy, it is clear that the UV lines are quite sharp, indicating a rotational velocity, km s-1. Whether these sharp lines are shell lines or true photospheric lines is an open question. It is interesting to note that the FUSE spectrum reveals many narrow features, like the excicted S IV1100 lines, along with broad features, as the resonance S IV1063, 1073 or P V1118 lines. The C III1175 also show remarkable changes between the FUSE (broad saturated line) and STIS (weaker line with narrow components visible) spectra, thus providing a direct evidence of changes in the circumstellar environment of AV 220. An in-depth analysis of AV 220 remains beyond the scope of this paper. Ionization balance of carbon and iron lines in the UV implies = 37,500 K and . Based on the relatively high gravity, we list AV 220 along with the O giants rather than with supergiants. The observed strengths of N III980, 4097 indicate that nitrogen is highly enhanced. Our model with a solar nitrogen abundance matches well the N III4634, 4641 emission lines, although it fails to reproduce the C III4650 emission lines. The strengths of the O IV1340 triplet and of the S V1502 line imply that km s-1.
AV 15 (O6.5II(f)).— We derive the parameters, = 37,000 K, , with the following adjustments. A model with km s-1 is needed to match the strength of the numerous Fe V lines, the O IV1340 triplet and the S V1502 line. The observed strengths of N III980, 4097, 4634, 4641 imply an enhanced nitrogen abundance, while the UV carbon lines imply a low (nebular) carbon abundance.
AV 95 (O7III((f))).— A model with = 35,000 K and results in a good fit to the optical spectrum, as well as to the UV carbon, iron, and sulphur lines. The observed strength of N III4097 and the N III emission lines imply an enhanced nitrogen abundance, while the UV carbon lines imply a low (nebular) carbon abundance.
AV 69 (OC7.5III((f))).— Walborn (1976) and Walborn et al. (2000) suggest that the OC stars are actually normal stars in having CNO abundances that reflect the material out of which the stars formed. We find a very good fit to the FUSE+STIS spectrum of AV 69 for a ‘NEB’ model with = 35,000 K, =3.4, and km s-1, in agreement with the detailed study of Hillier et al. (2003). Our final adopted abundances are slightly higher than those of the ‘NEB’ models, yielding an excellent fit to the C III1176, 1247 and C IV1169 as well as N III980. Based on the latter, our nitrogen abundance is up to a factor of 3 higher than the very low value adopted by Hillier et al. (2003).
AV 47 (O8III((f)).— Walborn et al. (2000) call the spectrum of AV 47 “entirely normal for its (SMC) type”, and is quite similar to the spectrum of AV 69 (in particular the UV Fe lines). The Balmer lines are, however, broader. Our best model, = 35,000 K and produces an adequate fit to the UV and optical spectrum, although the UV Fe IV and some optical He II lines are predicted too strong. The adopted is the best compromise between a higher temperature indicated by the Fe IV lines and a lower value by the He II lines. Additionally, we needed to adopt low (nebular) abundances for carbon. The nitrogen abundance is difficult to determine accurately, but N III1182, 1184, and 4097 are fitted with an abundance one fifth solar.
AV 170 (O9.7III).— The absence of C IV1169, the strong Si III1296, and the strong Fe IV lines indicate a low . The best fit model has = 30,000 K, . Nitrogen is clearly enhanced over that of a ‘S’ model, and we consistently match N III980, 1182, 1184, 4097 with a solar abundance. Moreover, we derived a low carbon abundance from C III1175, 1247. To reproduce the iron line strengths, we had to adopt a low microturbulence velocity, km s-1.
5.3 O-type Supergiants
AV 83 (O7Iaf+).— We derived the same temperature ( = 35,000 K) as for AV 69 (OC7.5III((f))), but a lower gravity, . As previously noted by Hillier et al. (2003), the two stars have virtually identical optical spectra in some respects, such as the strengths of He I4471, 4713 and He II4542, 4200. However, a lower surface gravity of AV 83 is clearly indicated by (1) the weaker wings of the H I Balmer lines, (2) the strong emission of He II4686, and (3) the lack of He I singlets at 4143, 4387, 4922 Å (they appear in absorption in the spectrum of AV 69). The weakening of the He I singlets is used as an indicator of luminosity-class (Walborn, 1971), but our models show that they disappear fully only at temperatures of 35,000 K and above. The UV spectral region indicates a strong wind (Hillier et al., 2003), so that many of the diagnostic lines such as C III1175 appear as P Cygni lines and cannot be reproduced by our static, plane-parallel models. However, ionization balance of the iron lines (Fe V vs. Fe IV) is still possible and is consistent with a temperature of 35,000 K. All the photospheric lines in the UV spectrum indicate a high microturbulent velocity, km s-1.
AV 327 (O9.5II-Ibw).— In addition to the H I Balmer lines, the silicon and the iron ionization balance indicate a low gravity. We obtained a best match to the spectrum with = 30,000 K and . Nitrogen is highly enriched, and the carbon abundance is very low (lower than the neb model) as indicated by C III1247, 4650. We adopted a microturbulent velocity, km s-1.
6 RESULTS AND DISCUSSION
Table 4 summarizes the results of our analysis and readily reveals several trends. First, there is a good correspondence (obviously expected!) between spectral class and fundamental parameters. The only two exceptions are AV 220 and AV 47, which have somewhat higher gravities than expected from their assigned luminosity class. Second, the microturbulent velocity decreases from early to late O stars, as previously suggested by Bouret et al. (2003). Large microturbulent velocities are a common feature of giants and supergiants. The late-O supergiant, AV 327, has a large microturbulent velocity similar to those found in early B supergiants (e.g., Trundle et al. 2004). The high levels of microturbulence derived in our analysis are not a spurious result of static models. Similar large values of the microturbulence are derived from wind models such as CMFGEN (Bouret et al., 2003) and FASTWIND (Trundle et al., 2004). Third, all supergiants and all giants except AV 69 show significantly enhanced nitrogen. Nitrogen enrichment is also found in the early-O dwarfs, whereas late-O dwarfs show nebular abundances reflecting their original composition. The only exception is MPG 12 which is actually near to the terminal-age main sequence (TAMS). Surface abundances are further discussed in §6.5.
6.1 Fundamental Stellar Parameters
We calculated the radius of each star from the basic formula:
where is the observed visual flux of the star corrected for reddening, is the intrinsic visual flux, i.e. luminosity per square centimeter at the stellar surface, and is the distance to the SMC. We used an IDL version of Kurucz’ program, UBVBuser, to calculate TLUSTY model colors . We then derived color excesses and visual extinction assuming the standard ratio . All stars have color excesses smaller than 0.15 mag; hence, the reddening correction should not introduce significant uncertainties. We assumed a distance modulus, mag ( kpc), for the SMC.666In previous related papers (Walborn et al., 2000; Hillier et al., 2003; Bouret et al., 2003), we assumed mag; recent studies favor a shorter distance, mag (Harries et al., 2003). For O-type stars, the visual flux scales almost linearly with temperature. The radius is relatively well determined, since both the temperature and distance are known to about 5%.
Given the stellar radius, we then calculated other fundamental stellar parameters,
where the bolometric luminosity (), radius (), and spectroscopic mass () are in solar units. A good consistency check is obtained in using the visual absolute magnitudes and the bolometric corrections extracted from TLUSTY models (Lanz & Hubeny, 2003), thus indicating that uncertainties on are at most dex. Table 5 shows the results for the 17 program stars. The stars are displayed on a H-R diagram (Fig. 12) together with Geneva evolutionary models appropriate for SMC metallicity () from which we interpolated evolutionary masses and stellar ages. We use here evolutionary tracks of non-rotating models, but tracks of rotating models are not very different according to Maeder & Meynet (2001). Although the program stars cover the full range in spectral type and luminosity class, there are holes in the distribution, particularly between 41,500 and 52,500 K. The ON2III star in the sample, MPG 355, is found to be very hot, whereas the one O4 star, MPG 324, is found to be no hotter than 41,500 K. Under the Vacca et al. (1996) spectral calibration, MPG 324 would be assigned a temperature of nearly 49,000 K. The observing program did not probe below =4.9, which corresponds to a mass of about 20 .. All stars but MPG 355 appear well evolved from the zero-age main sequence (ZAMS). This may be a selection effect, in particular for the late O dwarfs. Because the brightest stars of a given spectral type are usually selected for study, there is a risk that they turn out to be binaries. While a significant fraction of Galactic O stars are known binaries (e.g., Maíz-Apellániz et al. 2004), little is currently known for SMC O stars on this topic.
6.2 Luminosities
Figure 13 illustrates that program stars of similar luminosity class show a considerable scatter in bolometric luminosity. For example, the four most luminous stars are giants (luminosity class III or II), not supergiants. Of-type stars are generally regarded as supergiants, but AV 220, one of two Of-type stars in the program, is no more luminous than an O8V star! There appears to be little correspondence between luminosity class and luminosity. Instead, luminosity class is better correlated with the ratio of luminosity to mass. As shown in Fig. 13, O-type dwarfs (luminosity class V) generally have (in solar units); giants (luminosity class III) have ; and supergiants (luminosity class I and II) have . None of the program stars has .
The correspondence between luminosity class and is not surprising. It has been known for more than a half century that some central stars of planetary nuclei (, ) also have O or Of-type spectra (e.g., Heap 1977). The degeneracy of the optical spectrum among stars whose luminosities differ by a factor of 100 demonstrates that the physical basis of luminosity class cannot possibly be luminosity per se. Instead, the spectral characteristics defining luminosity class are responsive to the effective gravity () of the atmosphere, which is lower than the Newtonian gravity () because of the outward-directed force of radiation pressure:
The Eddington factor, , which is the ratio of the luminosity to the Eddington luminosity is related to the luminosity-to-mass ratio by (Mihalas, 1978):
where both luminosity and mass are in solar units. The fact that most program stars show a good correspondence between luminosity class and ratio suggests that radiation pressure () is the primary means of lowering the effective gravity. However, no star has a close to the predicted limit of about 38,000, which suggests that some other mechanism(s) besides radiation pressure is at work. That other mechanism is almost certainly centrifugal acceleration. Maeder & Meynet (2001) defined a factor, , analogous to the Eddington factor; hence, accounting for the levitating effect of rotation, the effective gravity becomes:
where
with the angular velocity and the average density internal to the surface equipotential. We interpret the relatively high ratio of AV 83, AV 327, and AV 170 as the effect of rapid rotation. This interpretation is bolstered by their high nitrogen abundance caused by rotationally induced mixing of nuclear-processed material to the surface (); moreover, the apparently slow acceleration of the wind of AV 83 suggests that it is enhanced in the equatorial plane and that the star is seen pole-on (Hillier et al., 2003). For AV 47, we derive a surface gravity that is more typical of main sequence stars in agreement with its low ratio. On the other hand, the high value for MPG 368 is not surprising as we argued that it might be a binary. Finally, the peculiar spectral type of AV 220 makes it difficult to reach a conclusion.
6.3 Effective Temperature Scale
The relation between our effective temperatures and spectral type is shown in Fig. 14. For earlier-type O stars, the relation depends totally on the ON2 III(f*) star MPG 355. For a given spectral type, the more luminous stars have a lower effective temperature, a well-known result for Galactic O stars. The full lines in Fig. 14 indicate the new relations for low metallicity O stars. The calibrations connect straightforwardly our values, without attempting a least-square fit because of the size of the stellar sample.
Our effective temperatures are lower than the “standard” calibration established by Vacca et al. (1996) from results based on NLTE H-He model atmosphere analyses. Similarly all recent studies based on NLTE metal line-blanketed model atmospheres found lower , starting with Hubeny et al. (1998), Martins et al. (2002), Crowther et al. (2002), and Heap & Lanz (2002). Our temperatures are typically 10% lower than Vacca’s for mid to late-O stars. The difference increases to 15-20% at spectral type O4 and O5.
All other recent determinations for O stars are based on NLTE unified model atmospheres calculated with three codes, CMFGEN (Hillier & Miller, 1998; Hillier, 2003), FASTWIND (Santolaya-Rey et al., 1997), and WM-basic (Pauldrach et al., 2001). CMFGEN incorporates metal line-blanketing in a detailed, similar way to TLUSTY, and we showed that an excellent agreement is reached when analyzing O stars with TLUSTY and CMFGEN (Bouret et al., 2003). On the other hand, for the sake of faster computation, FASTWIND and WM-basic treat metal line blanketing in an approximate way. Moreover, our study, as well as analyses conducted with CMFGEN, benefit from analyzing the complete far-UV and optical spectrum, while FASTWIND analyses (Herrero et al., 2002; Repolust et al., 2004; Massey et al., 2004) are based solely on the optical hydrogen Balmer and helium lines, and WM-basic models have been used to match only the UV metal lines without considering the optical spectrum (Bianchi & Garcia, 2002).
We have extracted over 60 new determinations of Galactic and SMC O stars based on these recent analyses, and we compare them in Fig. 15. All new values are lower than Vacca’s. Fig. 15 shows, however, a relatively large scatter for any given spectral type. We discuss these determinations for each spectral type.
O2–O3.— Walborn et al. (2002) splitted the original O3 spectral type into 3 types, O2, O3, and O3.5, depending on the relative strength of nitrogen emission lines in the optical spectrum. Walborn et al. (2004) support our high effective temperature for the ON2 III(f*) star MPG 355. They derive similar high temperatures (52,500 to 55,000 K) for 4 other O2 stars in the LMC. On the other hand, Repolust et al. (2004) derived a low temperature for the Galactic O2 supergiant HD93129A, = 42,500 K, admitting however that this value might be spuriously low because of spectrum contamination by a companion. As indicated by their different spectral morphology, O3 stars have lower temperatures, in the range from 46,000 to 48,000 K (Martins et al., 2002; Repolust et al., 2004).
O4–O5.5.— There are about 20 new determinations in this spectral range, with all clustering around 40,000 K with a scatter of 2,000 K. There are three notable exceptions. First, Massey et al. (2004) derived high values for the O5 V star AV 14 (44,000 K), and for the O5 V((f)) star AV 377 (45,500 K). Nebular He I line filling might the culprit; they also derived a surprisingly large helium enrichment (He/H=0.35) for the latter star. Second, Bianchi & Garcia (2002) obtained a low temperature for the O5-6 III(f) star HD 93843 (34,000 K).
O6–O6.5.— The 6 values obtained with TLUSTY and FASTWIND yield a typical of 38,000 K with a scatter of 2,000 K. Within the O6 type, Bianchi & Garcia (2002) analyzed 4 Galactic stars covering all luminosity classes with WM-basic and consistently found markedly lower temperatures, = 33,0001,000 K.
O7–O7.5.— The 15 new generally cluster around 35,000 K with a range of 1000 K. However, lower temperatures are obtained for two extreme O7Iaf+ SMC supergiants, 32,000 K for AV 232 (Crowther et al., 2002) and 33,000 K for its twin AV 83 (Hillier et al., 2003). Note that our photospheric analysis of AV 83 favors = 35,000 K. Although the low temperatures derived for AV 232 and AV 83 agree with the value derived for the Galactic O7 Ib(f) star (33,000 K; Bianchi & Garcia 2002), we note that the spectral type of the latter indicate that it is not a supergiant as extreme as the two SMC stars.
O8.— Much fewer determinations are available at spectral type O8, indicating a typical value around 34,000 K with a scatter of 1000 K.
O9.— The 6 values derived with TLUSTY, CMFGEN, and FASTWIND cluster in a limited range between 31,500 and 33,000 K, leading to assign a typical temperature of 32,500 K for O9 stars.
O9.5.— The 9 values span a range between 29,000 and 32,000 K with no obvious outlier. We assign therefore = 30,5001,500 K to the O9.5 type.
In summary, we generally find a good agreement between results based on TLUSTY, CMFGEN, and FASTWIND models. However, temperatures derived from the UV metal line spectrum with WM-basic by Bianchi & Garcia (2002) are systematically lower by 2,000 to 6,000 K compared to other results. The typical error quoted on individual results are 1000 K in favorable cases to more typically 2000 K, which means that the error bars cover the span of temperatures found at a given spectral type.
Because of the large scatter in current results, it remains difficult to characterize empirically the dependence of the temperature scale on metallicity. In past works, as well as in the recent studies based on FASTWIND models, classification and calibration of O-type spectra rely almost exclusively on the hydrogen and helium lines, so there is no direct dependence of the temperature scale on metallicity. Some dependence is, however, expected, because of weaker metal line blanketing and weaker wind feedback onto the photosphere. Along these lines, based on FASTWIND modeling of hydrogen and helium lines, Massey et al. (2004) argued that early to mid O stars in the SMC have temperatures higher by up to 4000 K compared to similar Galactic stars, while the differences are smaller for later O stars. On the other hand, results from CMFGEN and TLUSTY models using additionally UV metal lines indicates cooler temperatures in some SMC stars than in Galactic stars. We argue that the high temperatures derived in a few cases by Massey et al. (2004) might be a spurious consequence of He I line contamination by nebular emission. Indeed, the nebular contribution to He I lines cannot be corrected as well for SMC stars as for Galactic stars because of the larger distance, hence the smaller apparent size of the nebulosity, thus resulting in possible overestimation of in SMC stars. We therefore stress that additional temperature indicators beyond the helium lines are extremely helpful.
As illustrated in Fig. 15, the current scatter in the results makes hardly possible to reach a conclusion about a systematic difference between Galactic (filled symbols) and SMC (open symbols) stars and, therefore, to offer a quantitative relation tying the temperature scale to metallicity — which would be a great help for studies of the first generations of massive stars. We are extending our analysis based on CMFGEN and TLUSTY models to a significant sample of Galactic stars for providing the adequate comparison sample in order to arrive to a fully satisfactory conclusion. Until then, and because of the consistency of the results derived from CMFGEN wind models and TLUSTY photospheric models, as well as our comprehensive analysis of the various spectral diagnoses, we recommend to use the present results as the temperature calibration for low metallicity O stars (Table 6). Alternatively, the calibration based on all recent studies of O stars can be used as a general -spectral type relation (bottom panel of Fig. 15).
6.4 Ionizing Luminosities
For each star, the adopted TLUSTY model provides the bolometric correction and ionizing fluxes, and , in the hydrogen Lyman ( Å) and neutral helium ( Å) continua, respectively. The ionizing flux in the He II continnum ( Å) is highly sensitive to emission from shocks in the stellar wind and, therefore, our photospheric models cannot provide relevant values. Using previously derived stellar radii, we then obtain the ionizing luminosities, and . Fig. 16 displays effective temperatures, bolometric corrections and ionizing luminosities together in relation with spectral type. Following lower , we obtain lower bolometric corrections and lower luminosities, compared to previous standard calibrations (Schmidt-Kaler, 1982; Vacca et al., 1996).
For O dwarfs, our estimates of the ionizing luminosities are on average a factor of 2 to 3 smaller than values derived from Vacca et al. (1996), and . For giants, the differences are even larger, though we found a notably larger scatter. On average, the differences are and . Although Vacca et al.’s calibrations were established for Galactic stars, we compare them to our results for low metallicity stars. The OSTAR2002 models, however, indicate that the effect of metallicity on ionizing fluxes is quite limited, decreasing by 0.02 dex but increasing by less than 0.1 dex. Therefore, our results imply a substantial downward revision of ionizing luminosities of O stars. Consequences for models of H II regions and for the ionization of the interstellar and intergalactic medium need to be evaluated.
Table 7 provides our new calibration of bolometric correction and ionizing luminosities with spectral type.
6.5 Surface Abundances
Our previous study of the spectra of O stars in the SMC (Walborn et al., 2000) raised several important questions concerning the abundances of the elements and their relation to evolutionary properties of the stars. In NGC 346, the nitrogen surface abundance is enhanced in all but one of the 7 program stars (Bouret et al., 2003), while AV 83 and AV 69 exhibit striking differences in surface composition even though they have near-identical stellar parameters (Hillier et al., 2003). With our larger sample, we are now in position to revisit the question of the surface enrichment of massive stars during their evolution, how it increases with mass, extent of evolution from the ZAMS and/or rotational velocity, and finally to compare our results with the predictions of stellar evolution models.
As outlined in §4.5, the results of chemical abundance analyses are tied to the microturbulent velocity, which we derived by simultaneously matching O IV1338-1342, S V1502, and a multitude of iron lines. We list the adopted values in Table 4. In most cases, we derived a microturbulent velocity, km s-1, consistent with the large values obtained from the CMFGEN wind models (Bouret et al., 2003), which are therefore not an artefact of static models. As hinted by Bouret et al., our results suggest that microturbulence decreases towards late-O spectral types, particularly in the case of the O dwarfs. Stellar metallicities, as derived from iron and oxygen lines, are given in Table 4. Except for MPG 487 which has an anomalously weak line spectrum, we consistently get values that are one fifth of the solar value. Because of this agreement within a relatively large sample, we conclude that this value () is well representative of the current metallicity of the SMC, in agreement with metallicities measured in earlier studies limited to fewer stars (Venn, 1999; Bouret et al., 2003). In all cases, we could match the He I and He II lines using the solar helium abundance and the adopted microturbulent velocities. No indications of surface helium enrichment are found in this sample, agreeing with the predictions of stellar evolution models that account for the effects of rotation (Maeder & Meynet, 2001). On the other hand, only three of the program stars show nitrogen abundances as low as the SMC nebular value, N/N. We adopt this value as the initial abundance relative to which we evaluate the nitrogen enrichment of the other stars. These three stars have a carbon abundance equal to the nebular abundance, C/C, that we adopt as the initial carbon abundance. The N/C abundance ratios discussed below (and in Table 4) refer to these adopted values.
Fig. 17 shows the program stars on a HR diagram with symbols denoting their measured N/C abundance ratios. It also shows the ZAMS and the TAMS for non-rotating models (Charbonnel et al., 1993). Maeder & Meynet (2001) showed that models with rotation have longer main-sequence phase, with a shift of the TAMS to lower temperatures. There is no clear evidence that the N/C ratio increases with evolution away from the ZAMS, or with effective temperature or luminosity. Conversely, stars with near-identical parameters may have very different surface compositions. For example, the three stars, AV 83, AV 69, and AV 47, have similar parameters but show a wide range of N/C ratios (Table 4). Hence, evolution alone cannot explain the observed N/C ratios and, indeed, classical (non-rotating) stellar evolution models do not predict any nitrogen enrichment during the main-sequence stage. On the other hand, nitrogen enrichment predicted in models with rotationally-induced mixing. Furthermore, Hillier et al. (2003) convincingly argued that AV 83 is a fast rotator while AV 69 is most likely a slow rotator.
We find N/C enhancement ratios (relative to the SMC nebular value) ranging from 1 to 30. These observed enhancement factors are larger than predicted factors of 5-10 for stars with an initial rotational velocity, km s-1. Maeder & Meynet (2001) say that increasing the initial velocity from 300 to 400 km s-1 will not make signifcant changes. Our results may indicate that current rotating models may underestimate the mixing efficiency, although some of the difference may come from Maeder & Meynet’s adoption of a higher initial nitrogen abundance in SMC stars (hence, decreasing the factor of enhancement).
Contrary to the case of nitrogen, all the program stars have a carbon abundance that is consistent with the SMC nebular abundance within the observational uncertainties. Only AV 327 may have a slightly lower abundance. Similarly, the oxygen abundance O/O, that we derived from the relatively weak O III1149-54 triplet (the O IV1338-1342 lines are saturated and O V1371 is sensitive to the wind properties) is consistent with the nebular value. We further discuss the behavior of the CNO surface abundances in relation to the evolutionary status in Sect. 6.7.
Given these results, we are now in a poistion to explain the the spectral morphology of O-type stars. Among the program stars, MPG 355 was classified as an ON star (Walborn et al., 2002), and two, MPG 113 (OC6 Vz) and AV 69 (OC7.5 III((f))), were classified stars as OC stars (Walborn et al., 2000). Our results indicate that a three-fourths of stars in our sample are nitrogen-rich, even though they are not classified as ON stars. Hence, an ON classification may indicate only the most extreme enhancements. On the other hand, an OC classification may simply indicate that the surface abundances have not been altered. In both MPG 113 and AV 69, the optical spectra show emission near C III4650 without any N III4634-4640 emission, and N III4097 is absent. Walborn et al. (2000) suggested that these two stars may actually reflect the composition of the nebular material from which they formed, whereas other supposedly normal stars have undergone rotational mixing. This suggestion is indeed confirmed by our quantitative analysis, showing that the OC classification may be used to identify O stars which are not yet nitrogen-rich, and are thus presumably intrinsically slow rotators.
6.6 The Mass Discrepancy and Rotation
We derived “spectroscopic” masses from the surface gravities and stellar radii (§6.1), and “evolutionary” masses from Geneva evolutionary tracks for single, non-rotating stars (see Fig. 12). For stars more massive than 20 , tracks of models with rotation are not very different according to Maeder & Meynet (2001). In Fig. 12, tracks are labeled by the initial mass of the model. The evolutionary masses remain close to their initial masses () throughout their main sequence lifetimes because of low mass loss rates. We compare the spectroscopic and evolutionary masses in Fig. 18. The figure shows that only three stars (MPG 324, MPG 487, and AV 47) have spectroscopic masses as high or higher than their evolutionary masses. The estimates actually agree within the analysis uncertainties ( would only need to be lower by 0.1 dex or less to reconcile the spectroscopic and evolutionary masses). However, systematically, all the other stars have a spectroscopic mass lower than the evolutionary mass. This disagreement is known as the “mass discrepancy” and has been explored in detail observationally by Herrero et al. (1992, 2002) in their studies of Galactic stars.
Spectroscopic and evolutionary mass estimates actually measure different things. Evolutionary masses follow from the mass-luminosity relation (tracks are almost horizontal in Fig. 12) which is hardly affected by rotation at km s-1. Spectroscopic masses derive from the stellar radius and effective surface gravity. As discussed in §6.2, the Newtonian gravity is lowered by radiation pressure and centrifugal acceleration. As Maeder & Meynet (2001) suggested, rotation is the root cause of the mass discrepancy. Model atmospheres in hydrostatic equilibrium only account for radiation pressure plus gas pressure to balance gravity, so spectroscopic masses are correct only if the centrifugal acceleration is negligible, that is, only for slow rotators. Otherwise, spectrum analyses yield underestimates of stellar mass.
Since the surfaces of rapidly rotating stars are enriched in nitrogen, we should expect the largest nitrogen enhancements in stars with the most severe mass discrepancies. In Fig. 18, we plotted stars with different symbols depending on the measured nitrogen enrichment. However, the success of this test is limited, in part because of the large error bars on the spectroscopic masses (typically, ) and of the small number of stars showing the original composition. Revisiting this expected relation using a larger stellar sample should be very helpful to improve our understanding of the effects of rotation.
We cannot correct the spectroscopic masses for rotation, because we do not know the actual rotation rates (we only have access to ). However, the problem may be turned around and we can use the mass discrepancy as a way to estimate the rotation rates. Using the relations in §6.2 and requiring the two mass estimates to be identical, we derive rotational velocities in the range from 200 to 400 km s-1. All but one star in our sample have low apparent rotational velocities ( km s-1, see Table 4). Preferentially, stars in our sample are thus viewed pole-on. It remains, however, unclear at this point if this is or not a significant bias. For instance, we do not know if the polar and equatorial regions are homogeneously enriched. However, the derived rotation rates are not close enough to the break-up velocity to significantly affect the shape of the stars and, consequently, introduce a bias in the determination of effective temperatures.
6.7 Evolutionary Status and Ages
The program stars cover the full range of luminosity classes, from class V stars to extreme supergiants (AV 83, O7Iaf+). Nevertheless, Fig. 17 shows that all but the two coolest stars (AV 327, AV 170) fall between the ZAMS and the TAMS in the HR diagram. Allowing for rotation (cooler TAMS), all stars are thus in the stage of core hydrogen burning. A timescale argument excludes all stars to be at a later evolutionary stage (looping back to the blue). In particular, because 75% of the program stars show a moderate or strong nitrogen enhancement, this enrichment needs to occur during the main sequence phase and cannot be delayed to post-main sequence phases. As discussed above, models with rotation indeed predict nitrogen enrichment during the main sequence phase.
Stellar ages have been determined by interpolating between isochrones (Fig. 12) and are listed in Table 5. Seven of the program stars are members of NGC 346, the largest H II region in the SMC. Our age estimates are consistent with Bouret et al.’s (2003) and show a spread between 1 and 8 Myr. We note that this spread is increased by our lower effective temperatures (using Vacca et al.’s scale, the age of MPG 355 would not change while the age of the later O stars would be smaller). Bouret et al. concluded that NGC 346 is about 3 Myr old. They interpreted the position of MPG 355 close to the ZAMS as resulting from homogeneous evolution due to rotation close to break-up velocity (Maeder, 1987). They argued following Walborn et al. (2000) that the old MPG 12 is not a coeval member of NGC 346, and attributed the larger age of MPG 487 to possible binarity (i.e., the star appears too luminous in the HR diagram). To their study, we only add one more star, MPG 682, which however also turn to be relatively old (about 7 Myr). In NGC 346, we now have a very young star, 3 stars with ages clustered around 3 Myr, and 3 “old” stars (6 to 8 Myr), in a sequence of decreasing masses. We may uphold Bouret et al.’s conclusion, and MPG 682 would also need not be coeval. This trend, however, suggests an alternate scenario, that is that the most massive stars of the cluster formed last, and once having formed, they put a halt to further star formation.
AV 327 is the only star exhibiting a hint of carbon deficiency, and may thus be viewed as the ”most evolved” star of our sample. AV 327 is about 6 Myr old. We derive slightly greater ages only for three other stars (AV 170, MPG 12, and MPG 682), but they are significantly less massive ( compared to for AV 327). As discussed in §6.5, all other stars show their original carbon, oxygen, and helium composition. As pointed out by Maeder & Meynet (2001), models with rotation naturally explain N-rich stars with normal helium. A similar conclusion holds for carbon and oxygen. Indeed, small differences between the predicted N/C and N/O ratios at the end of hydrogen burning indicate that the C and O depletion remains limited in this phase. During the main sequence phase, the primary change in surface composition of rapidly-rotating stars is nitrogen enhacement. Strong carbon and oxygen depletion only occurs at later phases (helium burning) similarly to the non-rotating case. The model predictions, therefore, agree with our findings.
7 Conclusions
We have presented a comprehensive analysis of the far-UV and optical, high-resolution spectrum of 17 O stars in the SMC based on TLUSTY NLTE metal line blanketed model atmospheres. We have determined the basic stellar parameters, effective temperatures, surface gravities, stellar radii, masses, luminosities, and ages, while consistently deriving the surface chemical compositions. Wind properties have been discussed in two companion papers for the first half of the sample (Hillier et al., 2003; Bouret et al., 2003), or will be presented in a future paper (Koesterke et al., in prep.). We summarize the main findings of our analysis.
Supporting the conclusion of several recent studies of a limited number of Galactic and Magellanic Clouds O stars, we find that the effective temperature scale of O stars needs to be revised downward relative to Vacca et al. (1996) calibration. Our temperatures are 15 to 20% cooler for O4-O5 stars, but the difference decreases to about 10% for mid to late O stars. Our analysis benefits from using various spectral diagnoses from the optical and the far-UV spectrum. Moreover, as demonstrated by Bouret et al. (2003), excellent agreement in effective temperatures derived from TLUSTY and CMFGEN models is achieved. Our new temperatures therefore form a sound basis for a new -spectral type calibration of low metallicity O stars.
Apart from a few exceptions, we also find a good agreement between determinations based on TLUSTY, CMFGEN, and FASTWIND models for stars of same spectral subtype, though the scatter may typically be as large as K. On the other hand, temperatures derived from UV metal lines with WM-basic (Bianchi & Garcia, 2002) are systematically cooler by 2000 to 6000 K compared to all other recent studies. Given the differences between models, analysis methodology, and the scatter at given spectral types between current results, we believe that a reliable quantitative estimate of the effect of metallicity on the effective temperature calibration still requires additional work. In particular, we have started a similar analysis of a large sample of Galactic stars with TLUSTY and CMFGEN. This study as well as Massey et al.’s analysis of their complete sample currently under way will form appropriate bases for comparison with the results presented in this paper.
As a consequence of lower effective temperatures, we derive lower ionizing luminosities (typically by a factor of 3), implying a significant downward revision of previous relations of ionizing luminosities with spectral type. We provide a new calibration of the ionizing luminosities of O stars, which is only weakly dependent on metallicity.
The surface composition of these 17 O stars is the second main result of our study. We found that a large fraction of the stars (about 75% of our sample) show surface nitrogen enrichment during their lifetime on the main sequence. Furthermore, there is no enrichment in helium and no depletion in carbon or oxygen. These results support Maeder & Meynet (2001) predictions of stellar evolution models accounting for rotationally-induced mixing. We find, however, N/C enrichment factors of 10 to 40 that are significantly larger than the theoretical predictions of factors of 5 to 10.
Additionally, we derive for all stars (but one) a present metallicity of one fifth the solar value, in good agreement with other recent studies. In the few cases where nitrogen surface abundance has not yet been affected by mixing, we also obtain CNO abundances consistent with earlier nebular studies. Finally, our analysis of UV metal lines indicate that NLTE metal line blanketed model atmospheres still require a significant microturbulence to match the strength of the observed UV lines. The required microturbulent velocity might decrease from early to late O stars. We stress that CMFGEN wind models also require similar microturbulent velocities, which thus are not a spurious result from static model atmospheres.
Finally, we find that most stars in our sample show the so-called “mass discrepancy” between spectroscopic and evolutionary mass estimates. Along with nitrogen enrichment, we interpret that discrepancy as a result of rapid rotation that lower the measured effective gravities. Therefore, most stars in our sample are fast rotators with km s-1, and the low measured thus imply that most stars are viewed almost pole-on.
To conclude, our results emphasize the importance of rotation in our understanding of the properties of massive stars as worked out by Heger & Langer (2000) and Maeder & Meynet (2000, 2001). They also provide a framework for understanding populations of massive stars in low metallicity environments at low and high redshifts.
References
- Bianchi & Garcia (2002) Bianchi, L., & Garcia, M. 2002, ApJ, 581, 610
- Bouret et al. (2003) Bouret, J.-C., Lanz, T., Hillier, D. J., Heap, S. R., Hubeny, I., Lennon, D. J., Smith, L. J., & Evans, C. J. 2003, ApJ, 595, 1182
- Charbonnel et al. (1993) Charbonnel, C., Meynet, G., Maeder, A., Schaller, G., & Schaerer, D. 1993, A&AS, 101, 415
- Cioni et al. (2000) Cioni, M.-R. L., van der Marel, M. P., Loup, C., & Habing, H. J. 2000, A&A, 359, 601
- Conti & Alschuler (1971) Conti, P. S., & Alschuler, W. R. 1971, ApJ, 170, 325
- Crowther et al. (2002) Crowther, P. A., Hillier, D. J., Evans, C. J., Fullerton, A. W., De Marco, O., & Willis, A. J. 2002, ApJ, 579, 774
- Garnett et al. (1995) Garnett, D. R., Skillman, E. D., Dufour, R. J., Peimbert, M., Torres-Peimbert, S., Terlevich, E., & Shields, G. A. 1995, ApJ, 443, 64
- Grevesse & Sauval (1998) Grevesse, N., & Sauval, A. 1998, Space Sci. Rev., 85, 161
- Groenewegen (2000) Groenewegen, M. A. T. 2000, A&A, 363, 901
- Harries et al. (2003) Harries, T. J., Hilditch, R. W., & Howarth, I. D. 2003, MNRAS, 339, 157
- Haser et al. (1998) Haser, S. M., Pauldrach, A. W. A., Lennon, D. J., Kudritzki, R. P., Lennon, M., Puls, J., & Voels, S. A. 1998, A&A, 330, 285
- Heap (1977) Heap, S. R. 1977, ApJ, 215, 609
- Heap & Lanz (2002) Heap, S. R., & Lanz, T. 2002, AAS, 34, 652
- Heap & Lanz (2004) Heap, S. R., & Lanz, T. 2004, to appear in Stellar Rotation, Proc. IAU Symp. 215, Eds. A. Maeder & P. Eenens, ASP Conf. Ser.
- Heger & Langer (2000) Heger, A., & Langer, N. 2000, ApJ, 544, 1016
- Herrero et al. (1992) Herrero, A., Kudritzki, R. P., Vilchez, J. M., Kunze, D., Butler, K., & Haser, S. 1992, A&A, 261, 209
- Herrero et al. (2002) Herrero, A., Puls, J., & Najarro, F. 2002, A&A, 396, 949
- Hillier (2003) Hillier, J. D. 2003, in Stellar Atmospheres Modeling, Eds. I. Hubeny et al., ASP Conf. Ser., 288, 199
- Hillier & Lanz (2001) Hillier, D. J., & Lanz, T. 2001, in Spectroscopic Challenges of Photoionized Plasmas, Eds. G. Ferland & D. W. Savin, ASP Conf. Ser., 247, 343
- Hillier & Miller (1998) Hillier, D. J., & Miller, D. L. 1998, ApJ, 496, 407
- Hillier et al. (2003) Hillier, D. J., Lanz, T., Heap, S. R., Hubeny, I., Smith, L. J., Evans, C. J., Lennon, D. J., & Bouret, J.-C. 2003, ApJ, 588, 1039
- Howarth & Prinja (1989) Howarth, I. D., & Prinja, R. K. 1989, ApJS, 69, 527
- Hubeny & Lanz (1995) Hubeny, I., & Lanz, T. 1995, ApJ, 439, 875
- Hubeny et al. (1998) Hubeny, I., Heap, S. R., & Lanz, T. 1998, in Boulder-Munich II: Properties of Hot, Luminous Stars, I. Howarth (ed), ASP Conf. Ser., 131, 108
- Kovács (2000) Kovács, G. 2000, A&A, 360, L1
- Kudritzki (1992) Kudritzki, R. P. 1992, A&A, 266, 395
- Kudritzki et al. (1989) Kudritzki, R. P., Cabanne, M. L., Husfeld, D., Niemela, V. S., Groth, H. G., Puls, J., & Herrero, A. 1989, A&A, 226, 235
- Kurt et al. (1999) Kurt, C. M., et al. 1999, ApJ, 518, 246
- Lanz et al. (1996) Lanz, T., de Koter, A., Hubeny, I., & Heap, S. R. 1996, ApJ, 465, 359
- Lanz & Hubeny (2003) Lanz, T., & Hubeny, I. 2003, ApJS, 146, 417
- Leitherer et al. (1999) Leitherer, C. et al. 1999, ApJS, 123, 3
- Maeder (1987) Maeder, A. 1987, A&A, 178, 159
- Maeder & Meynet (2000) Maeder, A., & Meynet, G. 2000, ARA&A, 38, 143
- Maeder & Meynet (2001) Maeder, A., & Meynet, G. 2001, A&A, 373, 555
- Maíz-Apellániz et al. (2004) Maíz-Apellániz, J., Walborn, N. R., Galué, H. A., & Wei, L. H. 2004, ApJS, 151, 103
- Martins et al. (2002) Martins, F., Schaerer, D., & Hillier, D. J. 2002, A&A, 382, 999
- Massey et al. (1989) Massey, P., Parker, J. W., & Garmany, C. D. 1989, AJ, 98, 1035
- Massey et al. (2004) Massey, P., Bresolin, F., Kudritzki, R. P., Puls, J., & Pauldrach, A. W. A. 2004, ApJ, 608, 1001
- Mihalas (1978) Mihalas, D. 1978, Stellar Atmospheres, 2nd Ed., (San Francisco: Freeman)
- Moos et al. (2000) Moos, H. W., Cash, W. C., Cowie, L. L., et al., 2000, ApJ, 538, L1
- Pauldrach et al. (2001) Pauldrach, A. W. A., Hoffmann, T. L., & Lennon, M. 2001, A&A, 375, 161
- Petrie (1947) Petrie, R. M. 1947, PASP, 59, 177
- Repolust et al. (2004) Repolust, T., Puls, J., & Herrero, A. 2004, A&A, 415, 349
- Rolleston et al. (1993) Rolleston, W. R. J., Dufton, P. L., Fitzsimmons, A., Howarth, I. D., Irwin, M. J. 1993, A&A, 277, 10
- Sahnow et al. (2000) Sahnow, D. J., Moos, H. W., Ake, T. B., et al., 2000, ApJ, 538, L7
- Santolaya-Rey et al. (1997) Santolaya-Rey, A. E., Puls, J., & Herrero, A. 1997, A&A, 323, 488
- Schmidt-Kaler (1982) Schmidt-Kaler, T. 1982, in Landolt-Börnstein, New Series, Group VI, Vol. 2b, K. Schaifers & H. H. Voigt (eds), (Berlin: Springer Verlag), 451
- Spite et al. (1989) Spite, F., Spite, M., & François, P. 1989, A&A, 210, 25
- Struve (1932) Struve, O. 1932, Pub. Natl. Acad. Sciences, 18, 585
- Trundle et al. (2004) Trundle, C., Lennon, D. J., Puls, J., & Dufton, P. L. 2004, A&A, 417, 217
- Vacca et al. (1996) Vacca, W. D., Garmany, C. D., & Shull, J. M. 1996, ApJ, 460, 914
- Venn (1999) Venn, K. A. 1999, ApJ, 518, 405
- Walborn (1971) Walborn, N. R. 1971, ApJS, 23, 257
- Walborn (1972) Walborn, N. R. 1972, AJ, 77, 312
- Walborn (1976) Walborn, N. R. 1976, ApJ, 205, 419
- Walborn & Panek (1984) Walborn, N. R., & Panek, R. J. 1984, ApJ, 280, L27
- Walborn et al. (2000) Walborn, N. R., Lennon, D. J., Heap, S. R., Lindler, D. J., Smith, L. J., Evans, C. J., & Parker, J. W. 2000, PASP, 112, 1243
- Walborn et al. (2002) Walborn, N. R., Howarth, I. D., Lennon, D. J., Massey, P., Oey, M. S., Moffat, A. F. J., Skalkowski, G., Morrell, N. I., Drissen, L., & Parker, J. W. 2002, AJ, 123, 2754
- Walborn et al. (2004) Walborn, N. R., Morrell, N. I., Howarth, I. D., Crowther, P. A., Lennon, D. J., Massey, P., & Arias, J. I. 2004, ApJ, 608, 1028
| ID | Spectral Type | Optical | UV | Far-UV |
|---|---|---|---|---|
| NGC 346 MPG 355 | ON2 III(f∗) | AAT | STIS | aaComposite of many stars in NGC 346 |
| NGC 346 MPG 324 | O4 V((f)) | AAT | STIS | aaComposite of many stars in NGC 346 |
| NGC 346 MPG 368 | O4-5 V((f)) | AAT | STIS | |
| NGC 346 MPG 113 | OC6 Vz | ESO | STIS | |
| NGC 346 MPG 487 | O8 V | AAT | STIS | |
| NGC 346 MPG 682 | O9-O9.5 V | ESO | bbTarget acquisition failed; wrong target | |
| NGC 346 MPG 12 | O9.5-B0 V (N str) | ESO | STIS | FUSE |
| AV 80 | O4-6n(f)p | AAT | STIS | |
| AV 75 | O5 III(f+) | ESO | STIS | FUSE |
| AV 15 | O6.5 II(f) | ESO | STIS | FUSE |
| AV 95 | O7 III((f)) | ESO | STIS | FUSE |
| AV 69 | OC7.5 III((f)) | AAT | STIS | FUSE |
| AV 47 | O8 III((f)) | ESO | STIS | FUSE |
| AV 170 | O9.7 III | AAT | STIS | FUSE |
| AV 220 | O6.5 f?p | ESO | STIS | FUSE |
| AV 83 | O7 Iaf+ | ESO | STIS | FUSE |
| AV 327 | O9.5 II-Ibw | ESO | STIS | FUSE |
| Line ID | T sensitive at: | SI |
|---|---|---|
| C III 1176 | 32.5 – 50.0 kK | STIS, FUSE |
| C III 1247 | 32.5 – 47.5 kK | STIS |
| C IV 1169 | peak strength at 41 kK | STIS, FUSE |
| C IV 1549 | saturated | STIS |
| N III 980 | 35.0 – 50.0 kK | FUSE |
| N III 1184 | 37.5 – 45.0 kK | STIS, FUSE |
| N IV 1718 | blend with Fe IV | STIS |
| N V 1240 | saturated / shocks | STIS |
| O III 1150 | 37.5 – 50.0 kK | FUSE |
| O IV 1340 | 32.5 – 40.0 kK | STIS |
| O V 1371 | 37.5 kK | STIS |
| O VI 1036 | saturated / shocks | FUSE |
| Si III 1298 | 35 kK | STIS |
| Si IV 1126 | 32.5 – 50.0 kK | FUSE |
| Si IV 1398 | 35.0 – 50.0 kK | STIS |
| S IV 1073 | 35.0 – 45.0 kK | FUSE |
| S IV 1100 | 37.5 – 42.5 kK | FUSE |
| S V 1502 | peak strength at 41 kK | STIS |
| Fe IV 1610 | 37.5 – 45.0 kK | STIS |
| Fe V 1375 | 35.0 vs. 35.0 kK | STIS |
| Fe VI 1270 | 45 kK | STIS |
| Element | SMC | SunaaGrevesse & Sauval (1998) | Models | ||||||
|---|---|---|---|---|---|---|---|---|---|
| H II regionsbbGarnett et al. (1995), Kurt et al. (1999) | B starsccRolleston et al. (1993) | A starsddVenn (1999) | S | NEB | N5X | ||||
| [C] | 7.45 | 7.4 | 8.52 | 7.82 | 7.45 | 7.82 | |||
| [N] | 6.45 | 6.7 | 7.33 | 7.92 | 7.22 | 6.45 | 7.92 | ||
| [O] | 8.10 | 8.1 | 8.14 | 8.82 | 8.12 | 8.10 | 8.12 | ||
| [Si] | 6.97 | 7.55 | 6.85 | 6.97 | 6.85 | ||||
| [Fe] | 6.70 | 7.50 | 6.80 | 6.70 | 6.80 |
| ID | Spectral Type | C/HaaAbundances and metallicities are relative to the solar values. | N/HaaAbundances and metallicities are relative to the solar values. | N/CbbThe N/C abundance ratio is relative to the SMC nebular N/C abundance ratio. | M/HaaAbundances and metallicities are relative to the solar values. | ||||
|---|---|---|---|---|---|---|---|---|---|
| [K] | [km s-1] | [km s-1] | |||||||
| AV 83 | O7 Iaf+ | 35000 | 3.25 | 20 | 80 | 0.08 | 1.0 | 30 | 0.2 |
| AV 327 | O9.5 II-Ibw | 30000 | 3.25 | 15 | 60 | 0.04 | 0.2 | 12 | 0.2 |
| AV 80 | O4-6n(f)p | 38000 | 3.5 | 20 | 325 | 0.08 | ccN-rich, but the high value makes a quantitative estimate uncertain. | 1 | 0.2 |
| AV 75 | O5 III(f+) | 38500 | 3.5 | 20 | 120 | 0.08 | 1.0 | 30 | 0.2 |
| AV 220 | O6.5 f?p | 37500 | 3.75 | 10 | 30 | 0.08 | 1.0 | 30 | 0.2 |
| AV 15 | O6.5 II(f) | 37000 | 3.5 | 20 | 100 | 0.08 | 1.0 | 30 | 0.2 |
| AV 95 | O7 III((f)) | 35000 | 3.4 | 20 | 80 | 0.08 | 0.5 | 15 | 0.2 |
| AV 69 | OC7.5 III((f)) | 35000 | 3.4 | 15 | 70 | 0.1 | 0.06 | 2 | 0.2 |
| AV 47 | O8 III((f)) | 35000 | 3.75 | 10 | 60 | 0.08 | 0.2 | 6 | 0.2 |
| AV 170 | O9.7 III | 30000 | 3.5 | 5 | 40 | 0.08 | 1.0 | 30 | 0.2 |
| NGC 346 MPG 355 | ON2 III(f∗) | 52500 | 4.0 | 25 | 110 | 0.08 | 1.0 | 30 | 0.2 |
| NGC 346 MPG 324 | O4 V((f)) | 41500 | 4.0 | 15 | 70 | 0.06 | 0.2 | 8 | 0.2 |
| NGC 346 MPG 368 | O4-5 V((f)) | 40000 | 3.75 | 15 | 60 | 0.06 | 0.6 | 25 | 0.2 |
| NGC 346 MPG 113 | OC6 Vz | 40000 | 4.0 | 10 | 35 | 0.08 | 0.03 | 1 | 0.2 |
| NGC 346 MPG 487 | O8 V | 35000 | 4.0 | 2 | 20 | 0.1 | 0.03 | 1 | 0.1 |
| NGC 346 MPG 682 | O9-O9.5 V | 32500 | 3.75 | 10 | 80 | 0.08 | 0.03 | 1 | 0.2 |
| NGC 346 MPG 12 | O9.5-B0 V (N str) | 31000 | 3.6 | 5 | 60 | 0.06 | 1.0 | 40 | 0.2 |
| ID | Spectral Type | Age | |||||||
|---|---|---|---|---|---|---|---|---|---|
| [K] | [] | [] | [] | [] | [Myr] | ||||
| AV 83 | O7 Iaf+ | 35000 | 3.25 | 17 | 5.6 | 20.8 | 18 | 39 | 4.5 |
| AV 327 | O9.5 II-Ibw | 30000 | 3.25 | 19 | 5.4 | 11.2 | 22 | 35 | 6 |
| AV 80 | O4-6n(f)p | 38000 | 3.5 | 18 | 5.8 | 16.3 | 35 | 51 | 3 |
| AV 75 | O5 III(f+) | 38500 | 3.5 | 22 | 6.0 | 17.1 | 54 | 65 | 3 |
| AV 220 | O6.5 f?p | 37500 | 3.75 | 9 | 5.2 | 8.7 | 17 | 30 | 4 |
| AV 15 | O6.5 II(f) | 37000 | 3.5 | 17 | 5.7 | 14.6 | 33 | 46 | 3.5 |
| AV 95 | O7 III((f)) | 35000 | 3.4 | 12 | 5.3 | 14.7 | 13 | 30 | 5 |
| AV 69 | OC7.5 III((f)) | 35000 | 3.4 | 16 | 5.5 | 14.7 | 24 | 38 | 4.5 |
| AV 47 | O8 III((f)) | 35000 | 3.75 | 15 | 5.5 | 6.6 | 46 | 39 | 4.5 |
| AV 170 | O9.7 III | 30000 | 3.5 | 13 | 5.1 | 6.3 | 19 | 22 | 7.5 |
| NGC 346 MPG 355 | ON2 III(f∗) | 52500 | 4.0 | 12 | 6.0 | 18.7 | 55 | 85 | |
| NGC 346 MPG 324 | O4 V((f)) | 41500 | 4.0 | 11 | 5.5 | 7.3 | 41 | 40 | 3 |
| NGC 346 MPG 368 | O4-5 V((f)) | 40000 | 3.75 | 10 | 5.4 | 11.2 | 21 | 36 | 3 |
| NGC 346 MPG 113 | OC6 Vz | 40000 | 4.0 | 7 | 5.1 | 6.3 | 20 | 30 | 2.5 |
| NGC 346 MPG 487 | O8 V | 35000 | 4.0 | 10 | 5.1 | 3.7 | 33 | 25 | 6 |
| NGC 346 MPG 682 | O9-O9.5 V | 32500 | 3.75 | 9 | 4.9 | 4.9 | 18 | 21 | 7 |
| NGC 346 MPG 12 | O9.5-B0 V (N str) | 31000 | 3.6 | 10 | 4.9 | 5.7 | 14 | 20 | 8 |
| Spectral Type | ||||||
|---|---|---|---|---|---|---|
| [K] | [] | [K] | [] | |||
| This paper | Vacca et al. (1996) | |||||
| Dwarfs | ||||||
| O4 V((f)) | 41500 | 5.48 | 40 | 48670 | 5.88 | 69 |
| O4-5 V((f)) | 40000 | 5.38 | 36 | 47400 | 5.81 | 62 |
| OC6 Vz | 40000 | 5.09 | 30 | 43560 | 5.57 | 45 |
| O8 V | 35000 | 5.09 | 25 | 38450 | 5.24 | 31 |
| O9-O9.5 V | 32500 | 4.94 | 21 | 35260 | 5.01 | 24 |
| O9.5-B0 V (N str) | 31000 | 4.89 | 20 | 33980 | 4.93 | 22 |
| Giants | ||||||
| ON2 III(f∗) | 52500 | 6.01 | 85 | 51000 | 6.15 | 100 |
| O5 III(f+) | 38500 | 5.97 | 65 | 45410 | 5.93 | 68 |
| O4-6n(f)p | 38000 | 5.76 | 51 | 45410 | 5.93 | 68 |
| O6.5 f?p | 37500 | 5.18 | 30 | 41250 | 5.76 | 52 |
| O6.5 II(f) | 37000 | 5.68 | 46 | 41250 | 5.76 | 52 |
| O7 III((f)) | 35000 | 5.27 | 30 | 39860 | 5.70 | 47 |
| O7 Iaf+ | 35000 | 5.57 | 39 | 38720 | 5.98 | 64 |
| OC7.5 III((f)) | 35000 | 5.54 | 38 | 38480 | 5.63 | 43 |
| O8 III((f)) | 35000 | 5.48 | 39 | 37090 | 5.57 | 39 |
| O9.5 II-Ibw | 30000 | 5.40 | 35 | 32085 | 5.55 | 37 |
| O9.7 III | 30000 | 5.07 | 22 | 32235 | 5.32 | 29 |
| Spectral Type | BC | BC | ||||
|---|---|---|---|---|---|---|
| [mag] | [s-1] | [s-1] | [mag] | [s-1] | [s-1] | |
| This paper | Vacca et al. (1996) | |||||
| Dwarfs | ||||||
| O4 V((f)) | -3.80 | 49.20 | 48.54 | -4.40 | 49.70 | 48.99 |
| O4-5 V((f)) | -3.71 | 49.10 | 48.41 | -4.32 | 49.61 | 48.90 |
| OC6 Vz | -3.69 | 48.78 | 48.08 | -4.06 | 49.34 | 48.61 |
| O8 V | -3.29 | 48.53 | 47.37 | -3.68 | 48.87 | 47.92 |
| O9-O9.5 V | -3.09 | 48.25 | 46.59 | -3.42 | 48.47 | 47.01 |
| O9.5-B0 V (N str) | -3.01 | 48.08 | 46.09 | -3.30 | 48.27 | 46.50 |
| Giants | ||||||
| ON2 III(f∗) | -4.57 | 49.86 | 49.42 | -4.55 | 49.99 | 49.30 |
| O5 III(f+) | -3.63 | 49.71 | 48.97 | -4.21 | 49.73 | 48.98 |
| O4-6n(f)p | -3.58 | 49.49 | 48.73 | -4.21 | 49.73 | 48.98 |
| O6.5 f?p | -3.51 | 48.82 | 48.02 | -3.92 | 49.50 | 48.63 |
| O6.5 II(f) | -3.50 | 49.40 | 48.61 | -3.92 | 49.50 | 48.63 |
| O7 III((f)) | -3.34 | 48.92 | 48.03 | -3.82 | 49.41 | 48.46 |
| O7 Iaf+ | -3.38 | 49.28 | 48.43 | -3.75 | 49.69 | 48.57 |
| OC7.5 III((f)) | -3.34 | 49.19 | 48.30 | -3.71 | 49.32 | 48.26 |
| O8 III((f)) | -3.32 | 49.01 | 47.97 | -3.60 | 49.22 | 48.01 |
| O9.5 II-Ibw | -2.89 | 48.75 | 46.85 | -3.18 | 48.98 | 47.07 |
| O9.7 III | -2.90 | 48.21 | 45.94 | -3.18 | 48.67 | 46.71 |


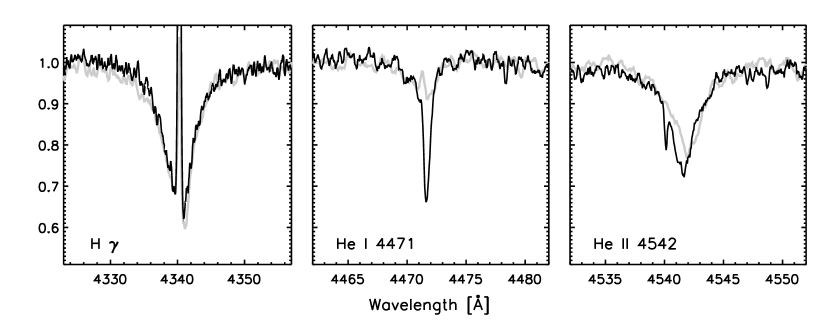
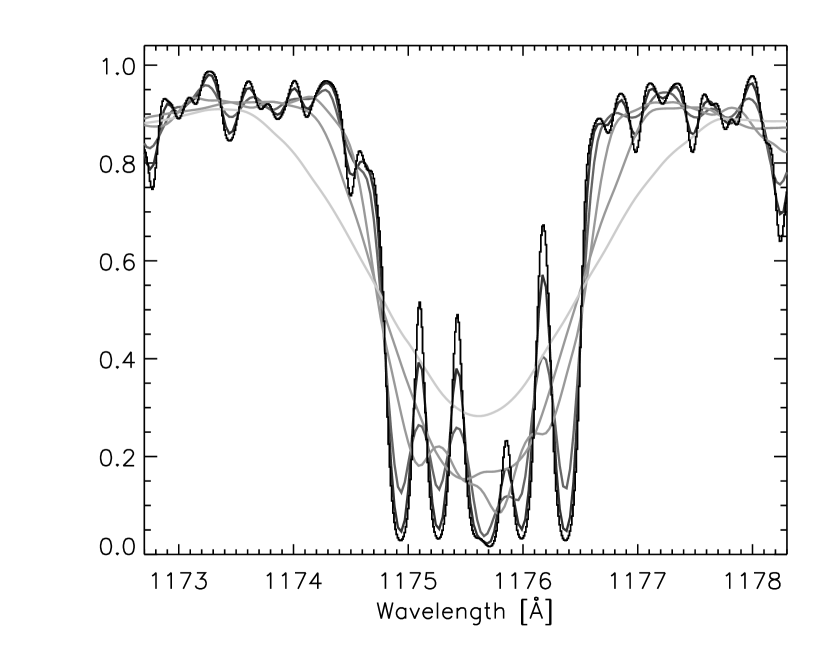

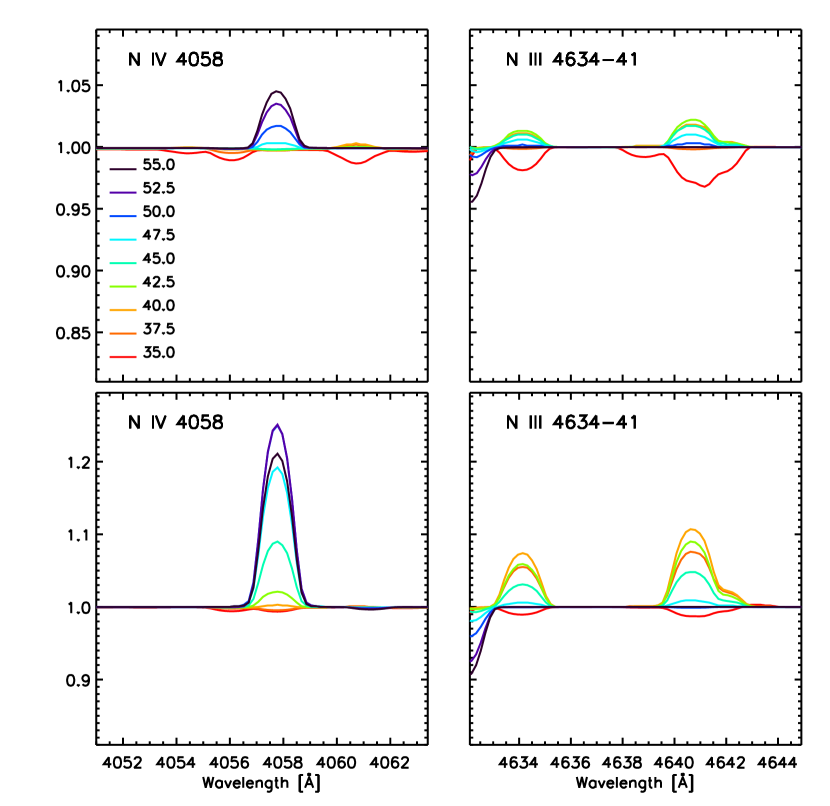

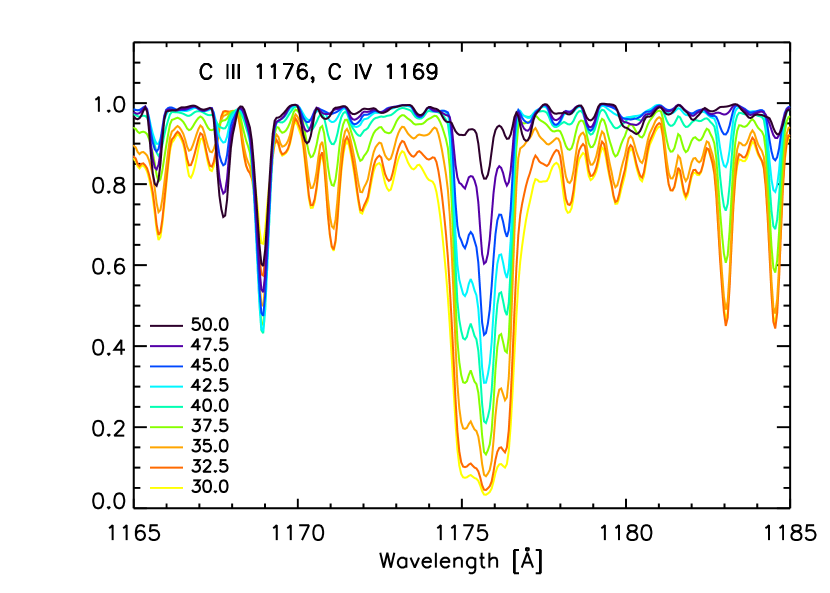
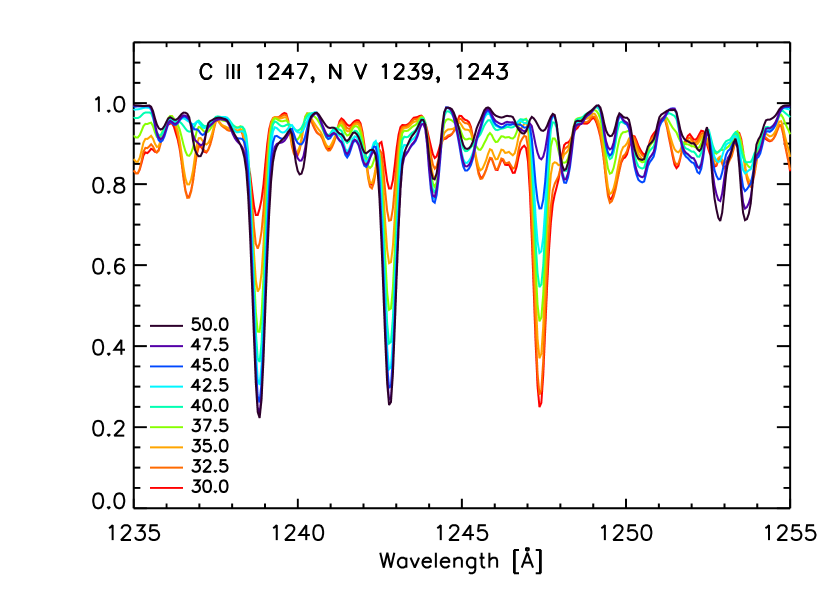
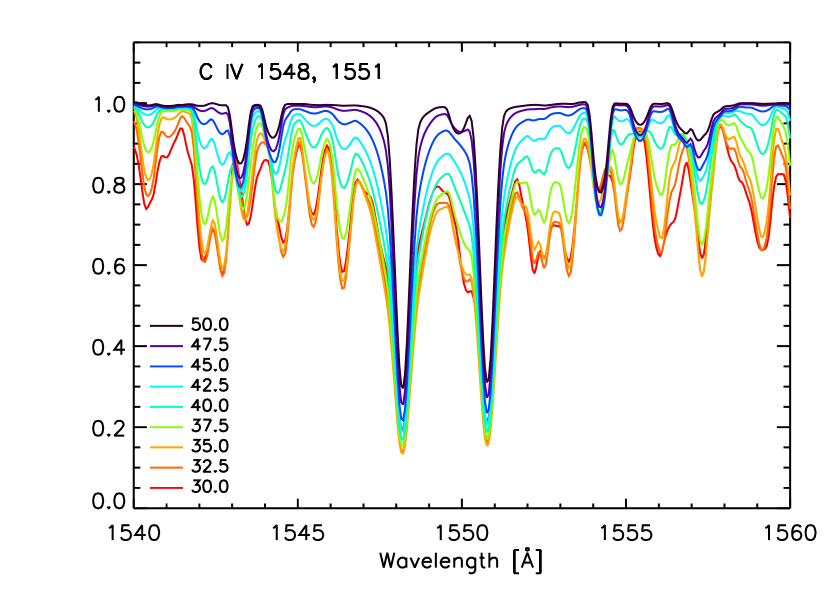
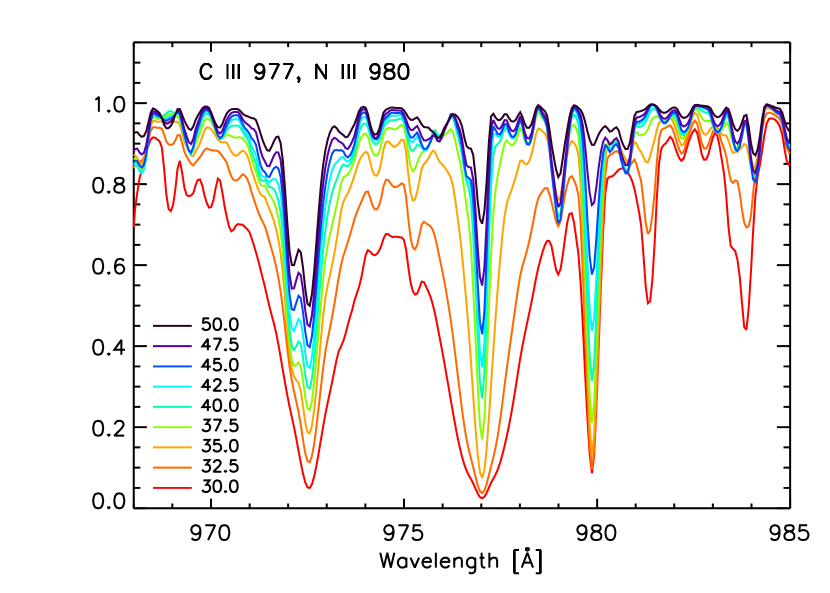
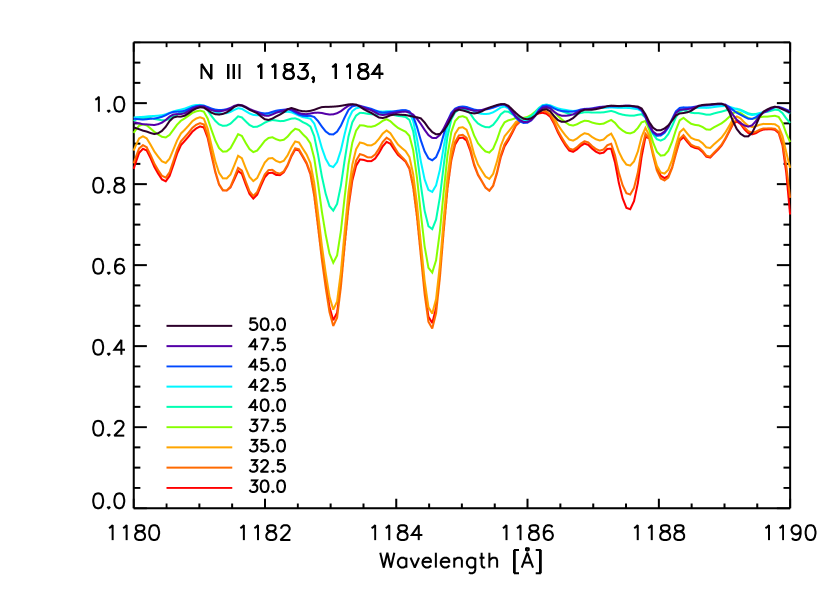
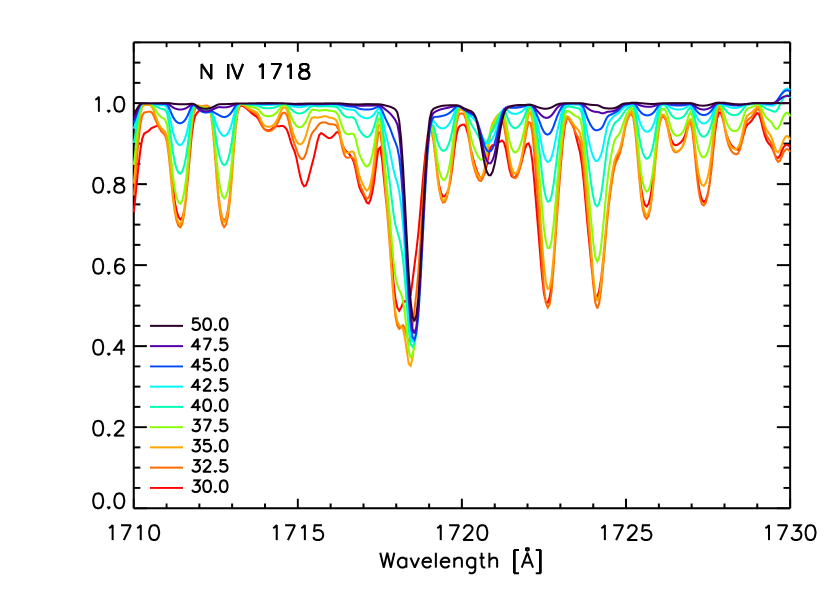
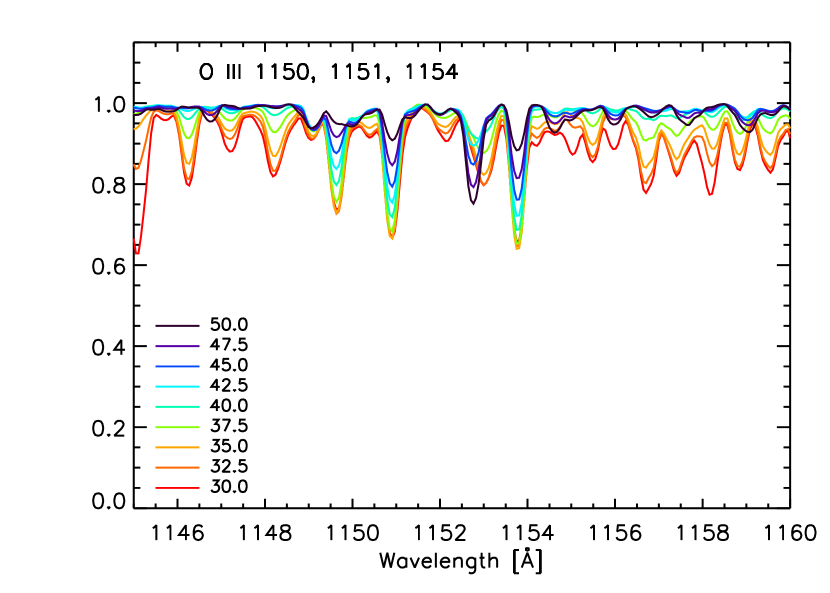
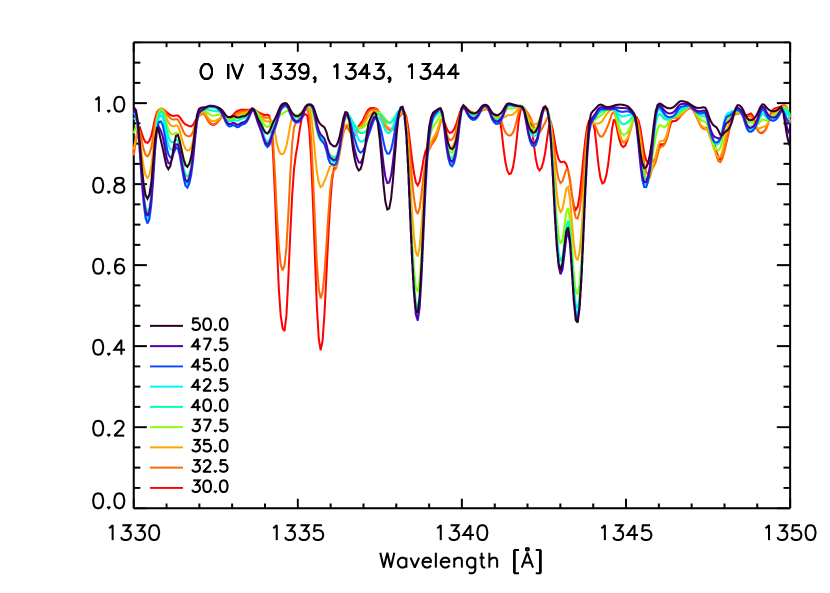
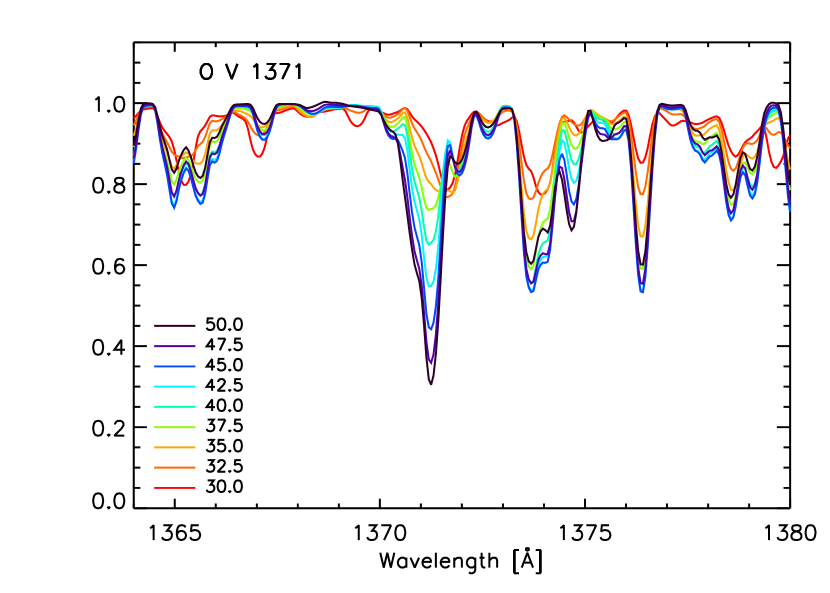
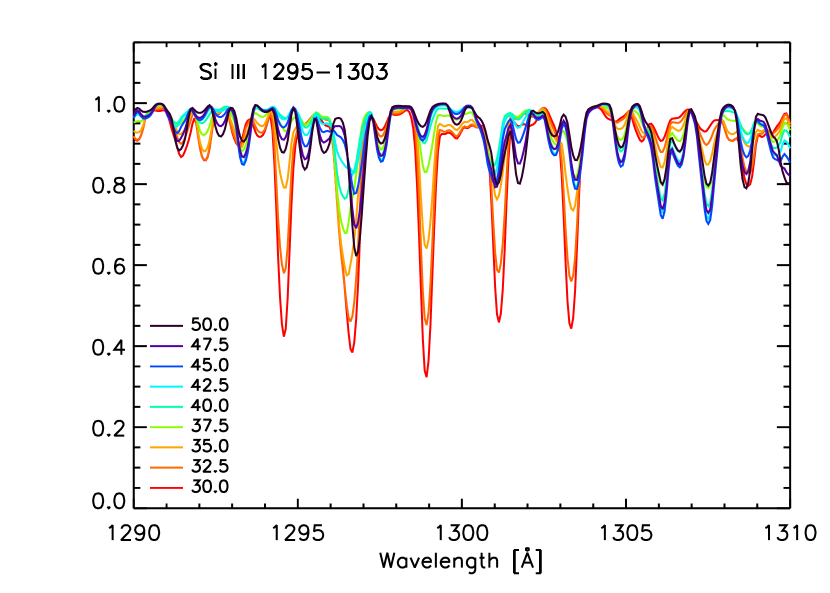
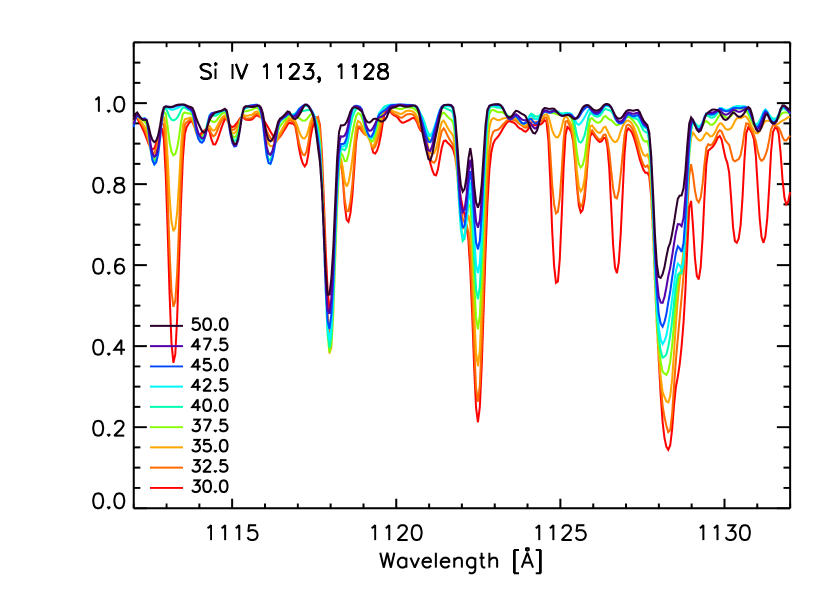
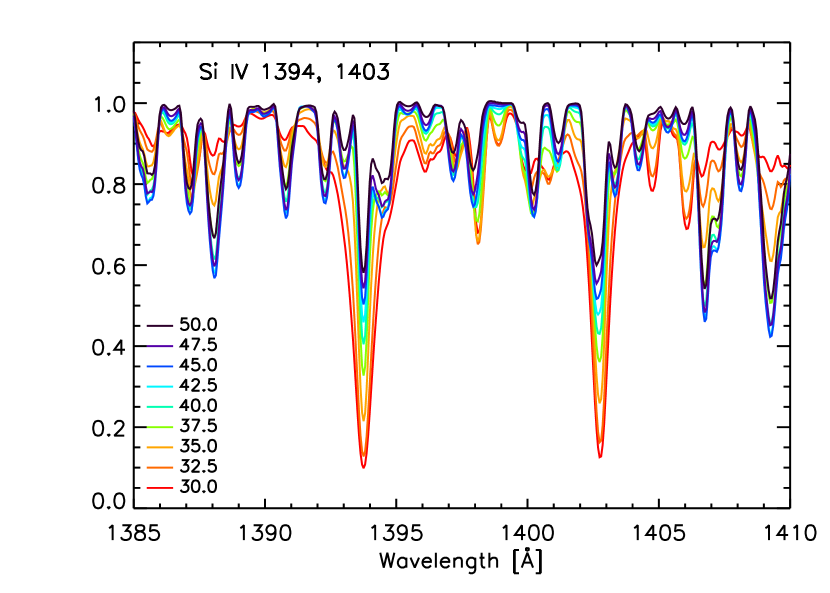
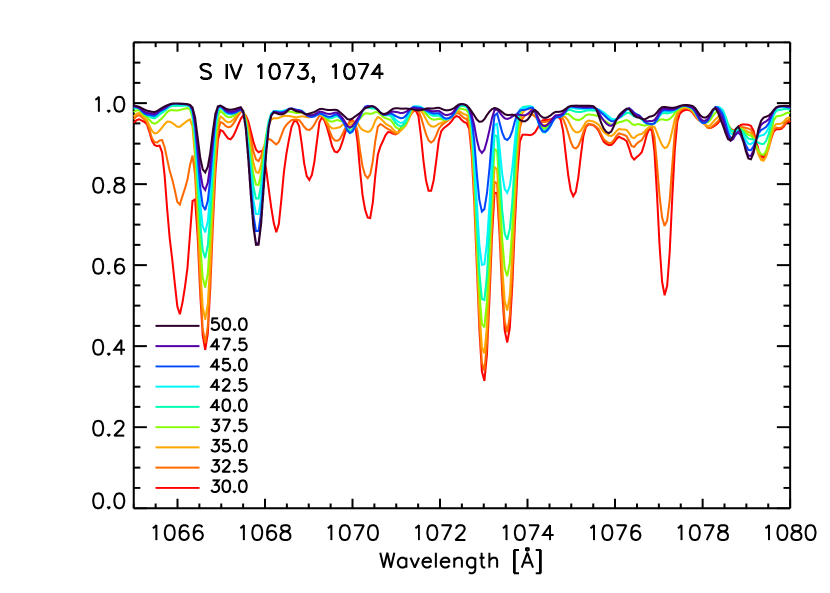
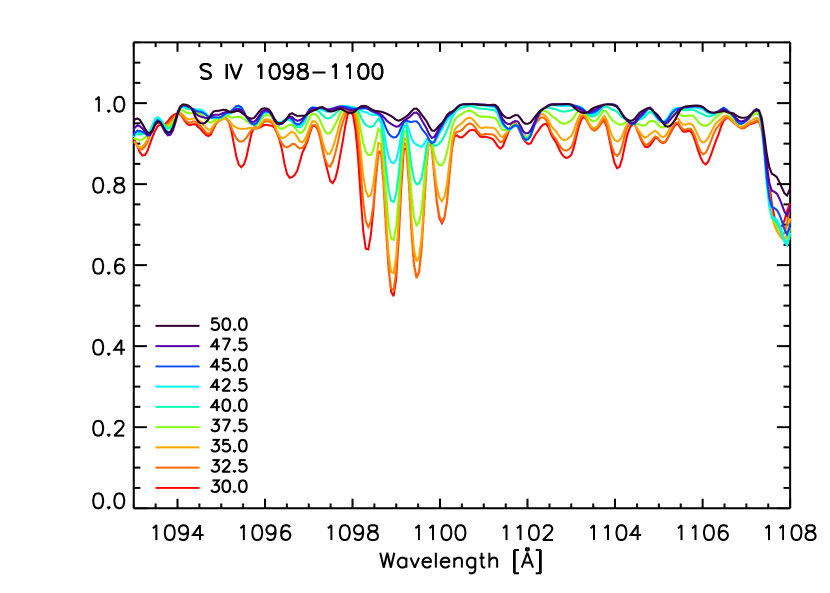
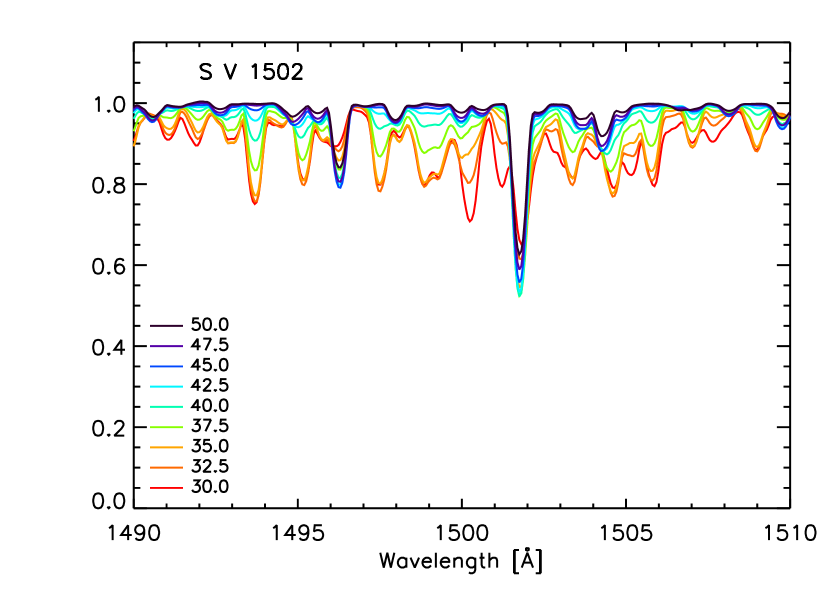
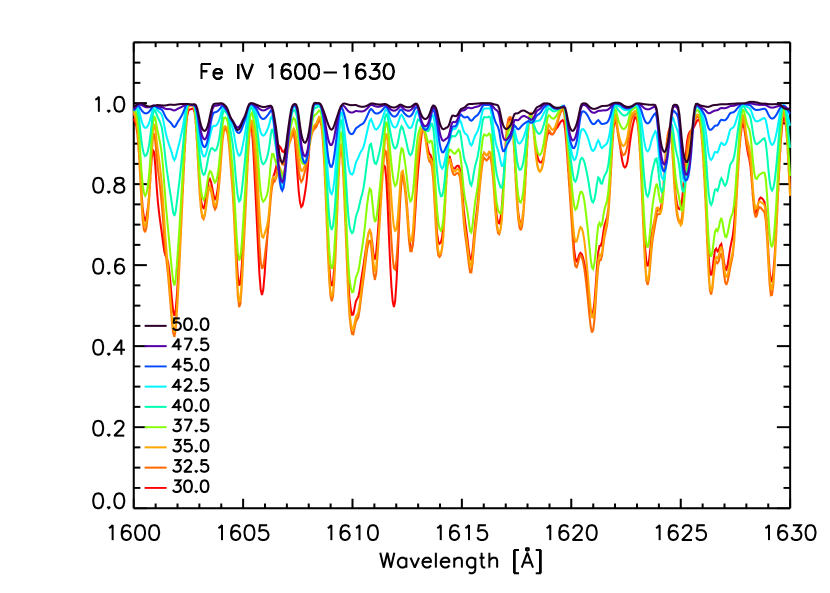
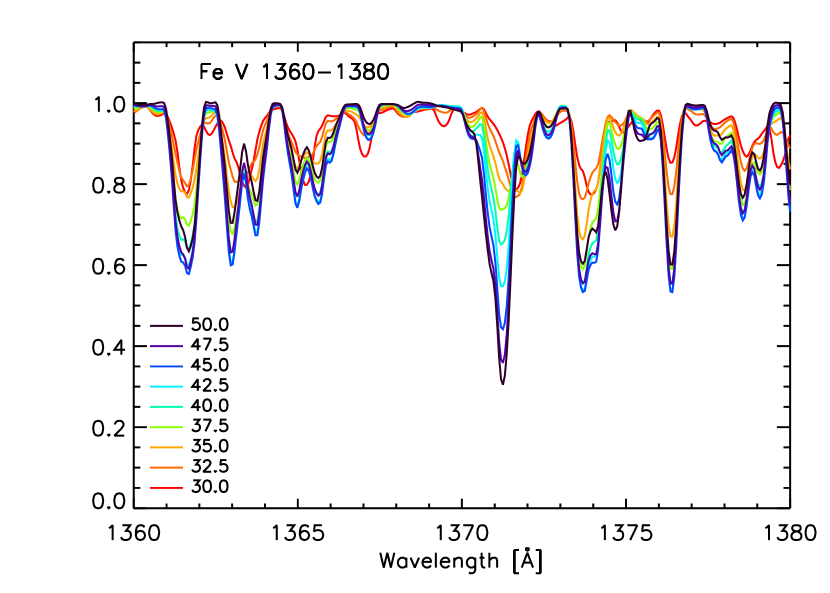
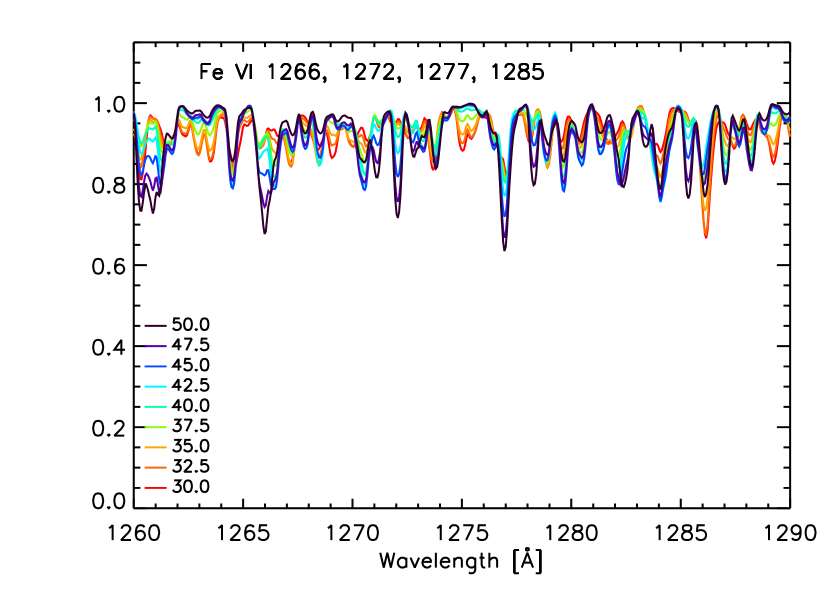
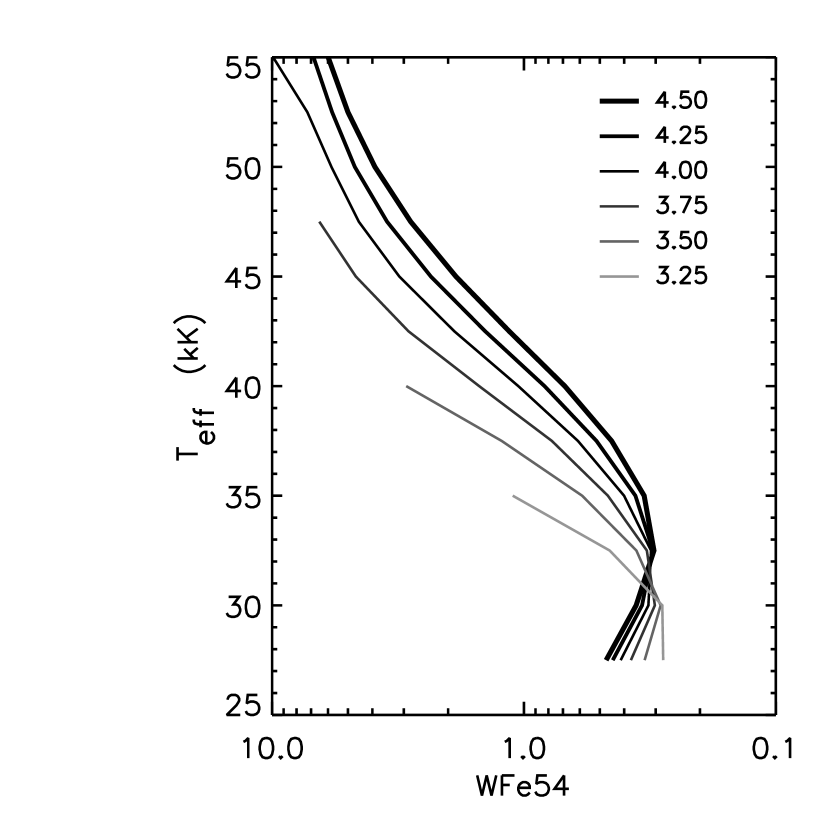


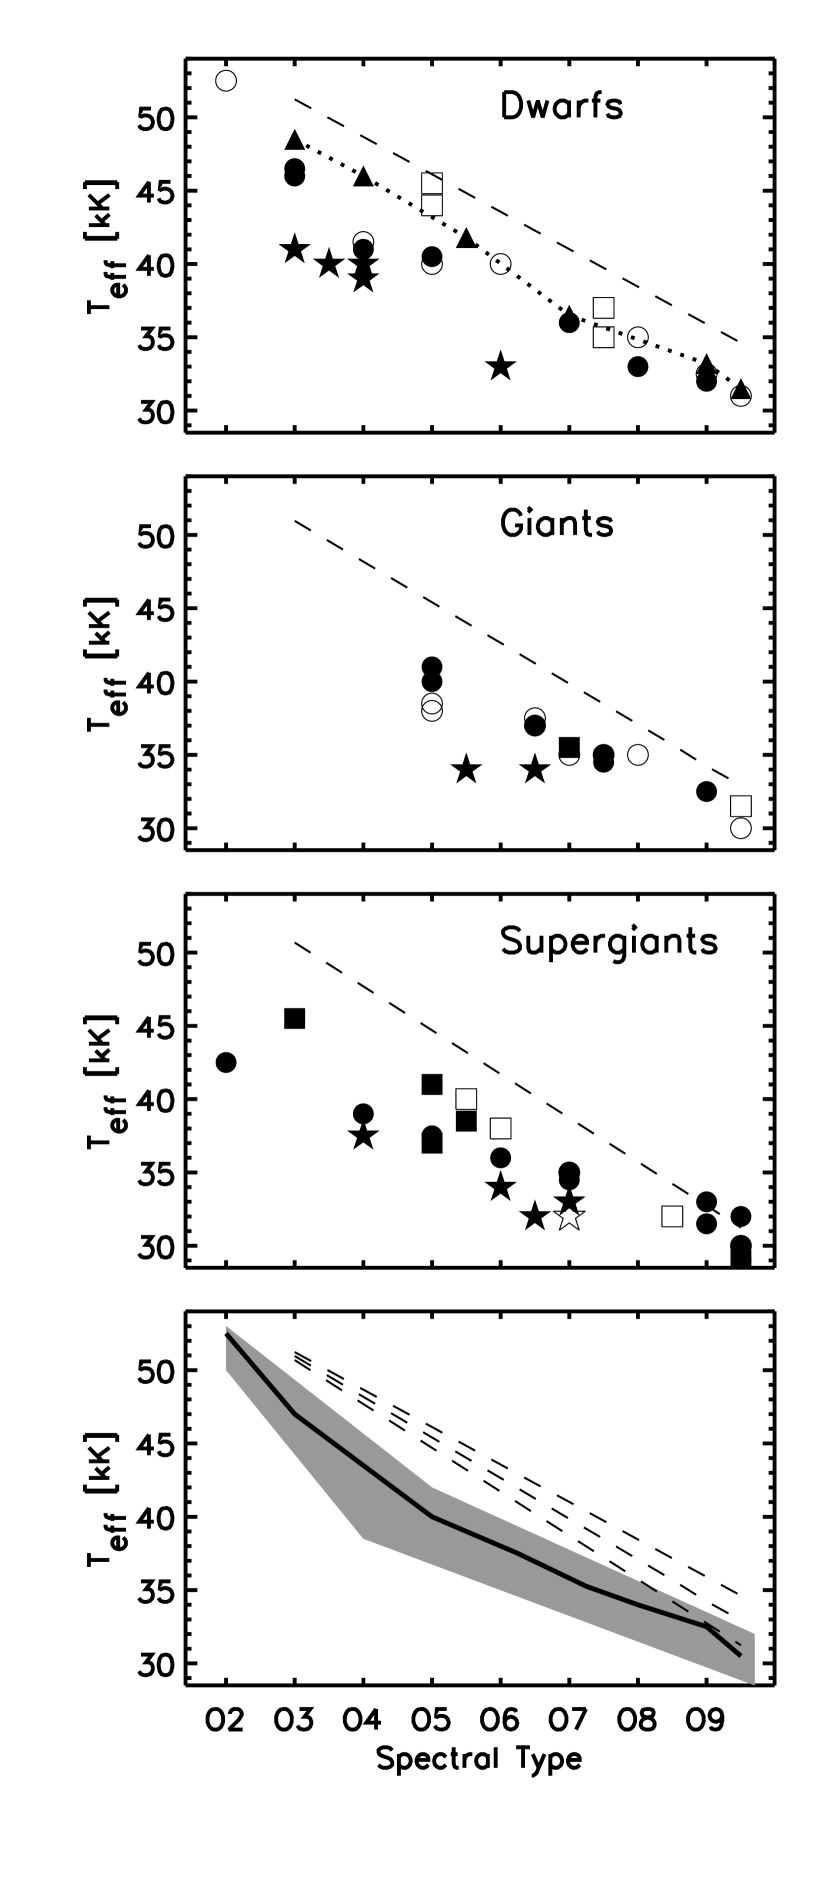

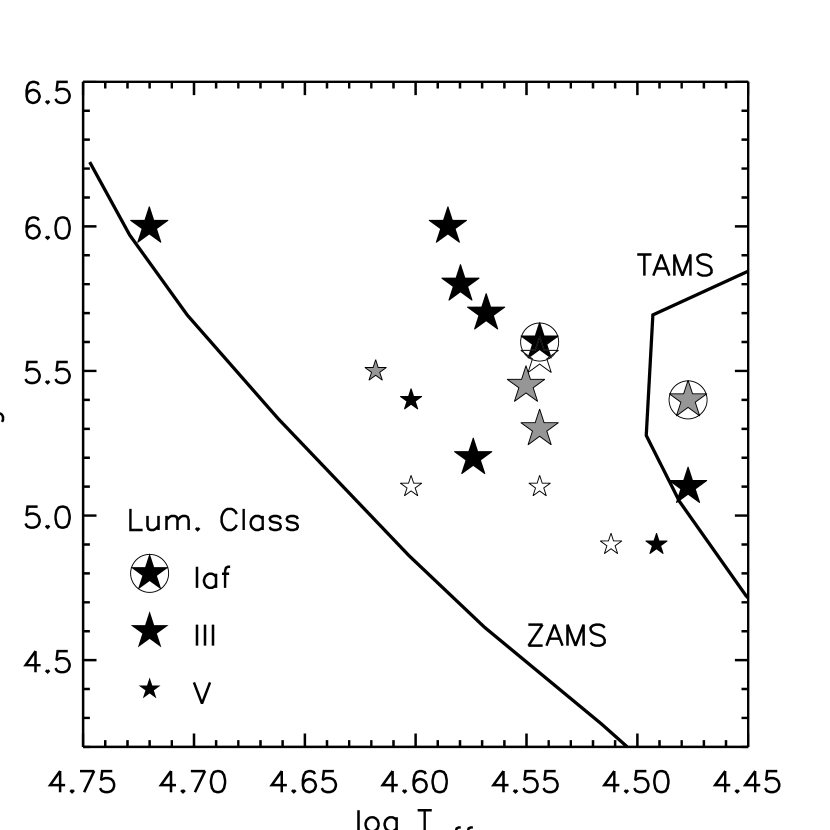
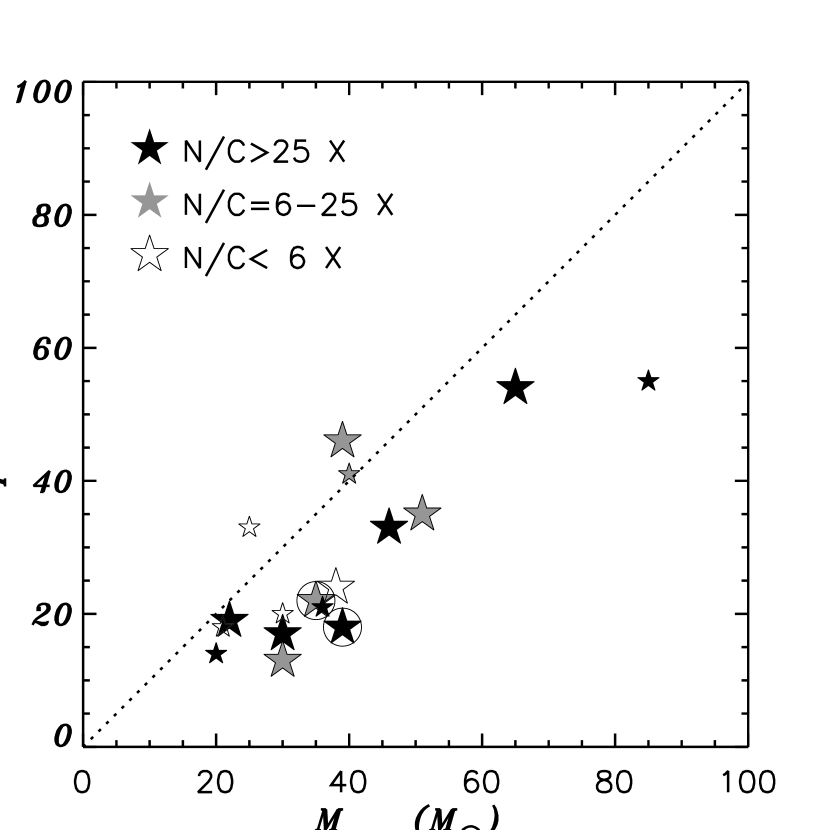
.