Fe L-Shell Density Diagnostics in Theory and Practice
Abstract
We provide a discussion of the density and photoexcitation sensitivity of the X-ray spectra of Fe L-shell ions (Fe XVII–Fe XXIV) calculated with the Livermore X-ray Spectral Synthesizer, a suite of IDL codes that calculates spectral models of highly charged ions based primarily on HULLAC atomic data. These models are applicable to collisionally ionized laboratory or cosmic plasmas with electron temperatures –45 MK (0.2–4 keV) and electron densities . Potentially useful density diagnostics are identified for Fe XVII and Fe XIX–Fe XXIII, with the most straightforward being the Fe XVII (17.10 Å)/(17.05 Å) line ratio and the Fe XXII (11.92 Å)/(11.77 Å) line ratio. Applying these models to the Chandra X-ray Observatory High Energy Transmission Grating spectrum of the intermediate polar EX Hya, we find that the strength of all the Fe L-shell lines are consistent with electron densities . Specifically, from the observed Fe XVII (17.10 Å)/(17.05 Å) line ratio, we infer an electron density at the level, while from the observed Fe XXII (11.92 Å)/(11.77 Å) line ratio, we infer at the level and at the level.
Keywords:
atomic processes — binaries: close — stars: individual (EX Hydrae) — stars: magnetic fields — X-rays: binaries:
32.30.Rj, 97.80.Gm1 Introduction
The standard density diagnostic of high-temperature plasmas is the intensity ratio of the forbidden to intercombination lines of He-like ions, which falls from its low-density value to zero at a critical density (where ) that increases from for C to for Fe (Gabriel & Jordan, 1969; Blumenthal, Drake, & Tucker, 1972; Porquet et al., 2001; Porquet, 2005) (see left panel of Fig 1). Unfortunately, this diagnostic is compromised in ultraviolet-bright sources like O stars and cataclysmic variables, wherein photoexcitation competes with collisional excitation to depopulate the upper level of the forbidden line, causing the line ratio to appear to be in the high-density limit regardless of the density; for a plasma illuminated by a 30 kK blackbody, this is true for all elements through Mg (Mauche, 2002) (see right panel of Fig 1). In an attempt to circumvent this problem, we have undertaken an investigation of potential density diagnostics of lines of Fe L-shell ions (Fe XVII–Fe XXIV). These diagnostics are applicable to collisionally ionized plasmas with electron temperatures –45 MK (0.2–4 keV) and electron densities . Given the high densities, these diagnostics are particularly suitable to magnetic cataclysmic variables (polars and intermediate polars (Warner, 1995)), in which the density of the X-ray–emitting plasma is increased by (1) the magnetic channeling of the mass lost by the secondary onto small spots near the white dwarf magnetic poles; (2) the factor-of-four density jump across the standoff shock, which heats the plasma to a temperature MK; and (3) the settling nature of the post-shock flow, wherein the pressure is roughly constant and the density scales inversely with the decreasing temperature (Frank, King, & Raine, 1992). For a mass-accretion rate (hence luminosity ), a free-fall velocity , and a relative spot size , the density of the accretion flow immediately behind the shock .
In two previous publications, we explored the density and photoexcitation sensitivity of the Fe XVII (17.10 Å)/(17.05 Å) line ratio (Mauche, Liedahl, & Fournier, 2001) and the Fe XXII (11.92 Å)/(11.77 Å) line ratio (Mauche, Liedahl, & Fournier, 2003) and applied them to the Chandra X-ray Observatory High-Energy Transmission Grating Spectrometer (HETGS) Medium Energy Grating (MEG) spectrum of the intermediate polar EX Hya (Greeley et al., 1997; Hurwitz et al., 1997; Fujimoto & Ishida, 1997; Eisenbart et al., 2002; Hoogerwerf, Brickhouse, & Mauche, ). We summarize the results of those investigations below, but first provide a general look at the Chandra HETG spectrum of EX Hya and the density sensitivity of the X-ray spectra of all Fe L-shell ions.

2 Chandra Spectrum of EX Hya
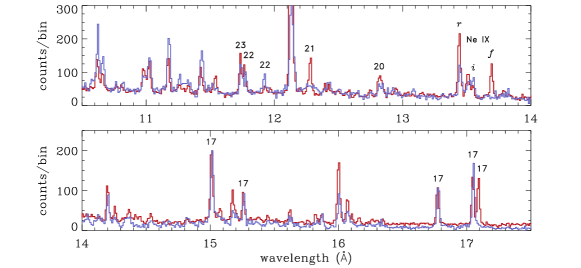
We begin by comparing the Chandra MEG spectrum of EX Hya with that of the coronally active RS CVn binary HR 1099 (Ayres et al., 2001; Ness et al., 2002; Osten et al., 2004). As one of the targets of the Chandra Emission Line Project (http://asc.harvard.edu/elp/ELP.html) (Brickhouse & Drake, 2000), HR 1099 was observed extensively by Chandra, and its X-ray spectrum is one of the benchmarks for models of collisionally ionized plasmas. Figure 2 shows the MEG count spectra of EX Hya (blue histogram) and HR 1099 (red histogram) in the 10.5–17.5 Å bandpass, which contains the strongest lines of Fe L-shell ions. The spectrum of EX Hya differs from that of HR 1099 in (1) the absence of the Fe XVII 17.10 Å line, (2) the strength of the Fe XVII 17.05 Å line, (3) the absence of the Ne IX 13.70 Å forbidden line, (4) the weakness of the Fe XX 12.83 Å line, (5) the absence of the Fe XXI 12.26 Å line, and (6) the strength of the Fe XXII 11.92 Å line. As shown by Fig 1, the absence of the Ne IX forbidden line is indicative of electron densities or of photoexcitation by a kK blackbody. The later possibility cannot be excluded in EX Hya, whose far ultraviolet spectrum has been modeled as a kK white dwarf (Greeley et al., 1997) and as a kK white dwarf with a kK hot spot (Mauche, 1999). As we will see below, the Fe XVII (17.10 Å)/(17.05 Å) line ratio and the Fe XXII (11.92 Å)/(11.77 Å) line ratio are less sensitive to photoexcitation, and indeed the strength of all the Fe L-shell lines are consistent with electron densities .
3 LXSS Fe L-Shell Model Spectra
We constructed model spectra of Fe L-shell ions using the Livermore X-ray Spectral Synthesizer (LXSS), a suite of IDL codes that calculates spectral models of highly charged ions based on Hebrew University/Lawrence Livermore Atomic Code (HULLAC) atomic data. HULLAC calculates atomic wavefunctions, level energies, radiative transition rates, and oscillator strengths according to the fully relativistic, multiconfiguration, parametric potential method (Klapisch, 1971; Klapisch et al., 1977). Electron impact excitation rate coefficients are computed quasi-relativistically in the distorted wave approximation (Bar-Shalom, Klapisch, & Oreg, 1988) assuming a Maxwellian velocity distribution. Table 1 lists the number of energy levels, radiative transition rates for E1, E2, M1, and M2 decays, and electron impact excitation rate coefficients for each of our Fe L-shell models. Using these data, LXSS calculates the level populations for a given temperature and density assuming collisional-radiative equilibrium. The line intensities are then simply the product of the level populations and the radiative transition rates. In the sections below on Fe XVII and Fe XXII, we account for photoexcitation by including in the LXSS population kinetics calculation the photoexcitation rates , where is the continuum spectral energy distribution and are the oscillator strengths of the various transitions. For simplicity, we assume that (i.e., the radiation field is that of a blackbody of temperature ) and the dilution factor of the radiation field is equal to (i.e., the X-ray emitting plasma is in close proximity to the source of the photoexcitation continuum).
| Ion | Levels | Collisional Rates | Radiative Rates |
|---|---|---|---|
| Fe XVII | 281 | 33,887 | 49,882 |
| Fe XVIII | 456 | 93,583 | 141,229 |
| Fe XIX | 605 | 164,496 | 240,948 |
| Fe XX | 609 | 165,350 | 257,765 |
| Fe XXI | 591 | 153,953 | 227,743 |
| Fe XXII | 228 | 24,084 | 37,300 |
| Fe XXIII | 116 | 6,478 | 8,798 |
| Fe XXIV | 76 | 1,704 | 4,100 |
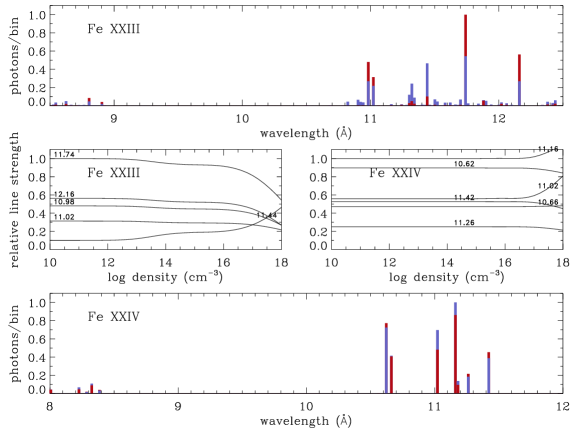
The resulting Fe L-shell ion spectra are shown in Figs 3–6. In each case, the atomic model was calculated at the temperature of the peak ionization fraction for each ion (Mazzotta et al., 1998) for electron densities –, and the spectra were binned to 0.02 Å, which is approximately equal to the FWHM of the MEG spectra. The upper and lower panels of each figure show the model spectra at the extremes of the density grid: in red and in blue. Note that each panel encompasses a different 4 Å bandpass, allowing them to be compared directly to Fig 2. In each case, the spectrum is scaled to the brightest line in the model and by a factor of . The middle panels of each figure show as a function of electron density the relative line strengths for lines brighter than 0.25 photons/bin. Each of these models is discussed in turn.
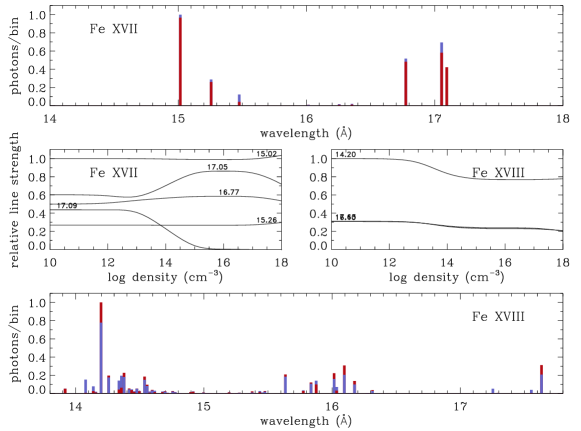
Fe XVII: The X-ray spectrum of Ne-like Fe XVII is dominated at low densities by the three – lines near 15 Å and the three – lines near 17 Å. As the density increases, the 17.10 Å line disappears and the 17.05 Å line brightens. As shown below, the (17.10 Å)/(17.05 Å) line ratio observed in EX Hya is consistent with at MK.
Fe XVIII: The X-ray spectrum of F-like Fe XVIII is dominated at low densities by the – line at 14.20 Å. As the density increases, the three brightest lines of this ion all dim, providing no useful density diagnostic.
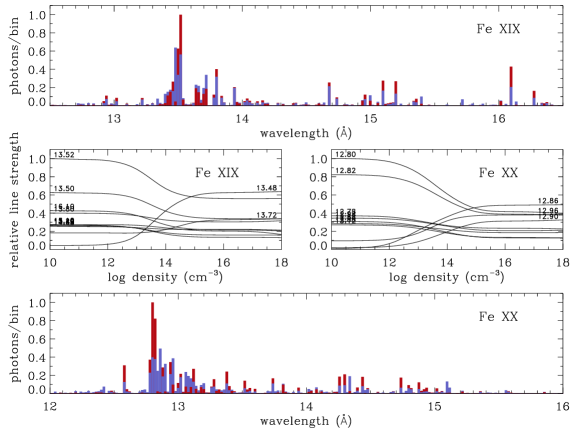
Fe XIX: The X-ray spectrum of O-like Fe XIX is dominated at low densities by a tight clump of – lines near 13.5 Å. As the density increases, the 13.52 Å and 13.50 Å lines dim and the 13.48 Å line brightens, providing a potential density diagnostic, although these lines are blended with the (typically brighter) He lines of Ne IX.
Fe XX: The X-ray spectrum of N-like Fe XX is dominated at low densities by a broad clump of – lines near 12.8 Å. As the density increases, the 12.80 Å and 12.82 Å lines dim and the 12.86 Å, 12.96 Å, and 12.90 Å lines brighten, providing a potential density diagnostic. The weakness of the 12.8 Å line in EX Hya is consistent with at MK.
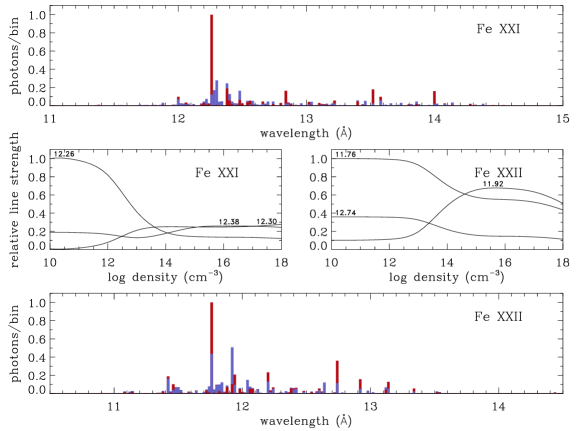
Fe XXI: The relatively simple X-ray spectrum of C-like Fe XXI is dominated at low densities by a single – line at 12.26 Å. As the density increases, this line dims and the 12.38 Å line brightens, providing a potential density diagnostic. The absence of the 12.26 Å line in EX Hya is consistent with at MK.
Fe XXII: The X-ray spectrum of B-like Fe XXII is dominated at low densities by the – line at 11.77 Å. As the density increases, this line dims and the – line at 11.92 Å line brightens, providing a clear density diagnostic. As shown below, the (11.92 Å)/(11.77 Å) line ratio observed in EX Hya is consistent at MK.
Fe XXIII: The X-ray spectrum of Be-like Fe XXIII consists of a few strong – lines between 11.0–12.2 Å. As the densities increases, the 11.74 Å line dims and the 11.44 Å line brightens, but they do not become comparable in strength until .
Fe XXIV: The X-ray spectrum of Li-like Fe XXIV consists of a few strong –, –, and – lines between 10.6–11.4 Å. There is little density dependence to its X-ray spectrum.
Based on the foregoing, it is clear that the Fe XVII (17.10 Å)/(17.05 Å) line ratio and the Fe XXII (11.92 Å)/(11.77 Å) line ratio provide the most straightforward density diagnostics of Fe L-shell ions. Each of these is discussed in more detail below.
4 Fe XVII
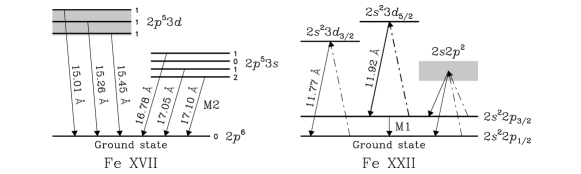
Because of the persistence of Ne-like Fe XVII over a broad temperature range (–12 MK) and the large collision strengths for transitions, the – (, ) lines of Fe XVII at 15–17 Å are prominent in the X-ray spectra of high-temperature plasmas in tokamaks (Klapisch et al., 1978; Phillips et al., 1997; Beiersdorfer et al., 2001), the Sun (Rugge & McKenzie, 1985; Phillips et al., 1997; Saba et al., 1999), and both late- and early-type stars (Canizares et al., 2000; Ayres et al., 2001; Kahn et al., 2001; Waldron & Cassinelli, 2001). The lowest-lying configurations of Fe XVII are the ground state, the manifold (4 levels), the manifold (10 levels), and the manifold (12 levels) (Fig 7). Because electron impact excitation from the ground state is strong for transitions into the configurations, but weak for transitions into the configuration, the population flux into the lowest-lying configuration is dominated by radiative cascades originating on higher-lying energy levels, rather than direct excitation from the ground state. The four levels of the configuration have, in increasing energy order, total angular momenta , 1, 0, and 1. The – transition is strictly forbidden, but the remaining three levels , 1, and 1 decay to ground, producing lines at 17.10, 17.05, and 16.78 Å, respectively. The 17.10 Å line is produced by an M2 transition, but it is nevertheless bright because the upper level is populated efficiently by radiative cascades, and its radiative branching ratio to ground is 1.0. Since the radiative decay rate of this transition is slow compared to the other – lines, collisional depopulation sets in at lower densities. Thus, the intensity ratio of the 17.10 Å line to any of the other – lines provides a density diagnostic, as was first pointed out by Klapisch et al. (1978).
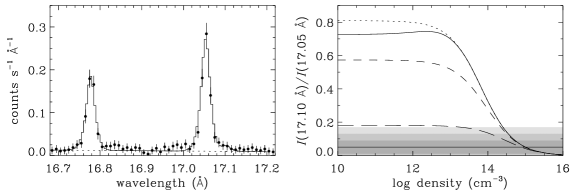
To investigate quantitatively the density and photoexcitation dependence of the Fe XVII (17.10 Å)/(17.05 Å) line ratio, we calculated LXSS models for this ion for MK, –, and –60 kK (for additional details, see (Mauche, Liedahl, & Fournier, 2001)). Figure 8 shows the LXSS model (17.10 Å)/(17.05 Å) line ratio, the Chandra MEG spectrum of EX Hya in the neighborhood of the Fe XVII – lines, and the value and 1, 2, and error envelops of the measured (17.10 Å)/(17.05 Å) line ratio. The calculation shows that the blackbody temperature must be kK to drive the (17.10 Å)/(17.05 Å) line ratio into the high-density limit, while the figure shows that, in EX Hya, or kK at the level.
5 Fe XXII
The density sensitivity of the X-ray lines of B-like Fe XXII has been discussed extensively in studies of the X-ray spectra of solar and laboratory high-temperature plasmas (Doschek, Meekins, & Cowan, 1973; Mason & Storey, 1980; Doschek, Feldman, & Cowan, 1981; Phillips et al., 1982; Fawcett et al., 1987; Phillips et al., 1996; Wargelin et al., 1998; Chen et al., 2004). At low densities, the Fe XXII electron population is primarily in the ground state, and collisional excitations are predominantly from the ground state into the manifold (8 levels) and the level, both of which decay primarily to ground, producing lines in the extreme ultraviolet (EUV) and at 11.77 Å, respectively (Fig 7). However, these levels also decay to the first-excited level with approximately 15% probability, producing lines in the EUV and at 11.92 Å; when that level decays to ground, it produces a line in the ultraviolet. As the density increases, electron population builds up in the first-excited level because the M1 transition to ground is slow. At high densities, the first-excited level is fed primarily by radiative decays from the manifold. Collisional excitations out of the first-excited level are primarily into the level, which decays primarily back to the first-excited level, producing a line at 11.92 Å. Consequently, the Fe XXII 11.92 Å line is relatively strong in the X-ray spectra of high-density plasmas.
To investigate quantitatively the density and photoexcitation dependence of the Fe XXII (11.92 Å)/(11.77 Å) line ratio, we calculated LXSS models for this ion for MK, –, and –100 kK. Motivated by the detailed study of Fournier et al. (2001) of the density-sensitive Fe L-shell lines in the EUV, in these models we made two modifications to the collisional excitation data used in LXSS. First, we replaced, for all transitions between and among the and levels of Fe XXII, the electron impact excitation rate coefficients computed with HULLAC with those of Zhang & Pradhan (1997) computed with the relativistic R-matrix method. Second, we added proton excitations for transitions among the levels of the and configuration using the proton impact excitation rate coefficients of Foster, Keenan, & Reid (1997). For additional details, see (Mauche, Liedahl, & Fournier, 2003).
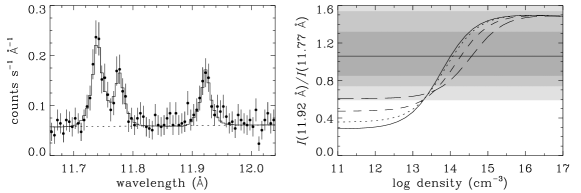
Figure 9 shows the resulting LXSS model (11.92 Å)/(11.77 Å) line ratio, the Chandra MEG spectrum of EX Hya in the neighborhood of the Fe XXII – lines, and the value and 1, 2, and error envelops of the measured (11.92 Å)/(11.77 Å) line ratio. The figure shows that the (11.92 Å)/(11.77 Å) line ratio is relatively insensitive to photoexcitation, and that, in EX Hya, at the level and or kK at the level.
6 Summary
We have provided a discussion of the density and photoexcitation sensitivity of the X-ray spectra of collisionally ionized Fe L-shell ions. Potentially useful density diagnostics are identified for Fe XVII and Fe XIX–Fe XXIII, with the most straightforward being the Fe XVII (17.10 Å)/(17.05 Å) line ratio and the Fe XXII (11.92 Å)/(11.77 Å) line ratio. Compared to the He-like density diagnostics, the Fe L-shell density diagnostics are less sensitive to photoexcitation, hence are particularly valuable for sources like O stars and cataclysmic variables that are bright in the ultraviolet. Applying these models to the Chandra HETG spectrum of the intermediate polar EX Hya, we have shown that the observed Fe XVII (17.10 Å)/(17.05 Å) line ratio is consistent with an electron density (or a blackbody photoexcitation temperature kK) at the level, while from the observed Fe XXII (11.92 Å)/(11.77 Å) line ratio, we infer at the level and (or kK) at the level. The high densities are assured in EX Hya, whose far ultraviolet spectrum has been modeled as a kK white dwarf (Greeley et al., 1997) and as a kK white dwarf with a kK hot spot (Mauche, 1999). While these results are particular to EX Hya, the Fe L-shell density diagnostics are applicable to collisionally ionized laboratory (e.g., tokamak) or cosmic (e.g., cataclysmic variable) plasmas with electron temperatures –45 MK and electron densities .
References
- Ayres et al. (2001) Ayres, T. R., et al. 2001, ApJ, 549, 554
- Bar-Shalom, Klapisch, & Oreg (1988) Bar-Shalom, A., Klapisch, M., & Oreg, J. 1988, Phys. Rev. A, 38, 1773
- Beiersdorfer et al. (2001) Beiersdorfer, P., von Goeler, S., Bitter, M., & Thorn, D. B. 2001, Phys. Rev. A, 64, 032705
- Blumenthal, Drake, & Tucker (1972) Blumenthal, G. R., Drake, G. W. F., & Tucker, W. H. 1972, ApJ, 172, 205
- Brickhouse & Drake (2000) Brickhouse, N. S., & Drake, J. J. 2000, RevMexAA (Serie de Conferencias), 9, 24
- Canizares et al. (2000) Canizares, C. R., et al. 2000, ApJ, 539, L41
- Chen et al. (2004) Chen, H., et al. 2004, ApJ, 611, 598
- Doschek, Feldman, & Cowan (1981) Doschek, G. A., Feldman, U., & Cowan, R. D. 1981, ApJ, 245, 315
- Doschek, Meekins, & Cowan (1973) Doschek, G. A., Meekins, J. F., & Cowan, R. D. 1973, Sol. Phys., 29, 125
- Eisenbart et al. (2002) Eisenbart, S., Beuermann, K., Reinsch, K., & Gänsicke, B. T. 2002, A&A, 382, 984
- Fawcett et al. (1987) Fawcett, B. C., Jordan, C., Lemen, J. R., & Phillips, K. J. H. 1987, MNRAS, 225, 1013
- Foster, Keenan, & Reid (1997) Foster, V. J., Keenan, F. P., & Reid, R. H. G. 1997, At. Data Nucl. Data Tables, 67, 99
- Fournier et al. (2001) Fournier, K. B., et al. 2001, ApJ, 561, 1144
- Frank, King, & Raine (1992) Frank, J., King, A., & Raine, D. 1992, Accretion Power in Astrophysics (Cambridge: CUP)
- Fujimoto & Ishida (1997) Fujimoto, R., & Ishida, M. 1997, ApJ, 474, 774
- Gabriel & Jordan (1969) Gabriel, A. H., & Jordan, C. 1969, MNRAS, 145, 241
- Greeley et al. (1997) Greeley, B. W., Blair, W. P., Long, K. S., & Knigge, C. 1997, ApJ, 488, 419
- (18) Hoogerwerf, R., Brickhouse, N. S., & Mauche, C. W. 2004, ApJ, 610, 411
- Hurwitz et al. (1997) Hurwitz, M., Sirk, M., Bowyer, S., & Ko, Y.-K. 1997, ApJ, 477, 390
- Kahn et al. (2001) Kahn, S. M., et al. 2001, A&A, 365, L312
- Klapisch (1971) Klapisch, M. 1971, Computer Phys. Comm., 2, 239
- Klapisch et al. (1977) Klapisch, M., Schwob, J., Fraenkel, B., & Oreg, J. 1977, J. Opt. Soc. Am., 67, 148
- Klapisch et al. (1978) Klapisch, M., et al. 1978, Phys. Letters, 69A, 34
- Mason & Storey (1980) Mason, H. E., & Storey, P. J. 1980, MNRAS, 191, 631
- Mauche (1999) Mauche, C. W. 1999, ApJ, 520, 822.
- Mauche (2002) Mauche, C. W. 2002, in The Physics of Cataclysmic Variables and Related Objects, ed. B. T. Gänsicke, K. Beuermann, & K. Reinsch (San Francisco: ASP), 113
- Mauche, Liedahl, & Fournier (2001) Mauche, C. W., Liedahl, D. A., & Fournier, K. B. 2001, ApJ, 560, 992
- Mauche, Liedahl, & Fournier (2003) Mauche, C. W., Liedahl, D. A., & Fournier, K. B. 2003, ApJ, 588, L101
- Mazzotta et al. (1998) Mazzotta, P., Mazzitelli, G., Colafrancesco, S., & Vittorio, N. 1998, A&AS, 133, 403
- Ness et al. (2002) Ness, J.-U., et al. 2002, A&Ap, 394, 911
- Osten et al. (2004) Osten, R. A., et al. 2004, ApJS, 153, 317
- Phillips et al. (1996) Phillips, K. J. H., Bhatia, A. K., Mason, H. E., & Zarro, D. M. 1996, ApJ, 466, 549
- Phillips et al. (1982) Phillips, K. J. H., et al. 1982, ApJ, 256, 774
- Phillips et al. (1997) Phillips, K. J. H., et al. 1997, A&A, 324, 381
- Porquet et al. (2001) Porquet, D., Mewe, R., Dubau, J., Raassen, A. J. J., & Kaastra, J. S. 2001, A&A, 376, 1113
- Porquet (2005) Porquet, D. 2005, this volume
- Rugge & McKenzie (1985) Rugge, H. R., & McKenzie, D. L. 1985, ApJ, 297, 338
- Saba et al. (1999) Saba, J. L. R., Schmelz, J. T., Bhatia, A. K., & Strong, K. T. 1999, ApJ, 510, 1064
- Waldron & Cassinelli (2001) Waldron, W. L., & Cassinelli, J. P. 2001, ApJ, 548, L45
- Warner (1995) Warner, B. 1995, Cataclysmic Variable Stars (Cambridge: CUP)
- Wargelin et al. (1998) Wargelin, B. J., Beiersdorfer, P., Liedahl, D. A., Kahn, S. M., & von Goeler, S. 1998, ApJ, 496, 1031
- Zhang & Pradhan (1997) Zhang, H. L., & Pradhan, A. K., 1997, A&AS, 123, 575