Observational tests of the evolution of spheroidal galaxies
Abstract
Granato et al. (2004a) have elaborated a physically grounded model exploiting the mutual feedback between star-forming spheroidal galaxies and the active nuclei growing in their cores to overcome, in the framework of the hierarchical clustering scenario for galaxy formation, one of the main challenges facing such scenario, i.e. the fact that massive spheroidal galaxies appear to have formed much earlier and faster than predicted by previous semi-analytical models, while the formation process was slower for less massive objects. After having assessed the values of the two parameters that control the effect of the complex and poorly understood radiative transfer processes on the time-dependent spectral energy distributions (SEDs), we have compared the model predictions with a variety of IR to mm data. Our results support a rather strict continuity between objects where stars formed (detected by (sub)-mm surveys) and evolved massive early-type galaxies, indicating that large spheroidal galaxies formed most of their stars when they were already assembled as single objects. The model is remarkably successful in reproducing the observed redshift distribution of galaxies at , in contrast with both the classical monolithic models (which overestimate the density at high-) and the semi-analytic models (that are systematically low), as well as the ratio of star-forming to passively evolving spheroids and the counts and redshift distributions of Extremely Red Objects (EROs), although the need of a more detailed modelling of the star formation history and of dust geometry is indicated by the data. The model also favourably compares with the ISOCAM m counts, with the corresponding redshift distribution, and with Spitzer/IRAC counts, which probe primarily the passive evolution phase, and with the (sub)-mm SCUBA and MAMBO data, probing the active star-formation phase. The observed fraction of m selected sources with no detectable emission in either the m or -band (Yan et al. 2004a) nicely corresponds to the predicted surface density of star-forming spheroids with m fluxes below the detection limit. Finally, distinctive predictions for the redshift distributions of m sources detected by Spitzer/MIPS surveys are pointed out.
keywords:
galaxies: elliptical and lenticular, cD – galaxies: evolution – galaxies: formation – QSOs: formation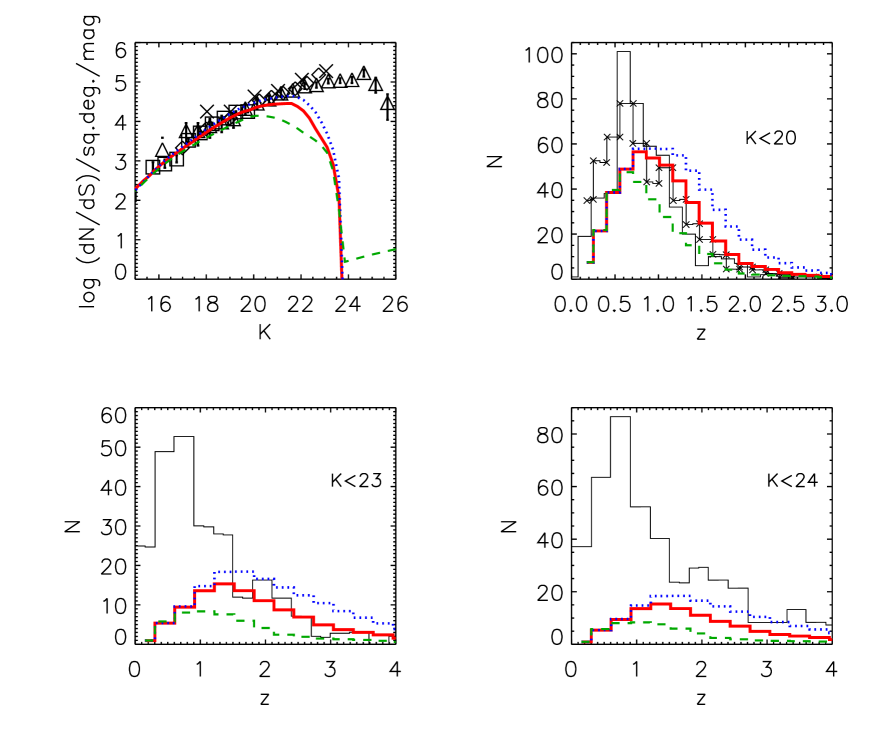
1 Introduction
The standard Lambda Cold Dark Matter (CDM) cosmology is a well established framework to understand the hierarchical assembly of dark matter (DM) halos. Indeed, it has been remarkably successful in matching the observed large-scale structure. However the complex evolution of the baryonic matter within the potential wells determined by DM halos is still an open issue, both on theoretical and on observational grounds.
Full simulations of galaxy formation in a cosmological setting are far beyond present day computational possibilities. Thus, it is necessary to introduce at some level rough parametric prescriptions to deal with the physics of baryons, based on sometimes debatable assumptions (e.g. Binney 2004). A class of such models, known as semi-analytic models, has been extensively compared with the available information on galaxy populations at various redshifts (e.g. Lacey et al. 1993; Kauffmann, White & Guiderdoni, 1993; Cole et al. 1994; Kauffmann et al. 1999; Somerville & Primack 1999; Cole et al. 2000; Granato et al. 2000; Benson et al. 2003; Baugh et al. 2004).
The general strategy consists in using a subset of observations to calibrate the many model parameters providing a heuristic description of baryonic processes we don’t properly understand. Besides encouraging successes, current semi-analytic models have met critical inconsistencies which seems to be deeply linked to the standard recipes and assumptions. These problems are in general related to the properties of elliptical galaxies, such as the color-magnitude and the [/Fe]-M relations (Cole et al. 2000; Thomas 1999; Thomas et al. 2002), and the statistics of sub-mm and deep IR selected (I- and K-band) samples (Silva 1999; Chapman et al. 2003; Kaviani et al. 2003; Daddi et al. 2004; Kashikawa et al. 2003; Poli et al. 2003; Pozzetti et al. 2003; Somerville et al. 2004). Discrepancies between the observationally estimated merger rate evolution and that predicted by semi-analytic models have also been reported (Conselice et al. 2003).
However, the general agreement of a broad variety of observational data with the hierarchical scenario and the fact that the observed number of luminous high-redshift galaxies, while substantially higher than predicted by standard semi-analytic models, is nevertheless consistent with the number of sufficiently massive dark matter halos, indicates that we may not need alternative scenarios, but just some new ingredients or assumptions (see e.g. Baugh et al. 2004; Tecza et al. 2004).
Previous work by our group (Granato et al. 2001; Romano et al. 2002; Granato et al. 2004a) suggests that a crucial ingredient is the mutual feedback between spheroidal galaxies and active nuclei at their centers. Granato et al. (2004a, henceforth GDS04) presented a detailed physically motivated model for the early co-evolution of the two components, in the framework of the CDM cosmology.
In this paper, we present a comparison of the model with the observed number counts and redshift distributions in several near-IR (NIR) to (sub)-mm bands.
In Section 2 we give a short overview of the GDS04 model for spheroidal galaxies, and we discuss the determination of the parameters controlling the time-dependent spectral energy distributions (SEDs) of spheroidal galaxies. In Section 3 , the model predictions are compared with a variety of recent data. The main conclusions are summarized and discussed in Section 4.
We adopt the “concordance” cosmological model, with , , .
2 Model description and assessment of the parameters
2.1 The GDS04 model
While referring to GDS04 for a full account of the model assumptions and their physical justification, we provide here, for the reader’s convenience, a brief summary of its main features.
The model follows with simple, physically grounded recipes and a semi-analytic technique the evolution of the baryonic component of proto-spheroidal galaxies within massive dark matter (DM) halos forming at the rate predicted by the standard hierarchical clustering scenario within a CDM cosmology. The main novelty with respect to other semi-analytic models is the central role attributed to the mutual feedback between star formation and growth of a super massive black hole (SMBH) in the galaxy center. Further relevant differences are the assumption that the large scale angular momentum does not effectively slow down the collapse of the gas and the star formation in massive halos virialized at high redshift, and the allowance for a clumping factor, , speeding up the radiative cooling so that even in very massive halos (), the gas, heated to the virial temperature, can cool on a relatively short (–Gyr) timescale, at least in the dense central regions.
The GDS04 prescriptions are assumed to apply to DM halos virializing at and . These cuts are meant to crudely single out galactic halos associated with spheroidal galaxies. Disk (and irregular) galaxies are envisaged as associated primarily to halos virializing at , some of which have incorporated most halos less massive than virializing at earlier times, that may become the bulges of late type galaxies. However, the model does not address the formation of disk (and irregular) galaxies and these objects will not be considered in this paper. On the other hand, we do not expect that proto-spheroidal galaxies in the star-forming phase have already a spheroidal shape; rather they are likely to have an irregular, complex, disturbed morphology.
The kinetic energy fed by supernovae is increasingly effective, with decreasing halo mass, in slowing down (and eventually halting) both the star formation and the gas accretion onto the central black hole. On the contrary, star formation and black hole growth proceed very effectively in the more massive halos, giving rise to the bright SCUBA phase, until the energy injected by the active nucleus in the surrounding interstellar gas unbinds it, thus halting both the star formation and the black hole growth (and establishing the observed relationship between black hole mass and stellar velocity dispersion or halo mass). Not only the black hole growth is faster in more massive halos, but also the feedback of the active nucleus on the interstellar medium is stronger, to the effect of sweeping out such medium earlier, thus causing a shorter duration of the active star-formation phase. As a result, in keeping with the previous proposition by Granato et al. (2001), the physical processes acting on baryons reverse the order of formation of spheroidal galaxies with respect to the hierarchical assembling of DM halos, leading to the Anti-hierarchical Baryon Collapse (ABC) scenario.
2.2 Spectral energy distribution of spheroidal galaxies
As in GDS04, we compute the SEDs of spheroidal galaxies using our code GRASIL, described in Silva et al. (1998)111The code is available at http://adlibitum.oat.ts.astro.it/silva/ default.html or at http://web.pd.astro.it/granato. GRASIL computes the time-dependent UV to radio SED of galaxies, given their star formation and chemical enrichment histories (derived as described in GDS04), and with a state of the art treatment of dust reprocessing. The latter point is fundamental, since during the phase of intense star-formation, young stars are mixed with a huge amount of gas, quickly chemically enriched and dust polluted. The use of local templates (such as M82 or Arp220) may be inappropriate in these extreme conditions.
One of the most important distinctive features of GRASIL is that it has included, for the first time, the effect of differential extinction of stellar populations (younger stellar generations are more affected by dust obscuration), due to the fact that stars form in a denser than average environment, the molecular clouds (MCs), and progressively get rid of them.
Radiative transfer results depend on the poorly known geometry of the system. Broadly speaking, predictions of fluxes during the active star forming phase become more and more affected by the ensuing model uncertainties at shorter and shorter wavelengths. In GDS04 we presented predictions for the dust-enshrouded SCUBA galaxies, or for the essentially dust-free passively evolving galaxies; in both cases, the results were insensitive to the details of the dust distribution. On the other hand, key information on the early evolution of spheroidal galaxies is provided by near-IR (particularly -band) and mid-IR (ISO and Spitzer) data. To test the model against them we need a more careful investigation of the dependence of our results on the structure of galaxies.
In general, the GRASIL SEDs for spheroidal systems depend on five structural parameters: the fraction of gas in the form of MCs rather than in the diffuse ISM (cirrus), the optical depth of MCs for a source at their center (conventionally given at 1 m hereafter), the escape timescale of newly born stars from MCs, , and the core radii of the distributions of diffuse dust, , and of stars outside MCs, , assumed to follow a King (1972) law. In the following we will take , and we will drop the superscript.
However, in the conditions envisaged here and for the purposes of the present work, the results are significantly affected only by . This is proportional to the dust to gas mass ratio and to , and being the typical mass and radius of molecular clouds, respectively. As for , we have simply assumed that it increases linearly with the gas metallicity (e.g., Dwek 1998) and is (the Galactic value) for solar metallicity. Since the chemical evolution of the galaxy is computed self-consistently, the true parameter is , but we prefer to make reference to the value of for solar metallicity (and thus ). We have checked that all the results presented here, except those on Extremely Red Objects (EROs, see Sect. 3.2), are very little affected by variations, within rather wide ranges, of the other GRASIL parameters.
However, an additional parameter is required to circumvent the problem that, for stars already outside their parent molecular clouds, GRASIL takes into account only the relatively small optical depth due to cirrus, neglecting that due to other MCs present along the line of sight. This is not necessarily accurate in the extreme conditions occurring during the fast star forming phase of spheroids, particularly in the dense central regions. In general, the mean optical depth to a star outside its parent MC is , where we have assumed a uniform dust distribution inside MCs, and is mean number of MCs along its line of sight.
| (1) |
where is a shape factor and we have assumed , being the virial mass of the galaxy. Whenever , the optical depth drops from to ( at IR wavelengths) when the stars move out of their parent MCs. This condition is usually met in nearby galaxies. On the contrary, in forming spheroids can be substantially larger than . The shape factor depends on the relative distribution of stars and MCs, and its value is also a function of the age of the stellar population under consideration: younger stars (but old enough to be out of molecular clouds) are on average closer to regions rich in MCs.
Thus, an accurate calculation of is extremely difficult, and we are forced to parameterize our ignorance. Also, the present release of GRASIL does not allow us to deal with the radiation transfer through the distribution of MCs. On the other hand, such detailed treatment is not crucial for our present purposes since whenever essentially all the starlight is reprocessed by dust. We have crudely approximated as a step function: for and otherwise, treating as an adjustable parameter. In order to take into account the dust heating by the absorbed starlight, in practice we have kept the stars within their MCs for the full duration of the starburst, for galaxies where .
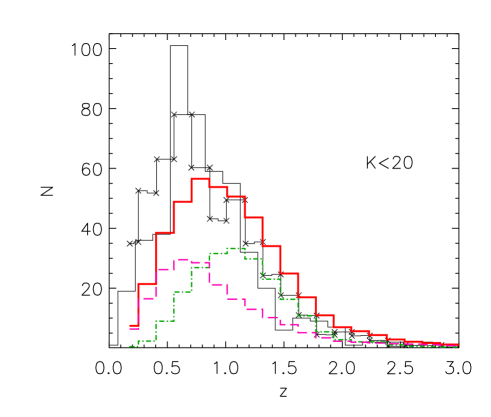
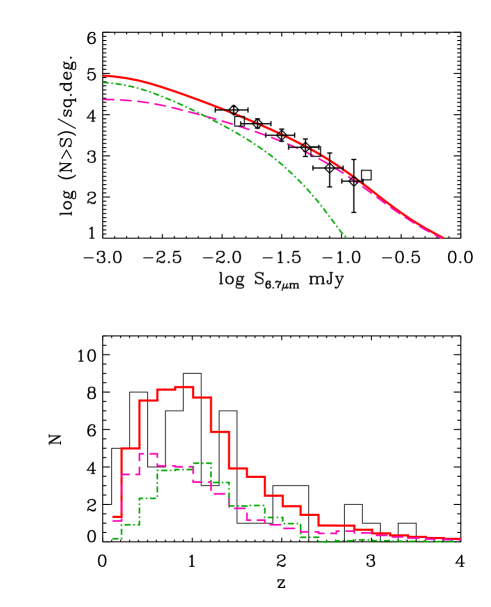
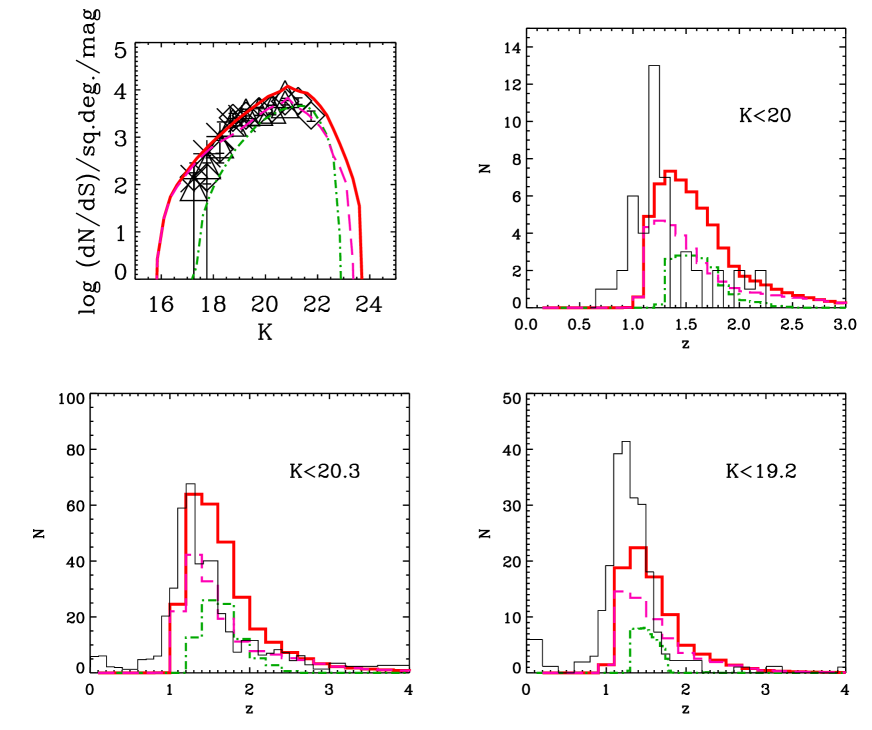
The parameter affects mostly the results at m. The -band counts and redshift distributions are best reproduced setting (Fig. 1). Note that spheroids dominate the redshift distributions at substantial redshifts, while leaving room for other populations at low redshifts. The figure shows also the effect of varying . In particular, a low value of (, not shown), would produce an almost perfect match of the redshift distribution for , but the contributions at and would decrease. A more detailed treatment of the complex behavior of the optical depth to stars outside MCs could improve the overall match, and will be considered for future releases of GRASIL.
The results in Fig. 1 refer to Gyr, and kpc, but change only marginally if and vary within rather broad intervals ( Gyr, ), and is increased or decreased by a factor of a few.
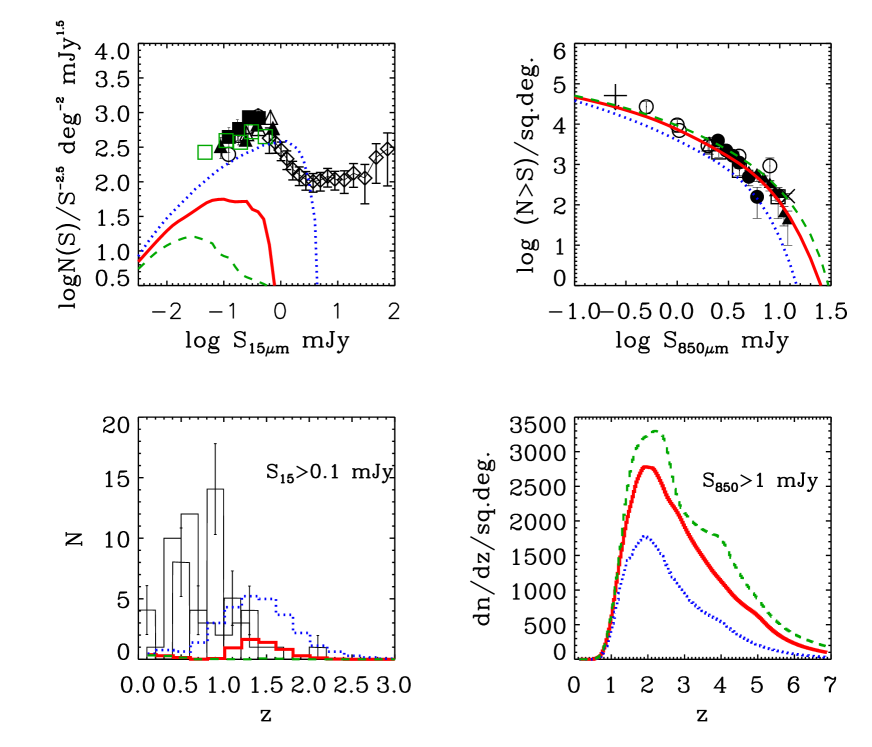
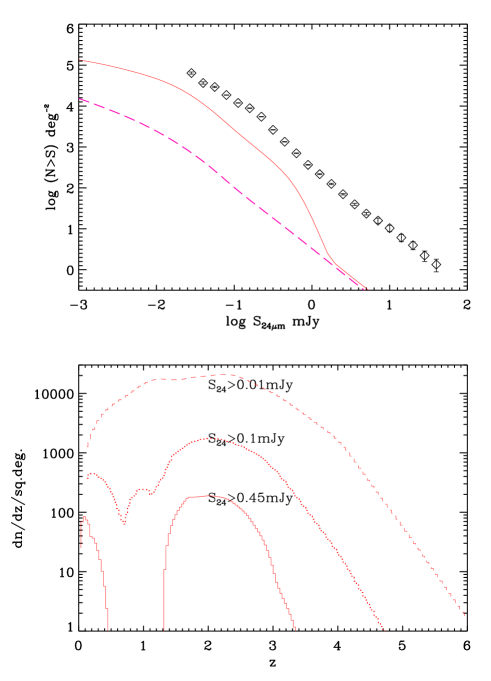
As for , Silva et al. (1998) found that the SEDs of starburst galaxies are well reproduced by GRASIL with (a figure in reasonable agreement with direct observations of Giant Molecular Clouds in the Galaxy, for which , pc). However, the physical conditions in high- star forming spheroids may be very different from those encountered in local systems, including starbursts and Ultra-Luminous IR Galaxies (ULIRGs). Thus, we have explored the generous range . This parameter controls the contribution (if any) of star-forming spheroidal galaxies to the bump in the m ISOCAM counts below a few mJy. Although the observed counts are affected by a considerable uncertainty, as shown by the spread of results from different surveys, and the modelling is complicated by the presence of PAH bands, they have been interpreted by phenomenological models in terms of evolving starbursts, with a minor contribution from spirals, particularly at the brighter flux density levels (e.g. Franceschini et al. 2001; Gruppioni et al. 2002; Lagache et al. 2003; Hammer et al. 2004). Thus, the contribution from star-forming spheroids must be substantially suppressed, implying at m (see Fig. 3). A low value of , and, correspondingly, a large contribution from spheroids to the sub-mJy bump of the m counts (upper-left panel), would entail a high- tail of the redshift distribution of sources with mJy substantially larger than indicated by current data (lower left-hand panel).
On the other hand, as illustrated by the right-hand panels of Fig. 3, an exceedingly large value of would overproduce the m counts, while a very small value would underproduce them. The ensuing lower limit to is however model dependent, since the effect of decreasing it may be compensated by a smaller value of the dust emissivity index, that we take equal to 2.
In the following we set at m, a value yielding m counts and redshift distributions consistent with the data, and a small, but non-negligible, contribution to the sub-mJy m counts.
3 Comparison with the data
3.1 Counts and redshift distributions
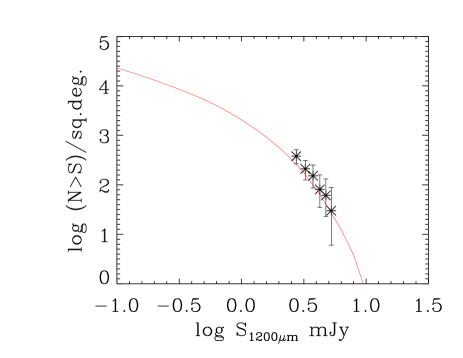
As discussed by Granato et al. (2001, 2004a), in the present framework the SCUBA-selected galaxies are interpreted as being mostly star-forming massive proto-spheroidal galaxies (). The values of the GRASIL parameters derived above nicely fit the m SCUBA counts (see Fig. 3, right-hand panels), and the latest MAMBO m data (Fig. 4). The model m counts are almost undistinguishable from those already reported in Fig. 12 of GDS04, corresponding to a somewhat different choice of the parameters, and the redshift distributions are also essentially unchanged. Indeed, the predictions in the sub-mm region are not very sensitive to the precise values of GRASIL parameters, as far as proto-spheroidal galaxies are optically thick in the optical-UV. The predicted redshift distribution of sources brighter than mJy at m has a broad peak at with an extended tail towards higher redshifts, due to star-forming spheroidal galaxies. As already remarked in GDS04, this redshift distribution is in good agreement with the limited information available so far. In particular, the median redshift of the Chapman et al. (2003) sample (mJy) is , with a quartile range of . The median and quartile range for our model are and .
While the sub-mm counts are informative on the star-formation phase of the evolution of spheroidal galaxies, the -band counts (Fig. 1) in the range are dominated by the passive evolution phase. Fainter than also star-forming spheroids begin to show-up and become increasingly important at fainter magnitudes. The brighter (in terms of apparent magnitude) such objects are those of mass lower than the typical mass probed by present day sub-mm observations, i.e. those having, in the GDS04 model, a prolonged star-formation phase extending to , and whose stars have negligible obscuration as soon as they come out of their parent MC (see Sect. 2.2). This is illustrated by Fig. 2, showing that, for , the contribution from star-forming spheroids peaks at . In particular, the predicted number of spheroids with ongoing star formation at and is about twice that of passive spheroids, and their typical stellar mass is between and , in nice agreement with the findings of Daddi et al. (2004; see their Figure 5) and Somerville et al. (2004). The Star Formation Rate (SFR) of these active objects is : according to our model, the band selects spheroids when their SF (and dust obscuration) is declining or after it has stopped. Daddi et al. (2004) measured a dust-corrected average SFR of , higher than our expectations, but still well below the peak SFR of spheroids according to our scenario. This may suggest that the present version of our model envisages a too drastic decline of SF activity in intermediate mass objects (see also Sect. 3.2). Note also that Daddi et al. adopt a Salpeter IMF (), while in the GDS04 model we have used a different IMF ( above 1 M⊙, below) suggested by chemical constraints (see also Romano et al. 2002). This IMF implies a higher L/M ratio and, correspondingly, a SFR lower by about 30%.
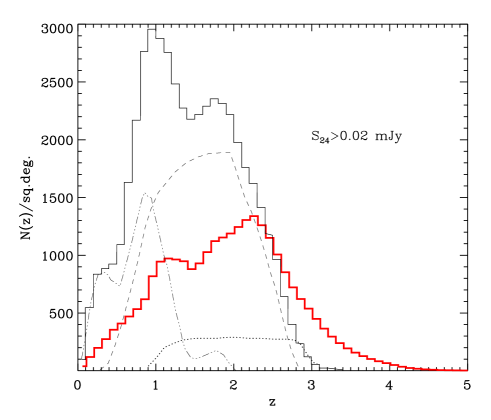
We predict that passively evolving spheroids almost disappear at . The observed high- tails of the distributions for and for are thus mostly due to star-forming spheroids, but the counts are likely dominated by late-type galaxies, which could account for the big peak of the estimated (from photometric redshifts) distribution in the range , as well as for the low- shoulder at .
As shown by Fig. 5, according to our model, spheroids may fully account for the observed m ISOCAM counts and for the redshift distribution derived by Sato et al. (2004; see also Flores et al. 1999). Above Jy they are predicted to be mostly in the passive evolution phase, but the fraction of active star-forming spheroids increases with decreasing flux, reaching % at Jy.
3.2 Extremely Red Objects
Extremely red objects (EROs), with , have received special attention in recent years (Daddi et al. 2000; Smith et al. 2002; Roche et al. 2002, 2003; Cimatti et al. 2002, 2003; Takata et al. 2003; Yan & Thompson 2003; Yan et al. 2004b; Webb et al. 2004; Moustakas et al. 2004), since their properties set crucial constraints on the early evolutionary phases of massive spheroidal galaxies. EROs are actually a mix of dusty star-forming and evolved galaxies formed at high redshifts (Cimatti et al. 2002, 2003; Mohan et al. 2002).
We have worked out the counts and the redshift distributions of both star-forming and passively evolving spheroidal galaxies brighter than , 20, 20.3 that, according to our model, have ERO colours (Fig. 6). This prediction is the only one, among those presented in this paper, which depends strongly also on GRASIL parameters other than and (see Sect. 2.2). Indeed, the predictions at for dusty and star forming EROs require the computation of rest frame fluxes at Å, which are severely dependent on details of dust obscuration.
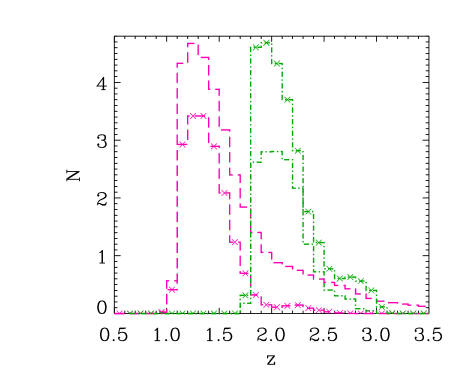
In sharp contrast with the standard semi-analytical models, which severely under-predict this population (e.g., Somerville et al. 2004), our model somewhat over-produces the number of EROs (of both classes), in the range . On the observational side, the present redshift distributions may be biased by the strong clustering of these sources and affected by sampling variance, and some may be incomplete at (Yan et al. 2004b). From the theoretical point of view, it should be noted that a mild star formation activity (say at a level a few % of the peak rate), either due to residual gas or induced occasionally by interactions, neglected by our simple model, could significantly decrease the predicted number of passive galaxies with ERO colours, particularly at high redshifts. To illustrate this possibility, Fig. 7 shows the effect on predicted z-distribution of EROs brighter than of an ’artificial’ (i.e. not predicted by the model equations) episode of star formation starting after the feedback from the QSO has swept out the ISM (QSO phase in the terminology of GDS04), and lasting 1 Gyr. A decline of the SFR somewhat less abrupt than implied by the GDS04 model seems also to be suggested by the results of Daddi et al. (2004), who find that star forming objects at in the K20 survey have a dust-corrected star formation somewhat higher than our prediction (Sect. 3.1). As for dusty and star forming EROs, we reminded above that our prediction depends on details of dust obscuration. For instance a shorter and/or larger values of the galaxy scale length would translate in less reddened objects, without affecting significantly the other results presented in this paper. An example of this is also shown in Fig. 7.
In conclusion, it is encouraging that our model has not troubles in producing enough high-z objects with ERO colours. More statistic in the observations will allow us to improve the treatment of some aspects of the model, such as the amount of star formation after the QSO phase and the dust obscuration.

3.3 The IR background
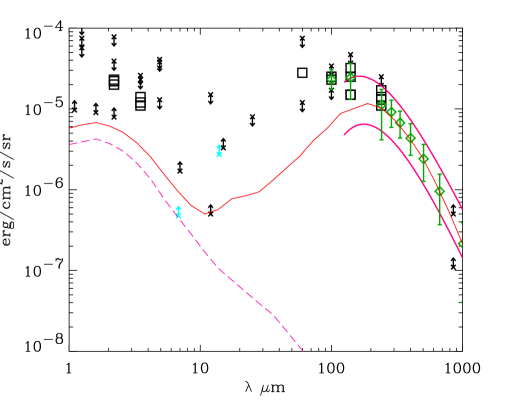
A further constraint on the model comes from the IR background. In Fig. 8 we compare the m background spectrum yielded by our model with the data collected by Hauser & Dwek (2001). Longward of m star-forming spheroids alone may explain the observed background, while at shorter wavelengths, and, in particular, at the intensity peak, late-type (especially starburst) galaxies are expected to dominate.
3.4 Contribution to m Spitzer counts
Figure 9 shows the contribution from forming spheroids to the m number counts, and the predicted redshift distributions at various flux limits.
In particular, our reference model predicts a non-negligible contribution, %, to the m Spitzer counts above mJy. Yan et al. (2004a) report that 13% of the detected sources do not have a counterpart at both m and m, to flux limits of 20 and Jy respectively. In our view, this sub-population should be dominated by forming spheroids. Figure 11 reports the distribution of for our model population with Jy, and shows that only few of these sources have Jy. We expect that the same is true at m, although predictions at this short wavelength, probing the rest frame UV for our model sources, are very uncertain.
In Fig. 10, we have also compared the redshift distribution predicted by Chary e al. (2004, their Fig. 4) for mJy with the one from our model for spheroids. Chary et al. take into account low luminosity starbursts, LIRGs and ULIRGs. Note that our model leaves room for (but does not include) populations other than forming spheroids only at redshift ; therefore we predict much fewer sources at high redshift as compared to Chary et al., but with a tail extending to higher z. Also according to our scenario, the populations responsible for the bulk of the 15 and m counts should be at redshift , since all massive halos virialized at higher z are used to build spheroids (see GDS04 for more details). The observed m redshift distribution will be a strong test for our model.
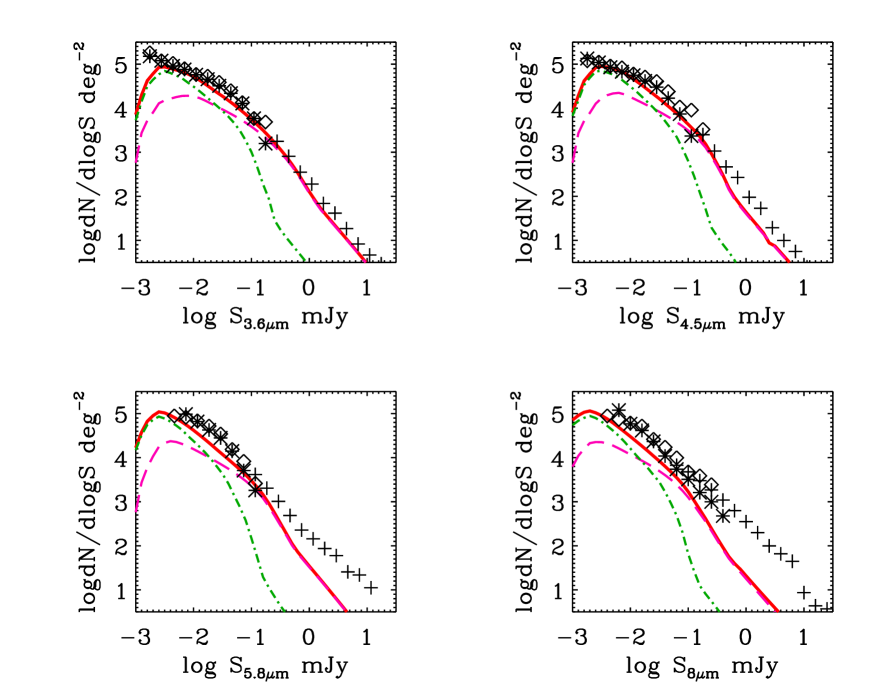
3.5 Contribution to Spitzer-IRAC counts
In Fig. 12 we show the contribution of spheroidal galaxies to the Spitzer/IRAC bands, as predicted by our reference model. As expected based on results for the and the m bands, spheroids dominate the counts (except perhaps at the bright end), with a contribution decreasing from the near- to the mid-IR. Spheroids in the active star-forming phase dominate at faint flux density levels (Jy).
4 Discussion and conclusions
Granato et al. (2001, 2004a) have shown that the mutual feedback between star-forming spheroidal galaxies and the active nuclei growing in their cores can be a key ingredient towards overcoming one of the main challenges facing the hierarchical clustering scenario for galaxy formation, i.e. the fact that the densities of massive high redshift galaxies detected by SCUBA and by deep near-IR surveys are well above the predictions.
The model by GDS04 interprets the SCUBA galaxies as proto-spheroids in the process of forming most of their stars. In fact, according to this model, essentially all massive halos virializing at give rise to elliptical galaxies or to bulges of later type galaxies, that form at lower redshifts. The star-formation in small halos is suppressed by supernova-driven winds, so that the early star-formation occurs primarily in the more massive halos, through gigantic starbursts with star formation rates yr, whose duration is determined by the feedback from the active nuclei, followed by essentially passive evolution. The model can therefore be appropriately tested primarily against surveys selecting high- galaxies, like the (sub)-mm surveys by SCUBA and MAMBO, or spheroidal galaxies, like near to mid-IR surveys.
To this end we first assessed the values of the adjustable parameter of the spectrophotometric code GRASIL (Silva et al. 1998), which regulates the effect of the complex and poorly understood radiative transfer processes on the time-dependent SEDs. To properly deal with the extreme conditions prevailing during the intense star-formation phase of spheroidal galaxies, a new parameter, , had to be introduced. Having fixed the values of the two parameters, and keeping the GDS04 choice for the parameters controlling the star-formation history, the chemical enrichment and the evolution of the dust and gas content of massive spheroidal galaxies, we have shown that the model accounts, on one side, for the SCUBA and MAMBO counts, corresponding to the active star-forming phase, and, on the other side, for the -band counts for –21 and for the redshift distribution of galaxies, as well as for the high- tails of redshift distributions up to .
Although observations unambiguously indicate that stellar populations in nearby spheroidal galaxies are old, it is possible that stars were formed in small sub-units, before the galaxy was assembled. Our results highlight a clear continuity between objects where stars formed (detected by (sub)-mm surveys) and the evolved galaxies dominating the bright -band counts, indicating that massive spheroidal galaxies formed most of their stars when they were already assembled as single objects. As illustrated by Fig. 2, the model is remarkably successful in reproducing the observed redshift distribution for , in contrast with both the classical monolithic models (which overestimate the density at high-) and the semi-analytic models (that are systematically low). For example, Somerville et al. (2004) find that their hierarchical model underproduces ( in their notation) galaxies by about a factor of 3 at , and by an order of magnitude at , while a monolithic model overproduces these galaxies by about a factor of 2 at . The GDS04 model also reproduces the bimodal distribution of colours of the Somerville et al. (2004) sample, as due to contributions of star-forming and passively evolving spheroids. The ratio of star-forming to passively evolving spheroids is also nicely consistent with the finding of Somerville et al. (2004) and Daddi et al. (2004), although the observations of the latter authors suggest a more gradual decline of the star-formation rate than implied by the current version of our model. Again, reproducing the observed colour distribution proves to be very challenging for both monolithic and standard semi-analytic models.
A specific analysis of the -band counts and redshift distributions of EROs has been worked out, since these objects appear to provide particularly sharp constraints on galaxy evolution models. The results confirm that the GDS04 model successfully reproduces the counts, and is in reasonably good agreement with the redshift distributions, although the need of a more sophisticated modelling of the star formation history and of dust geometry is indicated.
The mid-IR counts provided by ISOCAM, primarily at 6.7 and m, and by the Spitzer Space Telescope at several additional wavelengths and over larger areas, constrain the SEDs of spheroidal galaxies which dominate for m, and the evolution properties (as well as the SEDs) of late-type (normal and starburst) galaxies that dominate at longer wavelengths. The ISOCAM counts at 6.7m and the associated redshift distribution are well fitted by the model (Fig. 5), as are the Spitzer/IRAC counts at 3.6, 4.5, and m.
At longer wavelengths, we expect that the contribution of starburst galaxies to the counts becomes increasingly important, particularly at bright flux densities, and to actually dominate at m (Fig. 9). Although modelling the counts of such sources is beyond the scope of the present paper, we note that, according to the GDS04 model, essentially all massive halos at turn into spheroidal galaxies. As a consequence, we expect a sharp drop in the redshift distribution of starburst galaxies at , in contrast with predictions of some current phenomenological models (Dole et al. 2003; Chary & Elbaz 2001), and a high- tail due to star-forming spheroids. For example, we expect a surface density of sources with Jy and about 2 times lower than predicted by Chary et al. (2004, their Fig. 4).
While the scanty redshift information on m sources (Le Floc’h et al. 2004) does not allow us to test our expectations yet, such sources can be preliminarily characterized by their IR colours (Yan et al. 2004a). Remarkably, the predicted fraction of star-forming spheroids with m fluxes below the detection limit matches that found by Yan et al. (2004a). We thus interpret these sources as proto-spheroidal galaxies in the process of forming most of their stars, at typical redshifts but with a tail extending up to .
Moving to still longer wavelengths, we expect that star-forming spheroids start dominating the m counts below 50–mJy, and produce a peak at in the redshift distribution, while at brighter fluxes, counts are likely dominated by low redshifts sources (Rowan-Robinson et al. 2004).
It is worth noticing that the AGN activity powered by the growing SMBHs has a small effect on the number counts of spheroids at all wavelengths considered here. Since the AGN SED () is relatively flat at optical to far-IR wavelengths and drops in the sub-mm region, the maximum AGN contribution occurs around m, at the minimum between the peak of direct starlight emission and that of dust emission (Silva, Maiolino & Granato 2004; see also Fig. 8). But, at this wavelength, the spheroids are anyway a minor component of the counts (see the upper left-hand panel of Fig. 3). The sub-mm counts are dominated by proto-spheroids with very high SFRs (yr for sources brighter than 5 mJy), while the accretion rate onto the SMBH predicted by the model is several orders of magnitude lower (see Figs. 2 and 3 of GDS04). Therefore the AGN luminosity is generally much lower than that due to stars (it is non-negligible only for a very small fraction of the star forming phase) even allowing for a much higher mass to light conversion efficiency. On the other hand, we expect the mild AGN activity to be detectable in X-rays in the majority of the bright SCUBA sources (Granato et al. 2004b), in keeping with the findings by Alexander et al. (2003). A detailed analysis will be presented in a forthcoming paper (Granato et al. in preparation). The counts of spheroids at m are dominated by objects in the passive evolution phase, for which the mass accretion rates onto the SMBHs are very low and, correspondingly, the AGN activity is very weak.
Acknowledgments
Work supported in part by MIUR (through a COFIN grant) and ASI. LS and GLG acknowledge kind hospitality by INAOE where part of this work was performed, as well as support by the LSGLG foundation. Finally, we wish to thank an anonymous referee for helping us in improving the presentation of this work.
References
- [\citeauthoryearAlexander et al.2003] Alexander D.M. et al., 2003, AJ, 125, 383
- [] Barger A.J., Cowie L.L., Sanders D.B., 1999, ApJL, 518, 5
- [] Baugh C.M., Lacey C.G., Frenk C.S., Granato G.L., Silva L., Bressan A., Benson A.J., Cole S., 2004, MNRAS, accepted (astro-ph/0406069)
- [\citeauthoryearBenson et al.2003] Benson A.J., Bower R.G., Frenk C.S., Lacey C.G., Baugh C.M., Cole S., 2003, ApJ, 599, 38
- [] Binney J., 2004, MNRAS, 347, 1093
- [] Blain A.W., Kneib J.-P., Ivison R.J., Smail I., 1999, ApJ, 512, 87
- [] Borys C., Chapman S.C., Halpern M., Scott D., 2002, MNRAS, 330, 63
- [Chapman 2003] Chapman S.C., Blain A.W., Ivison R.J., Smail I.R., 2003, Nat, 422, 695
- [\citeauthoryearChapman et al.2002] Chapman S.C., Smail I., Ivison R.J., Helou G., Dale D.A., Lagache G., 2002, ApJ, 573, 66
- [\citeauthoryearChary & Elbaz2001] Chary R., Elbaz D., 2001, ApJ, 556, 562
- [] Chary R. et al., 2004, ApJS, 154, 80
- [\citeauthoryearCimatti et al.2002] Cimatti A. et al., 2002, A&A, 381, L68
- [\citeauthoryearCimatti et al.2003] Cimatti A. et al., 2003, A&A, 412, L1
- [\citeauthoryearCole et al.1994] Cole S., Aragon-Salamanca A., Frenk C.S., Navarro J.F., Zepf S.E., 1994, MNRAS, 271, 781
- [\citeauthoryearCole et al.2000] Cole S., Lacey C.G., Baugh C.M., Frenk C.S., 2000, MNRAS, 319, 168
- [\citeauthoryearConselice et al.2003] Conselice C.J., Bershady M.A., Dickinson M., Papovich C., 2003, AJ, 126, 1183
- [] Daddi E., Cimatti A., Pozzetti L., Hoekstra H., R ttgering H.J.A., Renzini A., Zamorani G., Mannucci F., 2000, A&A, 361, 535
- [\citeauthoryearDaddi et al.2004] Daddi E. et al., 2004, ApJ, 600, L127
- [] Dole H. et al., 2001, A&A, 372, 702
- [\citeauthoryearDole, Lagache, & Puget2003] Dole H., Lagache G., Puget J.-L., 2003, ApJ, 585, 617
- [] Dole H. et al., 2004, ApJS, 154, 93
- [\citeauthoryearDwek1998] Dwek E., 1998, ApJ, 501, 643
- [] Eales S., Lilly S., Webb T., Dunne L., Gear W., Clements D., Yun M., 2000, AJ, 120, 2244
- [] Elbaz D. et al., 1999, A&A, 351, 37
- [\citeauthoryearElbaz et al.2002] Elbaz D., Cesarsky C.J., Chanial P., Aussel H., Franceschini A., Fadda D., Chary R.R., 2002, A&A, 384, 848
- [] Fazio G.G. et al., 2004, ApJS, 154, 39
- [\citeauthoryearFlores et al.1999] Flores H. et al., 1999, A&A, 343, 389
- [\citeauthoryearFranceschini et al.2001] Franceschini A., Aussel H., Cesarsky C.J., Elbaz D., Fadda D., 2001, A&A, 378, 1
- [\citeauthoryearFranceschini et al.2003] Franceschini A. et al., 2003, A&A, 403, 501
- [\citeauthoryearGranato et al.2000] Granato G.L., Lacey C.G., Silva L., Bressan A., Baugh C.M., Cole S., Frenk C.S., 2000, ApJ, 542, 710
- [\citeauthoryearGranato et al.2001] Granato G.L., Silva L., Monaco P., Panuzzo P., Salucci P., De Zotti G., Danese L., 2001, MNRAS, 324, 757
- [] Granato G.L., De Zotti G., Silva L., Bressan A., Danese L., 2004a, ApJ, 600, 580 (GDS04)
- [] Granato G.L., Silva L., Danese L., De Zotti G., Bressan, A., 2004b, in Mujica R., Maiolino R., eds, Multiwavelength AGN surveys. World Scientific, Singapore, p. 379
- [] Greve T.R., Ivison R.J., Bertoldi F., Stevens J.A., Dunlop J.S., Lutz D., Carilli C. L., 2004, MNRAS, 354, 779
- [\citeauthoryearGruppioni et al.2002] Gruppioni C., Lari C., Pozzi F., Zamorani G., Franceschini A., Oliver S., Rowan-Robinson M., Serjeant S., 2002, MNRAS, 335, 831
- [] Hammer F., Flores H., Elbaz D., Zheng X.Z., Liang Y.C., Cesarsky C., 2004, A&A, accepted (astro-ph/0410518)
- [\citeauthoryearHauser & Dwek2001] Hauser M.G., Dwek E., 2001, ARA&A, 39, 249
- [] Hughes D.H. et al., 1998, Nat, 394, 241
- [Kashikawa 2003] Kashikawa N. et al., 2003, AJ, 125, 53
- [\citeauthoryearKauffmann et al.1999] Kauffmann G., Colberg J.M., Diaferio A., White S.D.M., 1999, MNRAS, 303, 188
- [\citeauthoryearKauffmann, White, & Guiderdoni1993] Kauffmann G., White S.D.M., Guiderdoni B., 1993, MNRAS, 264, 201
- [\citeauthoryearKaviani, Haehnelt, & Kauffmann2003] Kaviani A., Haehnelt M.G., Kauffmann G., 2003, MNRAS, 340, 739
- [\citeauthoryearKing1972] King I.R., 1972, ApJ, 174, L123
- [] Kochanek C.S. et al., 2001, ApJ, 560, 566
- [\citeauthoryearLacey et al.1993] Lacey C., Guiderdoni B., Rocca-Volmerange B., Silk J., 1993, ApJ, 402, 15
- [] Lagache G., Dole H., Puget J.-L., 2003, MNRAS, 338, 555
- [] Le Floc’h E. et al., 2004, ApJS, 154, 170
- [\citeauthoryearLonsdale et al.2003] Lonsdale C.J. et al., 2003, PASP, 115, 897
- [\citeauthoryearMetcalfe et al.2003] Metcalfe L. et al., 2003, A&A, 407, 791
- [\citeauthoryearMohan et al.2002] Mohan N.R., Cimatti A., Röttgering H.J.A., Andreani P., Severgnini P., Tilanus R.P.J., Carilli C.L., Stanford S.A., 2002, A&A, 383, 440
- [] Moustakas L.A., Davis M., Graham J.R., Silk J., Peterson B.A., Yoshii Y., 1997, ApJ, 475, 445
- [] Moustakas L.A. et al., 2004, ApJ, 600, L131
- [] Miyazaki M. et al., 2003, PASJ, 55, 1079
- [] Papovich C. et al., 2004, ApJS, 154, 70
- [\citeauthoryearPoli et al.2003] Poli F. et al., 2003, ApJ, 593, L1
- [\citeauthoryearPozzetti et al.2003] Pozzetti L. et al., 2003, A&A, 402, 837
- [\citeauthoryearRoche et al.2002] Roche N.D., Almaini O., Dunlop J., Ivison R.J., Willott C.J., 2002, MNRAS, 337, 1282
- [\citeauthoryearRoche, Dunlop, & Almaini2003] Roche N.D., Dunlop J., Almaini O., 2003, MNRAS, 346, 803
- [\citeauthoryearRomano et al.2002] Romano D., Silva L., Matteucci F., Danese L., 2002, MNRAS, 334, 444
- [] Rowan-Robinson M. et al., 2004, MNRAS, 351, 1290
- [] Saracco P., Giallongo E., Cristiani S., D’Odorico S., Fontana A., Iovino A., Poli F., Vanzella E., 2001, A&A, 375, 1
- [\citeauthoryearSato et al.2003] Sato Y. et al., 2003, A&A, 405, 833
- [] Sato Y. et al., 2004, AJ, 127, 1285
- [] Silva L., 1999, PhD thesis, SISSA, Trieste, Italy
- [] Silva L., Granato G.L., Bressan A., Danese L., 1998, ApJ, 509, 103
- [] Silva L., Maiolino R., Granato G.L. 2004, MNRAS, in press (astro-ph/0403381)
- [\citeauthoryearSmith et al.2002] Smith G.P. et al., 2002, MNRAS, 330, 1
- [\citeauthoryearSomerville et al.2004] Somerville R.S. et al., 2004, ApJ, 600, L135
- [\citeauthoryearSomerville & Primack1999] Somerville R.S., Primack J.R., 1999, MNRAS, 310, 1087
- [\citeauthoryearTakata et al.2003] Takata T. et al., 2003, PASJ, 55, 789
- [\citeauthoryearTecza et al.2004] Tecza M. et al., 2004, ApJ, 605, L109
- [\citeauthoryearThomas1999] Thomas D., 1999, MNRAS, 306, 655
- [Thomas 2002] Thomas D., Maraston C., Bender R., 2002, Ap&SS, 281, 371
- [] Totani T., Yoshii Y., Maihara T., Iwamuro F., Motohara K., 2001, ApJ, 559, 592
- [] Webb T., Brodwin M., Eales S., Lilly S., 2004, ApJ, 605, 645
- [\citeauthoryearYan & Thompson2003] Yan L., Thompson D., 2003, ApJ, 586, 765
- [] Yan L. et al., 2004a, ApJS, 154, 60
- [] Yan L., Thompson D., Soifer T., 2004b, AJ, 127, 1274