The Disk Atmospheres of Three Herbig Ae/Be Stars
Abstract
We present infrared (IR) spectrophotometry () of three Herbig Ae/Be stars surrounded by possible protoplanetary disks: HD 150193, HD100546 and HD 179218. We construct a mid-IR spectral energy distributions (SED) for each object by using µm HIFOGS spectra, 2.4 – 45 µm spectrophotometry from the ISO SWS, the 12, 25, 60, and 100 µm photometric points from IRAS, and for HD 179218, photometric bolometric data points from the Mt. Lemmon Observing Facility. The SEDs are modeled by using an expanded version of the Chiang & Goldreich (1997) two-layer, radiative and hydrostatic equilibrium, passive disk. This expanded version includes the emission from Mg-pure crystalline olivine (forsterite) grains in the disk surface layer. Each of the three objects studied vary in the amount of crystals evident from their spectrophotometry. HD 150193 contains no crystals while HD 100546 and HD 179218 respectively show evidence of having crystalline silicates in the surface layers of their disks. We find that the inner region of HD100546 has a 37% higher crystalline-to-amorphous silicate ratio in its inner disk region ( AU) compared to the outer disk region, while the inner disk region of HD 179218 has a 84% higher crystalline-to-amorphous silicate ratio in its inner disk region ( AU) compared to the outer region. All three objects are best-fit using a grain size distribution power law which falls as . HD 150193 is best-fit by a small disk ( AU in radius) while HD 100546 and HD 179218 are best fit by larger disks ( AU in radius). Furthermore, HD 100546’s disk flares larger than compared to HD 150193 (25% more at 5 AU) and HD 179218 (80% more at 5 AU). We discuss the implications of our results and compare them with other modeling efforts.
1 INTRODUCTION
The ubiquity of accretion disks around pre-main sequence and young main sequence stars having the potential to form planetary systems is now well established (Koerner, 2001). However, unknown is an accurate estimate of the fraction of single stars with disks that have produced planetary systems. If not all such systems have planets, why then do only some accretion disks form planets and others do not? Theoretical models of particle aggregation show that if particles can grow from submicron to mm to cm in size, then the formation of planetesimals is possible in the time before the disk dissipates (Habing et al., 1999). The problem remains to understand how grains condense from nebular gasses, and how relic interstellar grains survive and are modified by their transport in the disk. These pristine submicron size grains, be they nebular condensates or relic interstellar grains, then grow into mm size particles. However, investigating how grains grow is complicated by the fact that most of the grain processing probably occurs in the hot mid-planes of these disks (Bell et al., 2000), hidden from view by the optically thick disk photospheres. If grains are lofted above the photosphere by disk processes such as winds, turbulent convection, or changes in vertical structure, the evolution of dust can be investigated by observing the properties of the small ( µm) grains in the disk surface layer or atmosphere.
In particular, observing and modeling the 10 µm silicate resonances in nearby (d pc), young (age Myr) Herbig Ae/Be (HAEBE) stars, the sites of possible on-going planetary formation (Waters & Waelkens, 1998), establishes the silicate mineralogy, Mg content of the grains, the degree of crystallinity vs. amorphousness, grain porosity, and grain size distributions. These grain properties can be linked to conditions in protoplanetary disks and constrain theoretical models of protoplanetary disk evolution. For example, amorphous silicates commonly detected in solar system comets are considered to be interstellar relic grains (Li & Greenberg, 1997) and probably are represented by Glasses Embedded with Metals and Sulfides (GEMS) in interplanetary dust particles, IDPs (Brownlee et al., 2000). Conversely, Mg-rich crystalline silicates are thought to be either pristine solar nebula condensates that condensed at K or amorphous silicates annealed into crystals at temperatures K in the inner hot zones of the accretion disk. If these silicate crystals are formed in the hot inner zones of the disk, then the crystals must migrate to large radial distances in order to be incorporated into comets and outer nebula protoplanetesimals. However, the hot temperatures required to form the silicate crystals could have occurred in the early phases ( yrs) of the solar nebula in the disk (Brocklée-Morvan et al., 2002) or in nebula shocks in the AU region, obviating the need for radial transport of the crystals to comet forming zones. Indeed, Mg-rich silicate crystals within IDPs are detected through cometary IR spectra (Wooden et al., 2000a; Wooden, Harker, & Woodward, 2000b). Crystalline silicates also have been spectroscopically identified in pre-main sequence HAEBE stars including HD 100546 (Malfait et al., 1998) and in Pic (Pantin, Lagage, & Artymowicz, 1997), a debris disk system continually repopulated with dust grains via comet-comet collisions and cometary accretion events. The HAEBE stars (the high mass [ M⊙] analogs of T Tauri stars [ M⊙]) are the probable progenitors of the -Pic stars since both have a common occurrence of ‘exocometary activity,’ are similar in spectral type, and have an apparent overlap in Hipparcos ages (Crifo et al., 1997).
In this work, we examine the thermal emission from three Herbig Ae/Be stars of similar spectral type: HD 150193 (A1V), HD 100546 (B9V), and HD 179218 (B9). The stellar ages of the objects are: yrs, yrs, and yrs for HD 150193, HD 100546 and HD 179218, respectively (van den Ancker et al., 1998). We chose these objects for study because they are isolated (not belonging to any know star forming region), have little to no active accretion, possess possible processing circumstellar disks, and have varying degrees of silicate crystallinity (Meeus et al., 2001). We assemble and model SEDs for each system using a passive reprocessing circumstellar disk to constrain the amount of crystalline silicates in the inner and outer parts of the disk, and flaring of the disk in each of the systems.
2 OBSERVATIONS
Spectrophotometry of HD 150193, HD 100546, and HD 179218 was obtained using the NASA Ames Research Center HIgh efficiency Faint Object Grating Spectrometer (HIFOGS: Witteborn et al. (1991)). The spectrum of HD 179218 was obtained on the 2.34-m telescope at the Wyoming Infrared Observatory (WIRO) using 32-bit FORTH telescope software. The spectra of HD 150193 and HD 100546 were obtained on the 4-m Blanco telescope at the National Optical Astronomical Observatories Cerro Tololo Inter-American Observatory (CTIO) in Chile. Table 1 summarizes the HIFOGS observations used in this work.
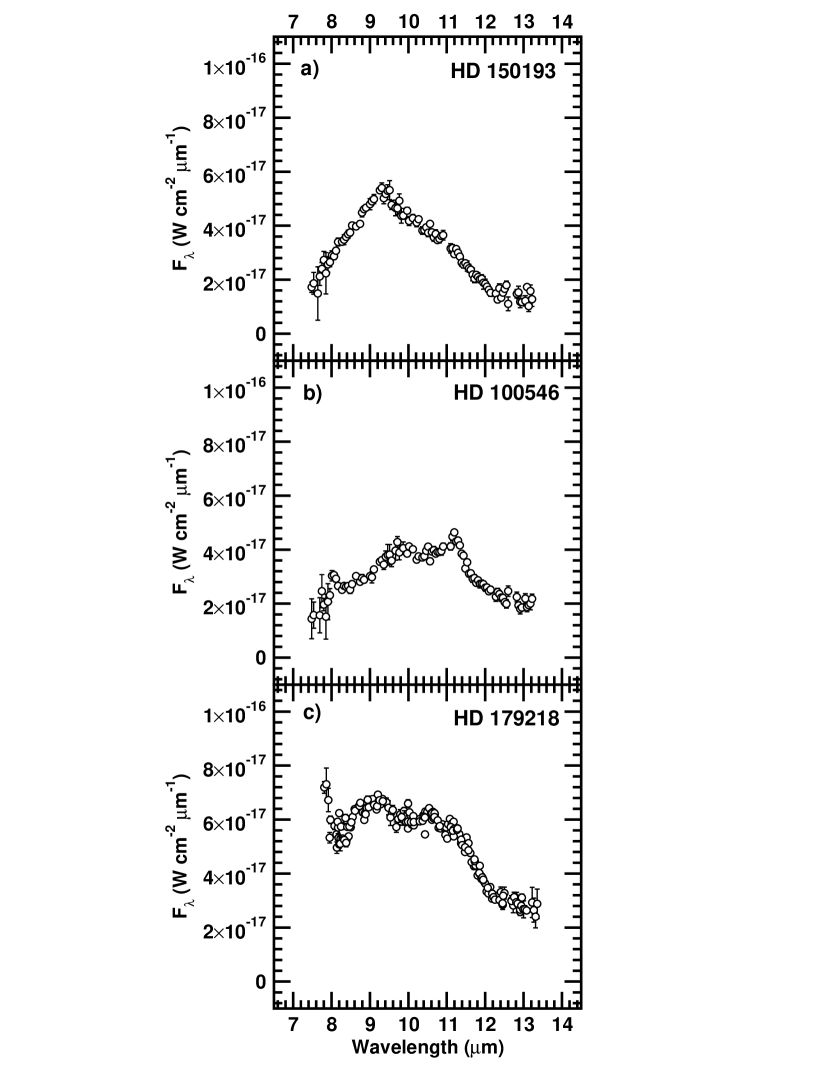
The HIFOGS is a grating spectrometer with a resolution of µm per detector, yielding a resolving power of covering the µm spectral region. A diameter circular entrance aperture was used for each observation at each observing facility. This aperture corresponds to a radial size of 448 AU, 309 AU, and 732 AU for HD 150193, HD 100546 and HD 179218, respectively. Standard IR observing techniques of chopping and nodding were employed, with a chop frequency of 7 Hz and with a chop throw of in the E-W direction. Absolute calibrated flux spectra of the standard stars used in the data reduction were taken from the UKIRT CGS 3 and HIFOGS measurements compiled by Cohen et al. (1996). Ratios of two or more measurements for each standard at different air masses were fitted to ratios of atmospheric transmissions (using ATRAN software, Lord (1993)), for a precipitable water vapor of 4.5 mm for both WIRO and CTIO to verify the wavelength calibration and the atmospheric transmission corrections as functions of airmass. Each HIFOGS spectrum was flux calibrated by dividing the measured spectrum by the standard star, multiplying by the corresponding star’s flux spectrum (Cohen et al., 1996), and multiplying by the inverse ratio of computed atmospheric transmission spectra. All observations presented here were obtained under photometric conditions. The spectra are shown in Fig. 1.
Complete Nyquist sampling of the 10 µm spectral signatures requires two HIFOGS grating settings. We were able to achieve Nyquist sampling for the object HD 179218. The other two objects, HD 150193 and HD 100546, were observed at a single grating setting. Observations of HD 179218 on 1998 June 23 UT, June 27 UT, and June 30 UT were obtained at the first grating setting that spanned µm. The 1998 June 24 UT and June 25 UT observations were obtained at a second grating setting that was shifted such that the wavelength interval of the detectors was half way between the wavelength interval of the detectors in the first grating setting. The second grating setting spanned a wavelength range of µm. The spectra from each observational epoch are shown in Fig. 1. Spectra for each grating setting were scaled to the spectrum obtained during the best photometric conditions (1998 June 23 UT and 1998 June 25 UT for the first and second grating settings, respectively) and combined by computing a statistically weighted average. The scaling factors for each spectrum are listed in Table 1. The resultant HIFOGS spectra for HD 179218 at each grating setting were subsequently interlaced to produce the final spectrum (spanning µm). Therefore, for HD 179218, there are approximately twice as many data points between 7.5 µm and 13.4 µm than for HD 100546 and HD 150193. No scaling factor was used to interlace the spectra from the two grating settings.
We also obtained 1.2 – 23.0 µm IR broad- and narrow-band photometric observations of HD 179218 on 2001 April 30.42 UT using the University of Minnesota (UM) Mount Lemmon Observing Facility (MLOF) 1.52 m telescope and the UM multi-filter bolometer (Hanner et al., 1990). Observations where conducted using 9.33″ circular aperture, a 29″ N-S nod, and a 7.5 Hz chop-frequency. In addition to standard near-IR broad-band filters, the bolometer filter set also included the six Infrared Telescope Facility (IRTF) narrow-band 7–13 µm “silicate” filters (Tokunaga et al., 1986). Multiple observations of the photometric standard star Boo (= HD 124897) at a variety of air masses during the night established the photometric zero point over the entire spectral range of the bolometer. The photometric systems, magnitude scales, and absolute flux calibrations for the bolometer are given by Mason et al. (2001) and Gehrz (1997a, b). Standard extinction values of 0.2 magnitudes per air mass (mag AM-1) were used for filters and 7.9–12.6 µm, 0.3 mag AM-1 for filter , and 0.5 mag am-1 at 18.3 µm. The use of standard extinction values introduces no more than a few percent uncertainty in the derived photometry, as observations of HD 179218 where obtained at air masses. Observed magnitudes corrected for atmospheric extinction, are summarized in Tables 2.
2.1 Assembly of Data Sets for SEDs
Data from the European Space Agency Infrared Space Observatory (ISO) Short-Wavelength Spectrometer (SWS) and the Infrared Astronomical Observatory (IRAS) are used to expand the wavelength coverage of the spectral energy distribution (SED) of each of our three HAEBEs. The ISO SWS observations were conducted using the SWS01 scanning mode (Astronomical Observing Template, referred to as AOTs) covering the entire 2.4 – 45 µm SWS wavelength range. Each object has been observed at a different scanning speed; in particular, data have been taken at “speed 4” (HD100546), “speed 3” (HD179218), and “speed 1” (HD150193), corresponding to raw resolution of approximately 1400, 800, and 400, respectively.
Since the HAEBEs were faint and the standard pipeline process did not adequately apply a dark subtraction to the data points, we have reprocessed the data from a raw level to a fully processed stage using the Observer’s Spectral Interactive Analysis Package (OSIA v2.0) and the ISO Spectral Analysis Package (ISAP v2.1). Each of the 12 bands into which the SWS01 is divided have been processed separately; dark current subtraction, scan direction matching and flat-fielding have been applied interactively to each band. Using ISAP, we sigma clipped outliers and averaged the data of all 12 detectors for each AOT band, retaining the instrument resolution. For those bands affected by fringes, we applied the defringe routines incorporated in ISAP.
For extended sources a flux discontinuity may occur between band limits as a consequence of a change in aperture size at some band edges. Our three objects show very little flux jumps at the detector band limits, and in most cases, we did not have to normalize the segments to their neighbors when we combined the 12 spectral segments into a single spectrum. For HD 179218 we use an additive term to normalize the last two segments ( µm) to the flux in the previous band. Since we have ISO SWS data from objects that have been taken at different scanning speeds and, consequently, have different resolutions, we have produced the final spectrum for each object rebinning the data to a bin size that corresponds to a spectral resolution of .
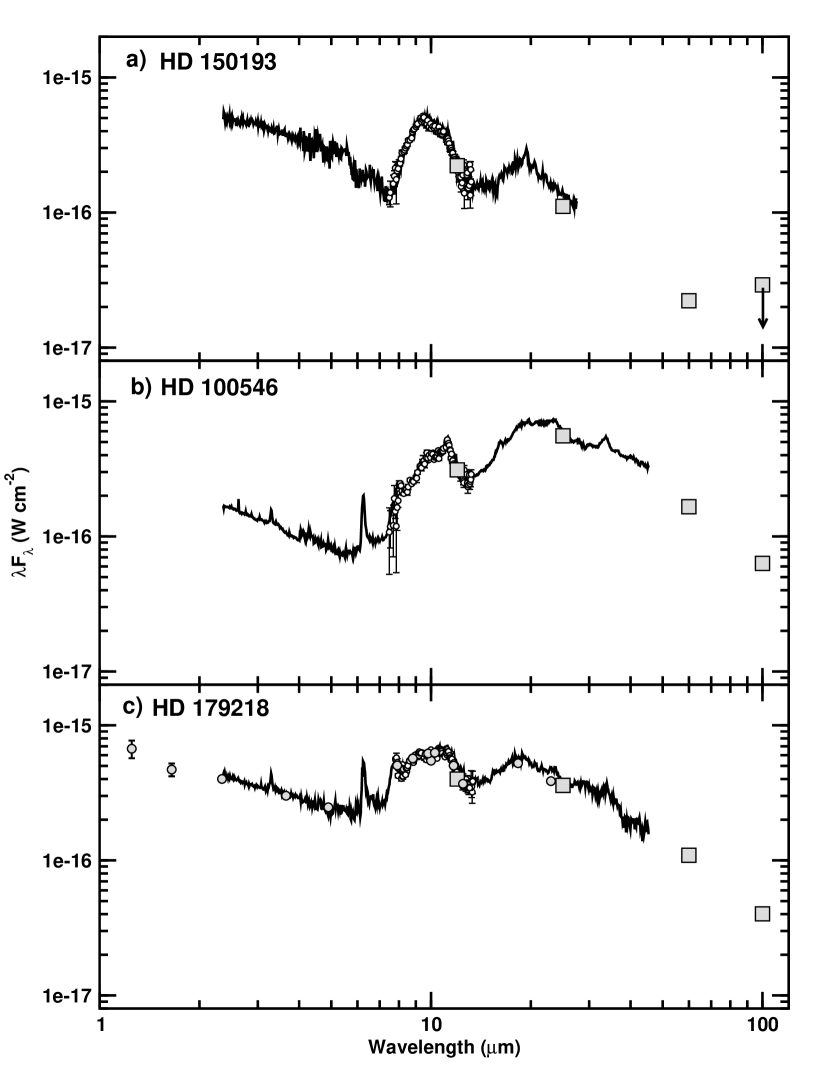
The ISO SWS spectra are scaled to the HIFOGS spectrophotometry using the following procedure: 1) the resolution of the ISO SWS spectrum is degraded to match the wavelength scale of the HIFOGS spectrum; 2) a scaling factor is calculated for each data point (approximately 30 points for HD 100546 and HD 150193, and 60 points for HD 179218) in the high S/N region between 8 and 10 µm; 3) a statistically weighted average of the scaling factors is computed; and 4) the averaged scaling factor is applied to the entire original, undegraded ISO SWS spectrum. The scaling factor of the ISO SWS spectra to the HIFOGS spectrophotometry for each object is listed in Table 3.
In addition to spectra from ISO SWS, we use IRAS flux values from Oudmaijer et al. (1992) for each of the three objects. We apply the method outlined in the IRAS Explanatory Supplement (1988) to produce color corrected, monochromatic flux points. We assume the IRAS fluxes are larger due to the larger IRAS aperture. First, the 12 µm IRAS data point is scaled to the HIFOGS spectrum. Then, the resulting scaling factor is applied to each of the other three IRAS data points (Table 3).
Finally, we added the IR photometric points from MLOF to the SED of HD 179218. The near-IR points were corrected for interstellar reddening by assuming the extinction law of Mathis (2000) and the published extinction for HD 179218 of . The scaling factor applied to the MLOF data to match the HIFOGS spectrum of HD 179218 is listed in Table 3. The final assembled SEDs for all three objects are shown in Fig. 2.
The factors needed to scale the ISO SWS data to the HIFOGS data arise due to a difference in aperture size and distance to the object. The effective aperture size of ISO SWS is 9.44″, and for HIFOGS is 3″. Based on millimeter studies, the diameter of the disk around HD 179218 is AU (Mannings & Sargent, 2000) and for HD 150193 is AU (Mannings & Sargent, 1997). The distance to HD 179218 (based on Hipparcos data) is 244 pc and for HD 150193 is 149 pc. This results in projected diameters of the ISO SWS and HIFOGS apertures on HD 179218 of 2302 AU and 732 AU. Similarly, the projected diameters on HD 150193 are 1409 AU and 448 AU. Therefore, the apertures contain the millimeter measured disk sizes resulting in ISO SWS to HIFOGS scaling factors close to 1 for these two objects. Conversely, the distance of HD 100546 is 103 pc yielding a projected aperture diameter from ISO SWS and HIFOGS as 973 AU and 309 AU, respectively. Although there are no millimeter measurements of HD100546, HST Chronographic Imaging reveals a disk approximately 760 – 1030 AU in diameter (Augereau, Lagrange, Mouillet, & Ménard, 2001), (Grady et al., 2001). Therefore, significant mid-IR flux may be contained in the ISO SWS aperture which would account for the comparatively large scaling factor needed to scale ISO SWS to HIFOGS for HD 100546.
3 Passive Disk Model
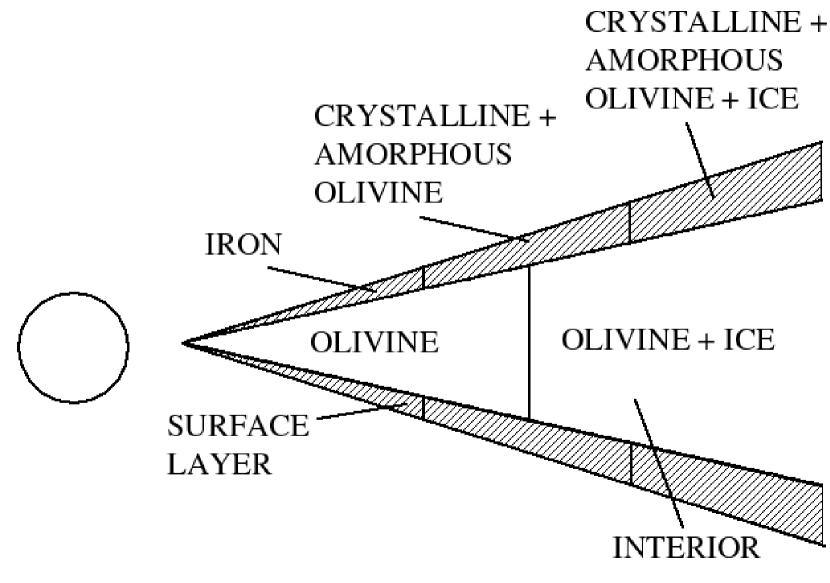
We use a modified version of the radiative, hydrostatic models of passively irradiated circumstellar disks developed Chiang & Goldreich (1997) (hereafter CG97) and updated by Chiang et al. (2001) (hereafter C01). The CG97 disk is composed of two parts: an optically thin surface layer and an optically thick interior (Fig. 3). The surface layer is directly heated by light from the central star. Half of the reprocessed emission from the surface layer escapes into space while the other half radiates onto the disk interior. The emission from the disk surface layer heats the cooler disk interior. Since the disk is in hydrostatic equilibrium, the disk flares with increasing distance from the central star. The amount of disk flaring is influenced by the temperature of the interior. Flaring of the disk results in more starlight hitting the disk at larger distances from the central star as compared to an otherwise geometrically flat disk. C01 updated the CG97 model by adding a range of grain sizes and incorporating a simple mineralogy through the use of laboratory determined optical constants, including water ice, amorphous olivine, and metallic Fe. Although the two-layered disk approach is simple, when compared to more detailed vertical structure models, the CG97 model was found to be a robust model for computing SEDs from HAEBEs (Dullemond, van Zadelhoff, & Natta, 2002).
In this work, we use the updated model of C01 with our own enhanced feature of adding Mg-pure crystalline olivine grains (forsterite) into the optically thin surface layer. We also are able to vary the crystalline-to-amorphous silicate ratio in the inner and outer radial regions of the disk. The details of the standard disk model are explained in CG97 and C01; however, we will highlight the disk and dust parameters here.
Disk parameters include the disk surface density at 1 AU (), the outer disk radius (), and the height of the disk photosphere in units of the gas scale height (). Dust grain parameters include grain mineralogy, slope of the grain size distribution (), maximum grain size (), and sublimation temperature (). The shape of the SED in the region covered by our data sets (2 – 45 µm) are largely unaffected by changes in the input parameters. The dust parameter which most affects the shape of the resonance features is the slope of the grain size distribution, (C01). Changes in disk radius, disk surface density, and maximum grain size for the interior and the surface layer mostly affect the shape of the SED at wavelengths longer than 50 µm (C01; Creech-Eakman et al. 2002). The one disk parameter that produces the most change at wavelengths less than 50 µm is , which can be used as a measure of dust settling in the disk (C01). However, as noted in C01, is not a fixed parameter and should be calculated self-consistently at each radius in the disk. We follow the procedure of C01 by keeping constant throughout the disk and using it as an indicator of dust settling in the disk. Another unknown parameter expressed in terms of may actually represent the settling of dust in the disk. Finally, the relative mass fraction of the minerals in the disk and surface layer will influence the SED in the mid-IR.
To model the emission from dust particles, we use the method of C01 and assume that the disk is composed of a size distribution of isolated spherical grains of discrete mineralogy; i.e., we ignore gas as a source of opacity. The specific mineralogy is addressed in the next section (§3.1). The opacity of the grains is computed by using Mie Theory. For grains coated with a water ice mantle, Mie-Güttler Theory is used to compute the opacity. The grain size distribution in the disk surface layer and in the disk interior are equal, and unchanged in each of our models. The central stars are modeled as simple blackbodies. The radius, temperature, and luminosity of the central stars of our three objects are taken from the compilation by van den Ancker et al. (1998). We use the luminosity to calculate the radius of each of the stars using the relation: .
Two final assumptions are made when using the C01 model. The first is that we are viewing the disk face-on. The stars discussed here have low Av ( for HD 100546; for HD 179218; and for HD 150193), therefore, the disk is not inclined at such an angle as to significantly block the starlight. CG99 showed that until the disk is inclined at such an angle as to block the starlight (), the SED is mostly unaffected by disk inclination. Therefore, we use the approximation that the disks are face on for all three of our objects. The second assumption is that any accretion in these systems is negligible and does not significantly contribute to the measured emission from these systems. By making such an assumption, we are placing an upper limit on the contribution of flux from the disk alone on the measured emission from each of these systems.
Flux from the central star, disk interior and disk surface are co-added to produce the model SED. The relative amount of amorphous to crystalline silicates in the disk surface layer is adjusted to produce the best fit within a (95% confidence) level (Press et al., 1992).
3.1 Dust Mineralogy
The mineralogy used by C01 is a good representation of the basic minerals extant in young disk systems (Malfait et al., 1998; Bouwman et al., 2000). We maintain the mineralogy of C01, using amorphous olivine, metallic Fe, and water ice. However, we have expanded the mineralogy by including Mg-pure crystalline olivine grains in the disk surface layer. Crystalline olivine has been discovered to be a very important component of the dust in circumstellar disks and solar system comets. In an attempt to quantify the amount of crystalline olivine grains, we make this important step of including them in the C01 passive disk model. Table 5 lists the minerals used in the modeling and the reference for the indices of refraction.
It is difficult to model the thermal emission from crystalline silicate grains (Yanamandra-Fisher & Hanner, 1999). Many authors choose to use a form of a continuous distribution of ellipsoids while others use direct comparisons from laboratory transmission experiments. In this work, we choose to use the methods outlined by Fabian et al. (2001) who calculate the emission from ellipsoids by elongating the crystals along one of the three crystalline axes. Based on the location of the resonance peaks in the HIFOGS and ISO SWS spectra of HD 150193 and HD 179218, we use an axis ratio of 10:1:1 to compute the optical efficiencies (Qs) of the crystals. The crystalline olivines are not coated with ice since to do so requires mixing theory which eliminates the distinctive crystalline resonances. We compute the thermal emission from the crystals in the disk surface layer of each object. We make the simplified assumption that the crystals are at all radii in the disk surface layer. This assumption may not be valid since ice should coat the crystals out at larger disk radii. However, the measured crystalline resonances seem to originate from bare crystalline grains. Finally, we vary the ratio of amorphous to crystalline silicates to find the best model fit to the SEDs.
We note that in addition to solid-state emission features from silicates, HD 100546 and HD 179218 exhibit emission from polycyclic aromatic hydrocarbons (PAHs) (Meeus et al., 2001). We do not attempt to model the emission from these molecules here, but will examine them in a future paper.
4 RESULTS
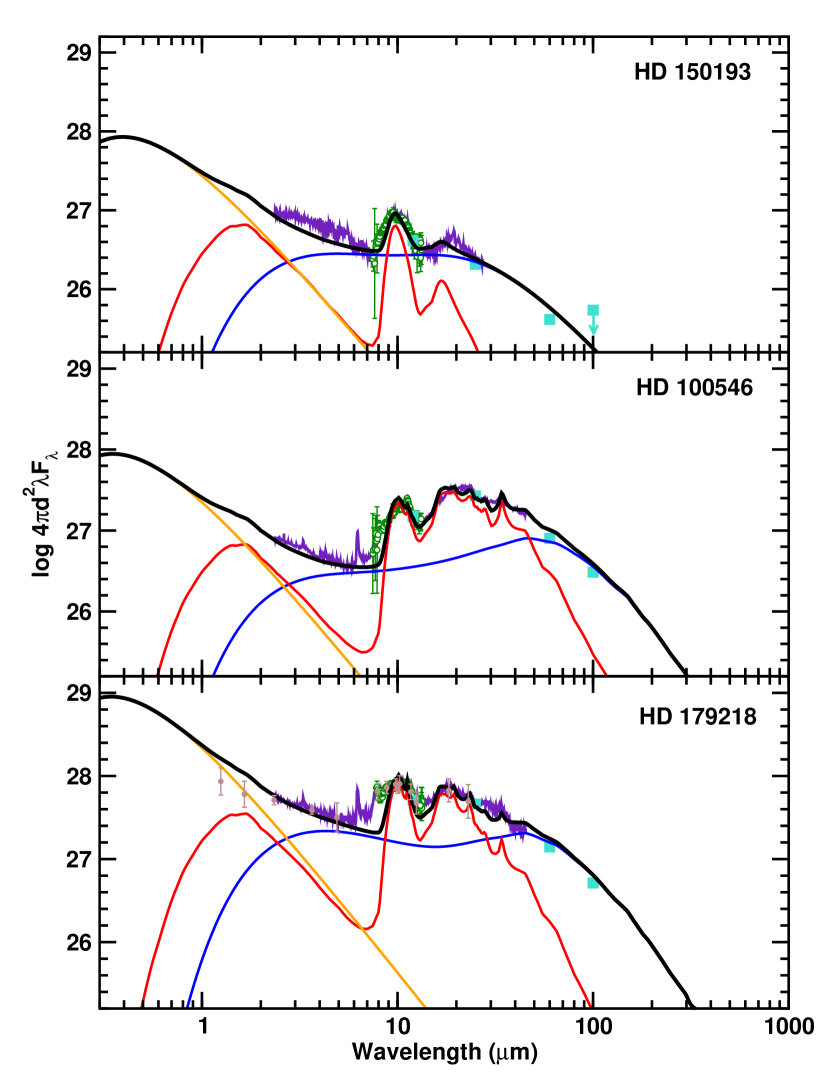
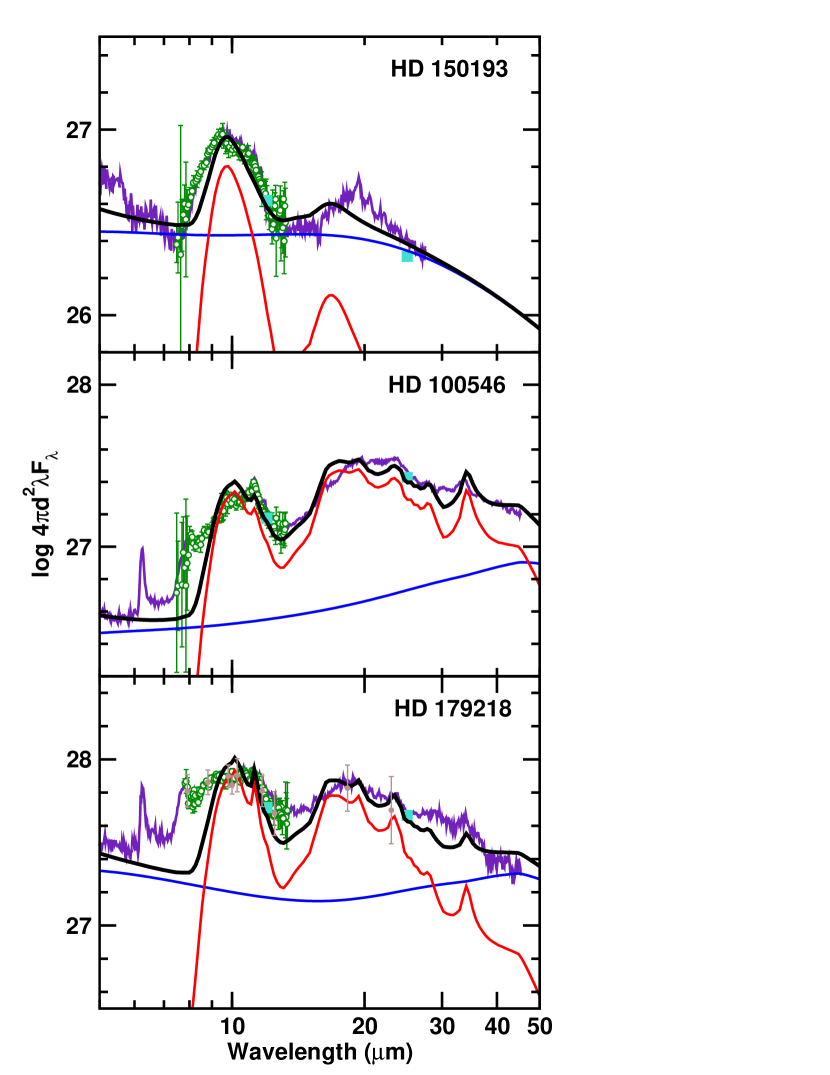
Our modeling results are displayed in Figs. 4 and 5 and summarized in Table 6. To produce the best-fit model to the SEDs, HD 100546 and HD 179218 are both modeled with a disk 150 AU in radius, while HD 150193 is modeled with a disk 5 AU in radius. The best fit SEDs for HD 100546 uses a scale height of , a scale height of for HD 150193, and a scale height of for HD 179218. This means that at a radius of 5 AU the disk around HD 100546 flares about 80% more than the disk around HD 179218, and about 25% more than the disk around HD 150193. The current model fits suggests that the measured emission from HD 150193 is dominated by warm dust in a flaring disk close to the central star, and that the emission from grains in an extended disk ( AU) are relatively small compared to the other two objects. We should note that for HD 150193, a larger disk of radius 50 AU with a scale height of can be used to match the contrast of the measured silicate resonance features in HD 150193, but the calculated flux at longer wavelengths exceeds the measured IRAS data point at 60 µm by a factor of 4. Therefore, we are able to match the long wavelength photometry and the contrast of the silicate resonance features by reducing the radius of the disk and increasing the scale height.
The qualitative crystalline content of these three HAEBEs has previously been reported by Meeus et al. (2001) with HD 100546 and HD 179218 showing evidence of crystalline silicates, while the emission from HD 150193 is dominated by amorphous silicates. For the two objects with crystalline silicates, we find that a better fit is produced to the observed SEDs of the objects if we use a model in which a higher ratio of crystalline-to-amorphous silicates is located in the inner regions of the disk ( AU) compared to the outer regions of the disk (5 – 150 AU). The inner region of HD 100546 has 37% higher crystalline-to-amorphous silicate ratio compared to the outer region. This is contrary to the findings of (Bouwman, de Koter, Dominik, & Waters, 2003) (hereafter, BdKDW) who used a spherical shell model to calculate a factor of almost 10 higher fraction of crystalline silicates in regions greater than 10 AU. The inner region of HD 179218 has 84% higher crystalline-to-amorphous silicate ratio compared to the outer region. Our model results are consistent with the recent findings of van Boekel et al. (2004). van Boekel et al. (2004) observed three Herbig Ae stars (HD 142527, HD 163296, and HD 144432) using the Mid-Infrared Interferometric Instrument on the Very Large Telescope Interferometer. In all three of their objects, they found evidence for a larger fraction of crystalline silicates in closer to the star (1 – 2 AU) compared to the outer region of the disk (2 – 20 AU).
Finally, all three of our objects are best fit using a grain size distribution with a slope of for both the optically thick inner disk and for the optically thin surface layer.
5 DISCUSSION
It is difficult to make any statistically significant conclusions about disk evolution from modeling only three objects. However, we can make some interesting observations based on our results. Meeus et al. (2001) defined two groups of Herbig Ae/Be stars based on the shape of their SEDs. Group I objects exhibit near-IR and far-infrared (far-IR) emission, with and without silicate emission features (denoted Groups Ia and Ib, respectively). Group II objects exhibit near-IR emission and silicate emission features, but much less far-IR emission compared to the objects in Group I. HD 179218 and HD 100546 are considered Group Ia objects and HD 150193 is considered a Group II object under this scenario (Meeus et al., 2001).
Meeus et al. (2001) suggest a disk geometry interpretation of their groupings. Group I objects have a geometrically thin, optically thin inner region with a flaring outer region. Group II objects contain an optically thick inner region which puffs up, shielding the optically thin, low mass, outer disk region from stellar flux, thereby preventing it from flaring. Qualitatively our modeling results match these groupings. HD 150193 is modeled with a relatively small (5 AU), low mass disk, which suppresses the amount of emission from ice coated silicate grains contributing to the emission around 45 µm. HD 179218 and HD 100546 are modeled with relatively large disks. HD 100546 is modeled with a disk that flares more than that of HD 150193 and HD 179218. We find it interesting that the disk of HD 179218 flares less than the disk of HD 100546, even though the two are both Group I sources. At least on the quantitative level, the two disks differ.
Although our model fits show no evidence for grain growth (all three SEDs are modeled with the same grain size distribution) there is a difference in the radial distribution of crystalline silicates. A possible evolutionary scenario is one in which when circumstellar disks form around young stars, they are thought to be primarly composed of amorphous ISM grains (Wooden, Woodward, & Harker, 2004). As the disk evolves, crystalline silicates are condensed (Grossman, 1972) or annealed (Rietmeijer et al., 2002) in the inner radial regions of the disk, either through heating (Brocklée-Morvan et al., 2002) or through shocks in the disk (Harker & Desch, 2002). The crystals are then transported to the outer regions of the disk (Cuzzi, Dobrovolskis, & Champney, 1993). Therefore, from this scenario, we can conclude that the disk around HD150193 is the least evolved since it does not contain any crystals. This is followed by HD179218 which has a large crystalline-to-amorphous in the inner radial region compared to the outer radial region. Finally, this is followed by HD100546 which has a slightly lower crystalline-to-amorphous silicate ratio at inner disk radii and a larger ratio at large disk radii compared to HD179218. Such a scenario is supported by the findings of van Boekel et al. (2003) who find that the shape and strength (band over continuum) of the 10 µm silicate feature are correlated. Strong features (from small grains) show mostly amorphous type silicate grains, while weaker, flatter features show evidence of crystalline silicates (grain processing).
It should be noted that there may be evidence of grain growth in both HD 179218 and HD 100546 as evidenced by the flatness of their 10 µm silicate features. We have not been able to adequately model “by eye” the shape of the feature with the current model. Attempts to use a more shallow grain size distribution and/or truncate the lower end of the grain sizes did not result in better fits (either by eye, or statistically) to the 10 µm feature. A more diverse mineralogy combined with a radially varying grain size distribution may improve the fits to the 10 µm spectral feature. However, such models are beyond the scope of this paper.
5.1 Comparison with Other Modeling Efforts
Other authors have modeled the three objects presented here. As stated earlier, BdKDW modeled the SED of HD 100546 using a optically thin spherically symmetric dust distribution (i.e., no optically thick disk component). BdKDW find that the the amount of crystals used to fit the SED increased with radial distance from the star. This contrasts with our model which shows that there needs to be a higher crystalline-to-amorphous silicate ratio in closer to the star, in agreement with radial mixing models. BdKDW also finds that HD 100546 has a large, flaring disk, consistent with our model results.
Dominik et al. (2003), using another variation of the CG97 model (Dullemond, Dominik, & Natta, 2001) (hereafter DDN), used a simple mineralogy of grains 0.1 µm in size. They modeled HD 150193 with a disk smaller than that of the other two and found that the emission feature in HD 100546 is best fit with larger sized grains than the other two objects. While we can not conclusively make a quantitative statement about the grain size in HD 100546, our results are qualitatively similar with Dominik et al. (2003) for HD 150193. However, there are some important differences between our model results and those of Dominik et al. (2003). They find that their fits for these three objects are best when the surface density increases with distance from the star (instead of decreasing as we have assumed here). They interpret these results as evidence for a “gap” in their disks, possibly produced by a planet or other large body. We do not find such evidence for an increasing surface density in our model calculations. Furthermore, based on DDN, it is extremely difficult to disentangle the degeneracy of the DDN model when simultaneously varying the surface density, the slope of the surface density with stellar distance, and the radial size of the disk. Therefore, while both of our results are intriguing, it underlines the need (as pointed out in Dominik) for high spatial resolution imaging of these objects in the mid-IR to resolve these modeling differences.
6 CONCLUSIONS
In this paper we constructed mid-IR SEDs of three Herbig Ae/Be stars using data from the HIFOGS, ISO SWS, IRAS, and MLOF photometry. We modeled the SEDs using the simple two-layer radiative transfer disk model of CG97 and C01 with the added feature of calculating the emission from Mg-pure crystalline olivine grains. Our findings are highlighted as follows:
1) HD 150193 has thermal emission arising from a relatively small ( AU in radius) flared () disk.
2) HD 179218 has thermal emission arising from a large ( AU in radius) less flared () disk.
3) HD 100546 has thermal emission arising from a large ( AU in radius) more flared () disk. At 5 AU, the disk around HD 100546 flares 80% more than the disk around HD 179218 and 25% more than HD 150193.
4) All three objects were modeled using a power law grain size distribution with a slope of for both the optically thick inner region and the optically thin surface layer.
5) HD 150193 shows no evidence of emission from crystalline silicates while HD 179218 and HD 100546 both show emission from Mg-rich crystalline olivine grains.
6) The SED of HD 179218 was best fit using a crystalline-to-amorphous ratio 84% larger in the inner radial regions of the disk ( AU) compared to the outer regions.
7) The SED of HD 100546 was best fit using a crystalline-to-amorphous ratio 37% larger in the inner radial regions of the disk ( AU) compared to the outer regions.
In circumstellar disks, grain growth and crystallization may require both sufficient disk mass (i.e., size) and scale height. Scale height may be a signature of turbulent movement in the disk which could aid grain growth and transport (Cuzzi, Dobrovolskis, & Champney, 1993). More disks need to be fitted with similar model structures to increase the sample to make more sense of the links between grain properties and disk structure.
References
- Augereau, Lagrange, Mouillet, & Ménard (2001) Augereau, J. C., Lagrange, A. M., Mouillet, D., & Ménard, F. 2001, A&A, 365, 78
- Bell et al. (2000) Bell, K.R., Cassen, P.M., Wasson, J.T., Woolum, D.S. 2000, in Protostars and Planets IV, ed. V. Mannings, A.P. Boss, & S.S. Russell, University of Arizona Press, Tucson, 897
- Bouwman, de Koter, Dominik, & Waters (2003) Bouwman, J., de Koter, A., Dominik, C., & Waters, L. B. F. M. 2003, A&A, 401, 577
- Bouwman et al. (2000) Bouwman, J., de Koter, A., van den Ancker, M. E., & Waters, L. B. F. M. 2000, A&A, 360, 213
- Brocklée-Morvan et al. (2002) Bockelée-Morvan, D., Gautier, D., Hersant, F., Huré, J.-M., & Robert, F. 2002, A&A, 384, 1107
- Brownlee et al. (2000) Brownlee, D.E., Joswiak, D.J., Bradley, J.P., Gezo, J.C., Hill, H.G.M. 2000, Lunar Planet. Inst. 31, Abs. No. 1921
- Chiang & Goldreich (1997) Chiang, E.I. & Goldreich, P. 1997, ApJ, 490, 368 (CG97)
- Chiang et al. (2001) Chiang, E.I., Joung, M.K., Creech-Eakman, M.J., Qi, C., Kessler, J.E., Blake, G.A., van Dishoeck, E.F. 2001, ApJ, 547, 1077 (C01)
- Cohen et al. (1996) Cohen, M., Witteborn, F.C., Carbon, D.F., Davies, J.K., Wooden, D.H., & Bregman, J.D. 1996, AJ, 112, 2274
- Crifo et al. (1997) Crifo, F., Vidal-Madjar, A., Lallement, R., Ferlet, R., & Gerbaldi, M. 1997, A&A, 320, L29
- Cuzzi, Dobrovolskis, & Champney (1993) Cuzzi, J. N., Dobrovolskis, A. R., & Champney, J. M. 1993, Icarus, 106, 102
- Dominik et al. (2003) Dominik, C., Dullemond, C. P., Waters, L. B. F. M., & Walch, S. 2003, A&A, 398, 607
- Dorschner et al. (1995) Dorschner, J., Begemann, B., Henning, T., Jaeger, C., & Mutschke, H. 1995, A&A, 300, 503
- Dullemond, Dominik, & Natta (2001) Dullemond, C. P., Dominik, C., & Natta, A. 2001, ApJ, 560, 957
- Dullemond, van Zadelhoff, & Natta (2002) Dullemond, C.P., van Zadelhoff, G.J., & Natta, A. 2002, A&A, 389, 464
- Fabian et al. (2001) Fabian, D., Henning, T., Jäger, C., Mutschke, H., Dorschner, J., Wehrhan, O. 2001, A&A, 378, 228
- Gehrz (1997a) Gehrz, R. D. 1997a, in The International Comet Quarterly, ed. D. W. E. Green, April 1997
- Gehrz (1997b) Gehrz, R. D. 1997b, in The International Comet Quarterly Guide to Observing Comets, ed. D. W. E. Green, (Cambridge: Smithsonian Astrophysical Observatory), p117
- Grady et al. (2001) Grady, C. A., et al. 2001, AJ, 122, 3396
- Grossman (1972) Grossman, L. 1972, Geochim. Cosmochim. Acta, 36, 597
- Habing et al. (1999) Habing, H.J., et al. 1999, Nature, 401, 456
- Hanner et al. (1990) Hanner, M. S., Newburn, R. L., Gehrz, R. D., Harrison, T. E., Ney, E. P., & Hayward, T. L. 1990, ApJ, 348, 312
- Harker & Desch (2002) Harker, D. E. & Desch, S. J. 2002, ApJ, 565, L109
- IRAS (1988) IRAS, The Explanatory Supplement, 1988, US Government Publication Office
- Jager et al. (1998) Jaeger, C., Molster, F. J., Dorschner, J., Henning, T., Mutschke, H., & Waters, L. B. F. M. 1998, A&A, 339, 904
- Koerner (2001) Koerner, D. W. 2001, ASP Conf. Ser. 231: Tetons 4: Galactic Structure, Stars and the Interstellar Medium, eds. C.E. Woodward and M.D. Bicay [ASP: San Fransico], 563
- Li & Greenberg (1997) Li, A. & Greenberg, J. M. 1997, A&A, 323, 566
- Lord (1993) Lord, S. D. 1993, NASA Technical Report TM–103957, (Moffett Field: NASA/Ames Research Center)
- Malfait et al. (1998) Malfait, K., Waelkens, C., Waters, L. B. F. M., Vandenbussche, B., Huygen, E., de Graauw, M. S. 1998, A&A, 332, L25
- Mannings & Sargent (1997) Mannings, V. & Sargent, A.I. 1997, ApJ, 490, 792
- Mannings & Sargent (2000) Mannings, V. & Sargent, A.I. 2000, ApJ, 529, 391
- Mason et al. (2001) Mason, C. G., Gehrz, R. D., Jones, T. J., Woodward, C. E., Hanner, M. S., & Williams, D. M. 2001, ApJ, 549, 635
- Mathis (2000) Mathis, J. S. 2000, J. Geophys. Res., 105, 10269
- Meeus et al. (2001) Meeus, G., Waters, L. B. F. M., Bouwman, J., van den Ancker, M. E., Waelkens, C., Malfait, K. 2001, A&A, 365, 476
- Oudmaijer et al. (1992) Oudmaijer, R. D., van der Veen, W. E. C. J., Waters, L. B. F. M., Trams, N. R., Waelkens, C., & Engelsman, E. 1992, A&AS, 96, 625
- Pantin, Lagage, & Artymowicz (1997) Pantin, E., Lagage, P.O., & Atrymowicz, P. 1997, A&A, 372, 1123
- Pollack et al. (1994) Pollack, J. B., Hollenbach, D., Beckwith, S., Simonelli, D. P., Roush, T., & Fong, W. 1994, ApJ, 421, 615
- Press et al. (1992) Press, W.H., Teukolsky, S.A., Vetterling, W.T., & Flannery, B.P. 1992, Numerical Recipes (Cambridge Univ. Press)
- Rietmeijer et al. (2002) Rietmeijer, F. J. M., Hallenbeck, S. L., Nuth, J. A., & Karner, J. M. 2002, Icarus, 156, 269
- Tokunaga et al. (1986) Tokunaga, A. T., Golisch, W. P., Griep, D. M., Kaminski, C. D., & Hanner, M. S. 1986, AJ, 92, 1183
- van Boekel et al. (2004) van Boekel, R., et al. 2004, Nature, 432, 479
- van Boekel et al. (2003) van Boekel, R., Waters, L. B. F. M., Dominik, C., Bouwman, J., de Koter, A., Dullemond, C. P., & Paresce, F. 2003, A&A, 400, L21
- van den Ancker et al. (1998) van den Ancker, M.E., de Winter, D., Tjin A Djie, H.R.E. 1998, A&A, 330, 145
- Waters & Waelkens (1998) Waters, L.B.F.M. & Waelkens, C. 1998, ARA&A, 36, 233
- Witteborn et al. (1991) Witteborn, F.C., Bregman, J.D., Rank, D.M., & Cohen, M. 1991, in Proc. of the 1991 North American Workshop on Infrared Spectroscopy, ed. R.E. Stencel (Univ. Colorado Press: Boulder], 29
- Wooden, Woodward, & Harker (2004) Wooden, D. H., Woodward, C. E., & Harker, D. E. 2004, ApJ, 612, L77
- Wooden et al. (2000a) Wooden, D.H., Butner, H.M., Harker, D.E., & Woodward, C.E. 2000a, Icarus, 143, 126
- Wooden, Harker, & Woodward (2000b) Wooden, D. H., Harker, D. E., & Woodward, C. E. 2000b, ASP Conf. Ser. 196: Thermal Emission Spectroscopy and Analysis of Dust, Disks, and Regoliths, Eds. A. Sprague and M. Sitko, [ASP: San Fransico], 99
- Yanamandra-Fisher & Hanner (1999) Yanamandra-Fisher, P., & Hanner, M. S. 1999, Icarus, 138, 107
| UT | UT Time | Integ. | Airmass | Flux | Airmass of | Scaling | |
|---|---|---|---|---|---|---|---|
| Object | Date | (hr:min) | (min) | Range | Standard | Standard | Factor |
| (1) | (2) | (3) | (4) | (5) | (6) | (7) | (8) |
| HD 150193 | 2000 May 13aa Wavelength range: µm | 05:30 – 06:10 | 20 | 1.00 – 1.01 | Cru | 1.46 | |
| HD 100546 | 2000 May 13aa Wavelength range: µm | 04:15 – 05:15 | 32 | 1.51 – 1.67 | Cru | 1.46 | |
| HD 179218 | 1998 June 23bb Wavelength range: µm | 07:03 – 07:23 | 8 | 1.15 – 1.11 | Her | 1.14 | 1.0 |
| HD 179218 | 1998 June 24bb Wavelength range: µm | 07:32 – 08:10 | 16 | 1.11 – 1.12 | Boo | 1.63 | 0.93 |
| HD 179218 | 1998 June 25bb Wavelength range: µm | 08:56 – 09:16 | 8 | 1.13 – 1.16 | Peg | 1.17 | 1.0 |
| HD 179218 | 1998 June 27cc Wavelength range: µm | 07:52 – 08:00 | 4 | 1.11 – 1.11 | Her | 1.18 | 0.92 |
| HD 179218 | 1998 June 30cc Wavelength range: µm | 05:24 – 06:00 | 16 | 1.29 – 1.19 | Her | 1.13 | 1.21 |
| Filter | Observed | Flux at Zero |
|---|---|---|
| Wavelength | Magnitude | Magnitude |
| (µm) | (W cm-2 µm-1) | |
| 1.25 | ||
| 1.65 | ||
| 2.34 | ||
| 3.65 | ||
| 4.90 | ||
| 10.00 | ||
| 7.91 | ||
| 8.81 | ||
| 9.80 | ||
| 10.27 | ||
| 11.70 | ||
| 12.49 | ||
| 18.30 | ||
| 23.00 |
| Object | ISO SWS | IRAS | MLOF |
|---|---|---|---|
| (1) | (2) | (3) | (4) |
| HD 150193 | 0.90 | 0.62 | |
| HD 100546 | 0.23 | 0.22 | |
| HD 179218 | 1.08 | 0.78 | 1.0 |
| Observed, | ||
|---|---|---|
| Parameter | Definition | Fixed or Varied |
| (1) | (2) | (3) |
| stellar mass | observed aa van den Ancker et al. (1998) | |
| stellar radius | observed aa van den Ancker et al. (1998) | |
| (K) | stellar temperature | observed aa van den Ancker et al. (1998) |
| (g cm-2) | surface density at 1 AU | fixed at 1000 |
| (AU) | outer disk radius | varied |
| visible photospheric height/gas scale height | varied | |
| slope of grain size distribution interior/surface | varied | |
| (µm) | maximum grain radius in surface | fixed at 1 |
| (µm) | maximum grain radius in interior | fixed at 1000 |
| (K) | iron sublimation temperature | fixed at 2000 |
| (K) | olivine sublimation temperature | fixed at 1500 |
| (K) | H2O ice sublimation temperature | fixed at 150 |
| Dust Type | Reference |
|---|---|
| (1) | (2) |
| Amorphous Olivine | Dorschner et al. (1995) |
| Metallic Iron | Pollack et al. (1994) |
| Water Ice | Warren (1984) |
| Mg-pure Crystalline Olivine | Jäger et al. (1998) |
| Object | aa crystalline-to-amorphous silicate ratio for inner disk ( AU). | bb crystalline-to-amorphous silicate ratio for outer disk (5 – 150 AU). | cc Disk mass (gas and dust) and maximum aspect ratio of the fitted disk are derived, not fitted or input, parameters. | cc Disk mass (gas and dust) and maximum aspect ratio of the fitted disk are derived, not fitted or input, parameters. | ||||||
|---|---|---|---|---|---|---|---|---|---|---|
| (K) | (AU) | |||||||||
| (1) | (2) | (3) | (4) | (5) | (6) | (7) | (8) | (9) | (10) | (11) |
| HD 150193 | 2.3 | 2.1 | 9333 | 5 | 3 | 3.5 | 0.003 | 0.11 | ||
| HD 100546 | 2.5 | 1.7 | 10471 | 150 | 4 | 2.5 | 0.43 | 0.27 | 0.024 | 0.42 |
| HD 179218 | 4.3 | 5.2 | 10700 | 150 | 1 | 3.5 | 0.49 | 0.08 | 0.024 | 0.09 |