CCD uvby photometry of the young open cluster NGC 663
Abstract
NGC 663 is a young, moderately rich open cluster, known to contain one of the largest fractions of Be stars among all galactic clusters. In this work we present CCD photometry for stars in its central area. We have used these data to obtain the main cluster physical parameters. We find that the reddening is highly variable, with values ranging from in the central part to in the south-east. The distance modulus is found to be mag. (2.1 Kpc), and the age years ( Myr). The age obtained is consistent with the interpretation of the Be phenomenon as an evolutionary effect.
keywords:
techniques: photometric – stars: emission-line, Be – Hertzsprung–Russell (HR) diagram – open clusters and associations: individual: NGC 663.1 Introduction
The precise determination of the main physical parameters of galactic open clusters plays a central role in the study of the stellar structure and evolution. With accurate photometric data, and once the external variables such as reddening are corrected for, the cluster distances, ages and chemical abundances can be inferred from the study of the photometric colour-magnitude and colour-colour diagrams.
This work is part of a programme aimed to produce accurate and homogeneous dating for a sample of young galactic clusters by means of CCD Strömgren photometry. The use of isochrone fitting in the plane of the photometric system is an adequate tool to obtain accurate cluster ages. The range of variation of the index along the B-type sequence amounts to more than one mag., being significantly larger than most commonly used photometric colours. Moreover, the index is less affected by reddening, and allows an efficient segregation of emission-line stars.
NGC 663 is a moderately rich open cluster in Cassiopeia, located in the Perseus galactic arm. It is thought to be the core of the Cas OB8 association. A remarkable characteristic is that it contains one of the largest fractions of Be stars among all galactic clusters. More than 30 Be stars have been detected so far among its B star sequence, and at least 30 per cent of all early B cluster members are known to be Be stars (Sanduleak, 1979, 1990; Pigulski, Kopacki & Kolaczkowski, Pigulski et al.2001a).
The accurate age determination of clusters with a high Be star content is a key element of the on-going discussion about the evolutionary status of Be stars. Fabregat & Torrejón (2000) proposed that the Be phenomenon is an evolutionary effect which appears at the end of the B stars main sequence lifetime. The main argument in favour of this hypothesis is their preliminary finding, based on an inhomogeneous set of age determinations from the literature, that clusters with high Be star content have ages in the interval 13–25 Myr, while no – or very few – Be stars are found in clusters younger than 10 Myr. Hence, the accurate determination of the age of NGC 663 is an important issue in this discussion.
NGC 663 has been the subject of many photometric studies in the past. Photoelectric photometry was obtained by Hoag et al. (1961), McCuskey & Houk (1964) and van den Bergh & de Roux (1978). Strömgren and Crawford–Barnes H photometry was presented by Tapia et al. (1991) and Fabregat et al. (1996). The former also obtained infrared photometry. Recent studies based on CCD photometry in the Johnson and Cousins systems include those of Phelps & Janes (1994) and Pigulski, Kopacki & Kolaczkowski (Pigulski et al.2001a, Pigulski et al.2001b). Photometric H surveys aimed to detect new Be stars have been conducted by Capilla, Fabregat & Baines (2000) and (Pigulski et al.2001a).
The cluster physical parameters determined in the above studies show an important dispersion. A reason for this could be the strongly variable reddening across the cluster area (e.g. van den Bergh & de Roux 1978) which makes the determination of the intrinsic magnitudes and colours more difficult. The published distance moduli range from 11.4 mag. (1.9 Kpc, McCuskey & Houk 1964) to 12.25 mag. (2.8 Kpc, Phelps & Janes 1994). The determined ages range from 9 Myr. (Tapia et al., 1991) to 20–25 Myr. (, Pigulski et al.2001a).
In this work we present CCD photometry for stars in the central area of NGC 663 and a precise determination of the cluster main physical parameters. A detailed study of the cluster Be star population will be presented in a forthcoming paper.
2 The data
CCD photometry of NGC 663 was obtained on the nights 20 to 22 November 1998 at the 1.52-m. telescope of the Observatorio Astronómico Nacional, located at the Calar Alto Observatory (Almería, Spain). The chip employed was the Tektronics TK 1024 AB, with a size of 1024 x 1024 pixels. The 04 unbinned pixels provide a field size of 69 x 69. Two slightly overlapping fields near the cluster centre were observed to cover the cluster central region.
Observations were done through the four Strömgren and Crawford narrow and wide H filters, every field being sequentially measured through the six filters. Three different exposure times were used with each filter, in order to ensure a wide range of stellar magnitudes. Exposure times in each filter were selected so that a B type star produces approximately equal count rates through all filters. Employed exposure times are presented in Table 1. The list of all observations is presented in Table 2.
| Filter | short | medium | large |
|---|---|---|---|
| 10 | 50 | 200 | |
| 12 | 60 | 240 | |
| 35 | 175 | 700 | |
| 120 | 600 | 21200 | |
| H | 12 | 60 | 240 |
| H | 30 | 150 | 600 |
| JD | date | airmass | exposure |
|---|---|---|---|
| 2 451 138 | 20-11-98 | 1.26 | short |
| 2 451 138 | 20-11-98 | 1.40 | long |
| 2 451 139 | 21-11-98 | 1.28 | short |
| 2 451 139 | 21-11-98 | 1.46 | long |
| 2 451 140 | 22-11-98 | 1.15 | short |
| 2 451 140 | 22-11-98 | 1.17 | long |
| 2 451 140 | 22-11-98 | 1.45 | medium |
| 2 451 140 | 22-11-98 | 1.56 | medium |
During the same observing run we also obtained photometry of the clusters & Persei, which has been published elsewhere (Capilla & Fabregat 2002, hereafter referred to as CF02). A detailed description of the image processing procedures, atmospheric extinction calculation and standard transformations is given in CF02. The accuracy of the standard photometry is 0.023, 0.014, 0.017, 0.017 and 0.021 mag. in , , , and respectively. In CF02 it is also shown that our photometry is well tied to the standard system and free of systematic effects.
Astronomical coordinates for all observed stars were derived from the instrumental pixel coordinates by using 26 stars from the Tycho 2 Catalogue (Høg et al., 2000) included in the observed fields. Transformation equations were computed by means of the Starlink program ASTROM (Wallace, 1998). The final astrometric accuracy, measured as the RMS of the mean catalogue minus transformed values for the stars used in the transformation, is better than 01 both in Right Ascension and Declination.
Equatorial coordinates and mean photometric magnitudes, colours and indices for stars in the central region of NGC 663 are presented in Table 3. We have adopted the cluster star numbering system from the WEBDA database111http://obswww.unige.ch/webda/ (Mermilliod, 2000). For cluster numbers lower than 635, WEBDA numbers are coincident with Wallenquist (1929) numbers, which we will refer to as ’W’ hereafter.
| Star | (J2000) | (J2000) | N | N | M | ||||||||||
|---|---|---|---|---|---|---|---|---|---|---|---|---|---|---|---|
| 1 | 01 46 33.806 | +61 13 34.04 | 14.653 | 0.545 | –0.144 | 0.819 | 0.016 | 0.017 | 0.045 | 0.065 | 5 | 2.767 | 0.060 | 3 | m |
| 2 | 01 46 35.604 | +61 13 39.08 | 12.258 | 0.572 | –0.196 | 0.230 | 0.010 | 0.007 | 0.020 | 0.021 | 6 | 2.473 | 0.017 | 3 | m |
| 3 | 01 46 39.876 | +61 14 02.51 | 13.029 | 0.508 | –0.124 | 0.538 | 0.003 | 0.009 | 0.016 | 0.022 | 6 | 2.595 | 0.042 | 3 | m |
| 4 | 01 46 38.997 | +61 14 06.06 | 11.025 | 0.490 | –0.166 | 0.131 | 0.002 | 0.016 | 0.036 | 0.034 | 4 | 2.558 | 0.026 | 3 | m |
| 5 | 01 46 37.352 | +61 14 17.48 | 14.288 | 0.561 | –0.150 | 0.663 | 0.015 | 0.016 | 0.032 | 0.036 | 6 | 2.708 | 0.009 | 3 | m |

3 Reddening, intrinsic colours and distance
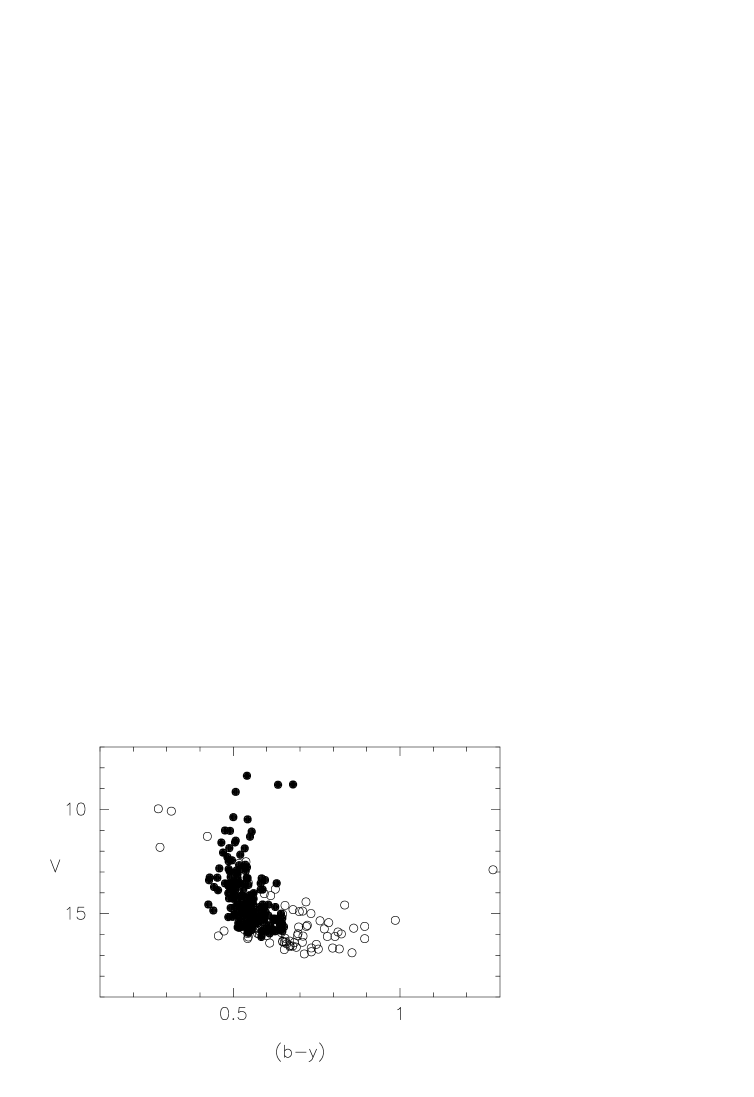
The colour-magnitude diagram of all observed stars is presented in Fig. 1, and the photometric diagram in Fig. 2. To obtain the intrinsic colours we first classified the stars as belonging to the early (earlier than A0), intermediate (A0-A3) or late (A3 onward) groups defined by Strömgren (1966). The classification was performed by means of the algorithm described by Figueras et al. (1991).
Cluster membership was assigned from the position of each star in the different photometric diagrams. Stars considered as members are marked in the last column of Table 3, and are represented with a different symbol (filled circle) in Figs. 1 and 2. The reliability of the photometric membership criteria was checked in CF02, where we conclude that our cluster photometric sequences are not significantly contaminated with the inclusion of nonmember field stars, and, conversely, very few, if any, actual members have been excluded from them.
All member stars belong to the early group, indicating that our magnitude limited photometry does not reach beyond the late B spectral types. Reddening values and intrinsic colours and indices were hence obtained by means of the procedure described by Crawford (1978). We have used the standard relation given in Table VI of Perry, Olsen & Crawford (1987), and the following reddening relations:
Known supergiant and Be stars have not been included in the computation of the interstellar reddening. B type supergiants do not follow the standard relation, while Be stars present an additional reddening contribution of circumstellar origin.
We obtained a mean reddening value of , from 189 stars. The large value of the standard deviation indicates the presence of variable reddening across the cluster area. In Fig. 3 we have represented the reddening values for individual stars as a function of their position. The cluster centre is the most heavily reddened region, while in the south-east part the extinction is significantly lower than the cluster average, as already noted by Fabregat et al. (1996). In Fig. 3 we have divided the cluster nucleus area into three regions of different reddening. Mean reddening values in these regions are presented in Table 4. Within each region, and in particular in regions B and C, the standard deviation of the mean reddening is still large, indicating that we cannot consider constant extinction within the region. Instead, the extinction appears to be clumpy and irregularly variable with high spatial frequency.

| Region | stars | |
|---|---|---|
| A | 100 | |
| B | 40 | |
| C | 49 |
In Fig. 4 we present the intrinsic diagram for B stars. Each star has been dereddened on the basis of its position within Fig. 3, and using the reddening values in Table 4. To obtain the distance we have fitted to the diagram the ZAMS as presented in Table VI of Perry et al. (1987). We found the best fitting at a distance modulus of 11.6 mag. To estimate the error of this determination we have also represented in Fig. 4, as dotted lines, the ZAMS shifted by distance moduli of 11.4 and 11.8 respectively. We find that the 11.6 value produces a distinctly better fitting than the two latter ones, and hence we give the value of mag. as the distance modulus of NGC 663. This value is in good agreement with the recent determinations based on CCD photometry.

4 Cluster age
Age determination has been done by isochrone fitting to the upper main sequence. In the system, for early-type stars the colour and the index are temperature indicators, and hence both and planes are observational HR diagrams. Following the discussion in Fabregat & Torrejón (2000) we consider the isochrone fitting to the diagram as more precise and reliable, for the following reasons: i./ the range of variation of the index along the B-type sequence is more than ten times larger than the range of variation of , providing much better discrimination between isochrones of similar ages; ii./ the index is less affected, by a factor of 5, by interstellar reddening; iii./ the plane allows an efficient segregation of emission line stars.

As a first approach, in Fig. 5 we compare the B star sequence of NGC 663 in the plane with that of and Persei. Photometric data for and Per have been obtained from CF02. The turn-off of both sequences are clearly seen, and from them it is apparent that NGC 663 is significantly older than and Persei. Five NGC 663 stars are distinctly outside the cluster sequence. Star W4 lies at the left of the cluster turn-off, close to the ZAMS, and it is hence a cluster blue straggler. Its spectral type, derived from its index, is B1V. This star is also a Cephei pulsating variable (Pietrzyński, 1997; , Pigulski et al.2001b). Its position in the photometric diagram is close to W161, another main sequence blue straggler already noted by Fabregat et al. (1996), but outside the field observed in this study.
The other four stars are in an horizontal sequence with between 6 and 5 magnitudes. They are stars W40 (BD +60 343), W44 (BD +60 339), W54 (BD +60 333) and W86 (BD +60 331). All of them are supergiants. They will not be considered for isochrone fitting in the plane since the index defines different effective temperature scales for main sequence and supergiant stars. In CF02 there is a detailed discussion on this subject.
In Fig. 6 we present the sequence together with isochrones with ages of 7.3, 7.4 and 7.5 years. The isochrones have been computed with the evolutionary models of Schaller et al. (1992), and transformed to the observational plane by means of the relations obtained by Torrejón (1997). Practically all stars at the cluster turn-off lie between the 7.4 and 7.5 isochrones. Most stars are located on the 7.5 isochrone, but a significant number, 5 stars, are at the left, making the 7.4 isochrone better for defining the lower envelope of the stellar sequence.
In order to use the supergiant stars to further restrain the age determination, in Fig. 7 we present the photometric diagram. is a measure of the Paschen continuum slope, which is correlated with effective temperature for stars of all luminosity classes. In this plane the four supergiants are closer to the 7.4 years isochrone than to the 7.5 one. Their positions even suggest a still younger age. However, for the reasons discussed above, the error in the position of a star in the plane is likely to be affected by much bigger errors, and hence we give a higher weight to the age determination through the plane.
From all this discussion we finally adopt an age of years ( Myr). The quoted error is higher than the one we estimated in our age determination of the and Persei clusters in CF02. The reason for this is the more variable and clumpy nature of the interstellar reddening in the NGC 663 field, which makes the reddening determination more imprecise and the sequences in the intrinsic photometric planes more disperse.


5 Discussion
Fabregat & Torrejón (2000) proposed that the Be phenomenon is an evolutionary effect, appearing at the end of the main sequence lifetime of a Be star. They based their conclusion in the analysis of the frequency of Be stars in clusters of different ages. They found that in clusters younger than 10 Myr Be stars are lacking or very scarce. The maximum Be star frequency occurs in clusters in the 13–25 Myr age interval. The main sequence lifetime of a B2 star – the subtype in which the Be star frequency reach its maximum – is 26 Myr. The lack of Be stars in the youngest clusters indicates that a Be star cannot be a young object, but an object close to the end of its life in the main sequence.
However, the above results were drawn from inhomogeneous sets of data from the literature. In particular, published ages are often affected by important uncertainties. The accurate and homogeneous dating of young open clusters with different Be star content is hence a key issue to check the evolutionary hypothesis for the Be phenomenon.
The obtained age and associated error safely exclude an age lower than 10 Myr, and places NGC 663 in the age interval (13–25 Myr) where the maximum Be star frequency occurs. A similar result was obtained in CF02 for the clusters and Persei, which also have a high Be star content. On the other hand, in a recent paper, Fu et al. (2003) failed to find any Be star in the younger cluster Trumpler 24. The results of this work, together with the two referred to above, are pieces of evidence supporting the view that the Be star phenomenon is an evolutionary effect appearing at the second half of the main sequence lifetime of a B star.
6 Conclusions
We have presented CCD photometry for stars in the central area of NGC 663. We have obtained the cluster astrophysical parameters from the analysis of the B type star range. The reddening is highly variable, with values ranging from in the central part to in the south-east. The distance modulus is found to be 11.60.1 mag. (2.1 Kpc), and the age years ( Myr).
A detailed analysis of the Be star population of NGC 663, the distribution of Be stars along the main sequence and their frequency as a function of the spectral subtype will be presented in a forthcoming paper.
Acknowledgments
We are grateful to the Observatorio Astronómico Nacional for the allocation of observing time in the 1.5m. telescope, and for support during observations. This research has made use of the WEBDA database, developed and maintained by J.C. Mermilliod, the SIMBAD database, operated at CDS, Strasbourg, France, and the NASA Astrophysics Data System Abstract Service. This work has been partially supported by the Plan Nacional de Investigación Científica, Desarrollo e Innovación Tecnológica del Ministerio de Ciencia y Tecnología and FEDER, through contract AYA2000-1581-C02-01, and by Generalitat Valenciana AVCyT through grant GRUPOS03/170.
References
- Capilla & Fabregat (2002) Capilla G., Fabregat J., 2002, A&A 394, 479 (CF02)
- Capilla et al. (2000) Capilla G., Fabregat J., Baines D., 2000, in Smith M.A., Henrichs H.F., Fabregat J., eds, Proc. IAU Coll. 175, The Be phenomenon in early-type stars, Astron. Soc. Pac. Conference Series 214, p. 63
- Crawford (1978) Crawford D.L., 1978, AJ 83, 48
- Fabregat & Torrejón (2000) Fabregat J., Torrejón J.M., 2000, A&A 357, 451
- Fabregat et al. (1996) Fabregat J., Torrejón J.M., Reig P., Bernabeu G., Busquets J., Marco A., Reglero V., 1996, A&AS 119, 271
- Figueras et al. (1991) Figueras J., Torra J., Jordi C., 1991, A&AS 87, 319
- Fu et al. (2003) Fu J.N., Sterken C., Duerbeck H.W., Mennickent R.E., 2003, A&A 412, 97
- Hoag et al. (1961) Hoag A.A., Johnson H.L., Iriarte B., Mitchell R.I., Hallam K.L., Sharpless S., 1961, Publ. USNO, Second Ser., 17, 343
- Høg et al. (2000) Høg E., Fabricius C., Makarov V.V., et al. 2000, A&A 355, L27
- McCuskey & Houk (1964) McCuskey S.W., Houk N., 1964, AJ 69, 412
- Mermilliod (2000) Mermilliod J.C., 2000, in Rebolo R., Zapatero-Osorio R.M., eds, Very Low-Mass Stars and Brown Dwarfs, Cambridge Univ. Press, Cambridge, p. 3
- Phelps & Janes (1994) Phelps R.L., Janes K.A., 1994, ApJS 90, 31
- Perry et al. (1987) Perry C.L., Olsen E.H., Crawford D.L., 1987, PASP 99, 1184
- Pietrzyński (1997) Pietrzyński G., 1997, AcA 47, 211
- (15) Pigulski A., Kopacki G., Kolaczkowski Z., 2001a, A&A 376, 144
- (16) Pigulski A., Kopacki G., Kolaczkowski Z., 2001b, AcA 51, 159
- Sanduleak (1979) Sanduleak N., 1979, AJ 84, 1319
- Sanduleak (1990) Sanduleak N., 1990, AJ 100, 1239
- Schaller et al. (1992) Schaller G., Schaerer D., Meynet G., Maeder A., 1992, A&A 96, 269
- Strömgren (1966) Strömgrem B., 1966, ARA&A 4, 433
- Tapia et al. (1991) Tapia M., Costero R., Echevarría J., Roth M., 1991, MNRAS 253, 649
- Torrejón (1997) Torrejón J.M., 1997, PhD Thesis, Univ. Valencia
- van den Bergh & de Roux (1978) van den Bergh S., de Roux J., 1978, AJ 83, 1075
- Wallace (1998) Wallace P.T., 1998, Starlink User Note 5.17, Rutherford Appleton Laboratory
- Wallenquist (1929) Wallenquist A., 1929, Medd. Astr. Obs. Uppsala n. 42