Anisotropies in the Neutrino Fluxes and Heating Profiles in Two-dimensional, Time-dependent, Multi-group Radiation Hydrodynamics Simulations of Rotating Core-Collapse Supernovae
Abstract
Using the 2D multi-group, flux-limited diffusion version of the code VULCAN/2D, that also incorporates rotation, we have calculated the collapse, bounce, shock formation, and early post-bounce evolutionary phases of a core-collapse supernova for a variety of initial rotation rates. This is the first series of such multi-group calculations undertaken in supernova theory with fully multi-D tools. We find that though rotation generates pole-to-equator angular anisotropies in the neutrino radiation fields, the magnitude of the asymmetries is not as large as previously estimated. The finite width of the neutrino decoupling surfaces and the significant emissivity above the surface moderate the angular contrast. Moreover, we find that the radiation field is always more spherically symmetric than the matter distribution, with its plumes and convective eddies. The radiation field at a point is an integral over many sources from the different contributing directions. As such, its distribution is much smoother than that of the matter and has very little power at high spatial frequencies. We present the dependence of the angular anisotropy of the neutrino fields on neutrino species, neutrino energy, and initial rotation rate. Only for our most rapidly rotating model do we start to see qualitatively different hydrodynamics, but for the lower rates consistent with the pre-collapse rotational profiles derived in the literature the anisotropies, though interesting, are modest. This does not mean that rotation does not play a key role in supernova dynamics. The decrease in the effective gravity due to the centripetal effect can be quite important. Rather, it means that when a realistic mapping between initial and final rotational profiles and 2D multi-group radiation-hydrodynamics are incorporated into collapse simulations the anisotropy of the radiation fields may be only a secondary, not a pivotal factor, in the supernova mechanism.
1 Introduction
The prompt hydrodynamic bounce in core collapse never leads to direct supernova explosions in either 1D, 2D, or 3D; neutrino losses and photodissociation by the shock debilitate it, even for the lowest mass progenitors and accretion-induced collapse (AIC). In the Chandrasekhar context, there is just too much mass between the place the shock originates (0.6 M⊙) and the outer boundary (1.2 M⊙) and the shock stalls into an accretion shock. Furthermore, in spherical symmetry (1D), it has been shown using Boltzmann neutrino transfer and the best physics that the delayed neutrino mechanism after shock stagnation does not work (Rampp & Janka, 2000; Mezzacappa et al., 2001; Liebendörfer et al., 2001; Thompson, Burrows, & Pinto, 2003). In 1D, the bounce shock stalls and is not revived, though an increase of only 25% in neutrino heating would lead to explosion. Such an increase could arise from as-yet-unknown neutrino effects or overturning motions in the inner core that could boost the neutrino luminosity, though neither of these classes of effects has been demonstrated.
However, in 2D, but using gray neutrino transfer, numerous simulations result in explosions (Herant et al., 1994; Burrows, Hayes, & Fryxell, 1995; Fryer & Warren, 2002), although they are sometimes weak. These calculations demonstrate that neutrino-driven convection in the so-called “gain” region near the shock (Bethe & Wilson, 1985) increases the efficiency of neutrino energy deposition, increases the size of the gain region, and facilitates explosion. The 2D multi-group calculations of Janka, Buras, and Rampp (2003) and Buras et al. (2003) employed multiple 1D radial Boltzmann solves in lieu of 2D transport. They obtained a marginal explosion, but did retain the velocity-dependent terms in the comoving transport equations. Recent 3D calculations (Janka et al. 2004), using 1D gray transport along radial rays, reveal that 3D may be marginally better than 2D. The energy of this 3D explosion depended on the authors’ choice of inner boundary condition. Nevertheless, multi-D effects seem to be crucial to the mechanism of core-collapse supernovae.
In the last few years, Shimizu et al. (2001), Kotake, Yamada, & Sato (2003), and Madokoro, Shimizu, & Motizuki (2004) have suggested that rotation enhances the neutrino flux () along the rotational axis and increases the pole-equator contrast in the neutrino heating rate, thereby facilitating a polar explosion. Shimizu et al. (2001) performed a set of 2D hydrodynamic simulations on a post-bounce structure in which neutrino heating, the pole-to-equator flux contrast, and the effective temperature of the neutrinosphere were varied. This parameter study did not involve transport and did not consistently determine the mapping between the rotation rate and the pole-to-equator flux contrast. Kotake, Yamada, and Sato (2003) used the code ZEUS-2D with a neutrino leakage scheme to estimate the asphericity in the neutrino flux for 2D rotating collapse models. They assumed that the neutrinos are emitted isotropically from a spheroidal neutrinosphere and that the neutrino energy density () and flux exterior to the neutrinosphere are related by = , where is the speed of light. Using shellular and cylindrical initial rotation laws (Ott et al. 2004), their initial core angular velocities ranged from 2.7 rad s-1 to 112 rad s-1 (the latter highly unrealistic) and their initial ranged from 0.25% to 1.5%. Kotake, Yamada, & Sato’s most rapidly rotating models achieved final s (where is the rotational kinetic energy and is the gravitational energy) as high as 14% and resulted, according to their prescriptions, in pole-to-equator contrasts in the neutrino heating rate of from a few to more than ten. Specifically, in Kotake, Yamada, & Sato (2003) representative values of these contrasts were 1.26, 2.12, 3.84, 5.61, 8.63, 15.2, and 25.9. Madokoro, Shimizu, & Motizuki (2004) assumed a pole-to-equator ratio in the neutrino fluxes given by the formula and explored parametrically the consequences of various degrees of the prolateness and oblateness of the neutrinosphere on the explosion of rotating cores.
None of these rotational anisotropy studies involved consistent radiative transfer calculations, nor did they derive in the context of a full radiation-hydrodynamic study the actual connection between rotation and the anisotropy of the neutrino radiation field. None of these studies was multi-group, nor were the various neutrino species (in particular, and ) distinguished. The rotational simulations of Fryer & Heger (2000, 2D) and Fryer & Warren (2004, 3D) were some of the most complete explorations to date of the effects of rotation on the supernova mechanism. However, these authors used a gray, flux-limited, diffusion approach and did not publish anything concerning the derived anisotropies of the radiation field, nor on the potential role of such anisotropies in the explosion. Their focus was on the evolution of the angular momentum and on its interaction with the neutrino-driven convective motions. Finally, the work of Janka, Buras, & Rampp (2003) and Buras et al. (2003) included in their set of simulations a slowly rotating model and was multi-group, but the transport was along radial rays and the pole-to-equator differences in the heating rates and fluxes could not be reliably determined.
In this paper, we present new results using the 2D multi-group, flux-limited diffusion (MGFLD) variant of the multi-group, multi-angle, time-dependent radiation-hydrodynamics code VULCAN/2D111VULCAN/2D is a multi-group, multi-angle, time-dependent radiation-hydrodynamics code. In addition to being 6-dimensional (1(time) + 2(space) + 2(angles) + 1(energy groups)), it has an ALE (Arbitrary Lagrangian-Eulerian) structure with remap, is axially-symmetric, can handle rotation, is flux-conservative, smoothly matches to the diffusion limit, and is implicit in its Boltzmann solver. However, it does not yet have all the velocity-dependent terms in the transport equation, such as the Doppler shift and aberration, though it does have the advection term. In addition, it does not currently have energy redistribution due to inelastic scattering. (Livne et al. 2004) to explore the effect of rotation on the anisotropy of the neutrino radiation field and to test the flux and heating asymmetry estimates of Shimizu et al. (2001), Kotake, Yamada, & Sato (2003), and Madokoro, Shimizu, & Motizuki (2004). Ours are the first consistent time-dependent calculations of this effect. The 2D MGFLD version of VULCAN/2D is computationally much faster and allows us to more quickly explore the model space. In 2D, we simulate collapse, bounce, neutrino shock breakout, and the neutrino-driven convection stages for a 11 M⊙ progenitor (Woosley & Weaver, 1995) both without and with rotation. Five models with rotation are simulated (§2). Eight neutrino energy groups and three neutrino species (, , and “”) are followed. The code is parallelized in energy groups using MPI. The fluxes are vector fluxes in two dimensions and both the regions at high and low optical depths are seamlessly followed. Rather than imposing a fixed luminosity inner boundary condition or cutting out the inner core (Scheck et al. 2004), the full time-dependence of the emerging neutrino luminosities and spectra and the motion of the inner core are consistently obtained from the simulations.
The calculations of this paper were performed using the MGFLD variant of VULCAN/2D, and not its full angle-dependent Boltzmann transport variant. Runs using the latter require significantly more CPU-hours to complete (Livne et al. 2004). Therefore, that variant is well less suited to the parameter study we present here. Differences between the MGFLD and Boltzmann versions are small at high and intermediate optical depths, but can be larger in the semi-transparent to transparent regime. In particular, at radii of 200 km, the MGFLD version, by dint of its diffusive nature, tends to smooth the angular dependence of the radiation fields and smear the contrast in the neutrino energy densities. This limitation should be borne in mind. However, the full transport version, using as it does the Sn method to resolve angular space, can itself introduce anomalies (periodicities) in the radiation fields at radii larger than 300-400 km, depending upon the number of angles used to cover the hemisphere. Hence, all approaches have their numerical limitations, though our qualitative conclusions concerning the flux and net gain anisotropies interior to the shock wave and in the inner regions around the neutrinospheres remain robust. In these regions, the 2D MGFLD approach provides a very reasonable representation of the multi-species, multi-group neutrino fields.
The limiter we employ is a 2D vector generalization of Bruenn’s scalar flux limiter (Bruenn 1985). It functional form is:
| (1) |
where , is the neutrino energy density spectrum, and is the total mean-free path. is the differential magnitude of the vector distance along the flux direction, given, as is assumed in the diffusion approximation, by the direction of the gradient of . Burrows et al. (2000) compared the accuracy with which various 1D flux limiters reproduced the neutrino heating rates behind the shock wave in the gain region found by the SESAME spherical Boltzmann codeBurrows et al. (2000); Thompson, Burrows, & Pinto (2003) and found that this simple limiter performed rather better than others in the literature.
We find that, while rotation does indeed induce an anisotropy in the neutrino flux, this effect is not necessarily rotation’s dominant consequence. It is also not as large as previously estimated. We do find that for rapid rotation the neutrino heating rate and the entropy due to neutrino heating are larger along the poles than the equator. However, other effects of rotation, in particular the consequent decrease in the effective gravity or the rotation-induced anisotropy in the mass accretion rate, may contribute as well (Burrows, Ott, & Meakin 2003; Burrows et al. 2004; Yamasaki & Yamada 2004) and be more important in facilitating a robust explosion. This possibility will be the subject of a subsequent paper (Burrows et al. 2005)222Burrows et al. (2004) and Burrows, Ott, & Meakin (2003) have suggested that the bipolar structures seen in Cas A (Willingale et al., 2002, 2003; Hwang et al., 2004) and inferred from the polarization of Type Ic supernovae (Wang et al., 2002, 2003) are a consequence of the neutrino mechanism in the context of rapid rotation, naturally producing 30∘-60∘ wide-angle “jets.”.
In §2, we discuss the initial rotational profiles we employ and our initial models. In §3, the overall hydrodynamic behavior of the rotating and non-rotating models through the first 175 milliseconds (ms) after bounce are described. The entropy, density (), and velocity evolution during this phase are provided. We present the mapping between the initial and “final” rotational profiles. The latter have been consistently derived in the context of multi-D radiation-hydrodynamic simulations and give one a reliable estimate of the spin rates expected, given the initial models assumed, of the protoneutron-star/protopulsar at this epoch in its early evolution. In §4, we present our major results concerning the angular distributions of the neutrino energy fluxes, the corresponding neutrino energy densities, and the neutrino-matter heating rates during the early post-bounce stages. In §5, we summarize our general conclusions concerning the rotation-induced anisotropy of the neutrino radiation fields in stellar collapse.
2 The Initial Models Used to Study the Rotation-Induced Anisotropy of the Neutrino Field and Heating Profile
For our simulations with rotation we take a non-rotating 11 M⊙ progenitor model from Woosley & Weaver (1995) and impose a rotation law (Ott et al. 2004):
| (2) |
where is the angular velocity, is the distance from the rotation axis, and and A are free parameters that determine the rotational speed/energy of the model and the distribution of angular momentum. Equation (2) starts the matter rotating on cylinders.
The five rotating models of this study have rad s-1 (Model A), rad s-1 (Model B), rad s-1 (Model C), rad s-1 (Model D), and rad s-1 (Model E), all with kilometers. The corresponding initial s are 0.29%, 0.075%, 1.5%, 9.4%, and 6.7%, respectively, and the corresponding initial central periods are 2.34, 4.69, 10.47, 41.89, and 157.1 seconds, respectively. A listing of the six models of this paper and their initial rotational characteristics is given in Table 1. Note that using the rotation law of eq. (2) makes the inner core rotate much more quickly than the periphery and puts much of the rotational kinetic energy in the interior. The material exterior to A (in this case, 1000 km) is rotating much more slowly. For instance, at 2000 km, the spin period for Model A is 11.7 seconds and that for Model B is 23.45 seconds. This material is accreted through the stalled shock wave within the first 100’s of milliseconds of bounce.
Many of the rotating progenitor models in the recent literature with comparable rotation rates were calculated without the centrifugal term turned on, either after the onset of core carbon burning or at all (Heger, Langer, & Woosley, 2000; Heger, Woosley, & Langer, 2003; Heger, Woosley, & Spruit, 2004). The result is that many of these models initially expand when mapped into 2D rotation codes such as VULCAN/2D. Given this, and the fact that the most current rotating progenitor models were available only after we began our calculations (which take approximately one month to complete), we have deferred the study of the rotating models now in the literature to a later date. Furthermore, the two main groups (Heger, Langer, & Woosley, 2000; Heger, Woosley, & Langer, 2003; Hirschi, Meynet, & Maeder, 2004; Heger, Woosley, & Spruit, 2004; Meynet, Hirschi, & Maeder, 2004) performing these detailed progenitor simulations up to the onset of collapse do not agree even qualitatively on the proper prescriptions for the transport of angular momentum during the various nuclear burning stages. The major sticking point is the role of magnetic fields and their proper treatment. As a result, there is still a spread by factors of from 10 to 100 in the specific core angular momenta and spin periods for the same progenitor ZAMS mass and initial surface velocity, with magnetic models resulting in the slowest spin rates. For instance, Heger, Woosley, & Spruit (2004), using different presciptions for angular momentum transport, with and without magnetic fields, derive core s that range from 0.1 rad s-1 to 6.0 rad s-1, with a preference for the lower values. However, Hirschi, Meynet, & Maeder (2004) derive s near 1.0 rad s-1. Clearly, it will be important to resolve these issues, since rotation is certainly a factor in core-collapse phenomenology.
For the non-rotating control model, we employ the non-rotating 11 M⊙ progenitor from Woosley & Weaver (1995) from which we generated the above rotating Models A-E, and designate this non-rotating Model F. The grid we use for all models is similar to that described and plotted in Ott et al. (2004), but with 81 angular and 128 radial bins. The inner 20 kilometers is tiled more densely to better resolve core bounce. The cylindrical coordinate system allows the central core, always handled in 2D, to move along the axis of symmetry if the dynamics requires it. We use eight energy groups centered at 2.5, 6.9, 12, 21, 36.7, 64, 112, and 196.5 MeV.
3 The Basic Hydrodynamic Behavior
Since our focus in this paper is on the magnitude and character of the rotation-induced anisotropy of the neutrino radiation fields in the context of core collapse, we will describe only briefly the hydrodynamic effects of rotation themselves. More detailed discussions of the resulting dynamics and of the supernova phenomenon as determined in this series of 2D MGFLD simulations will be deferred to another paper (Burrows et al. 2005).
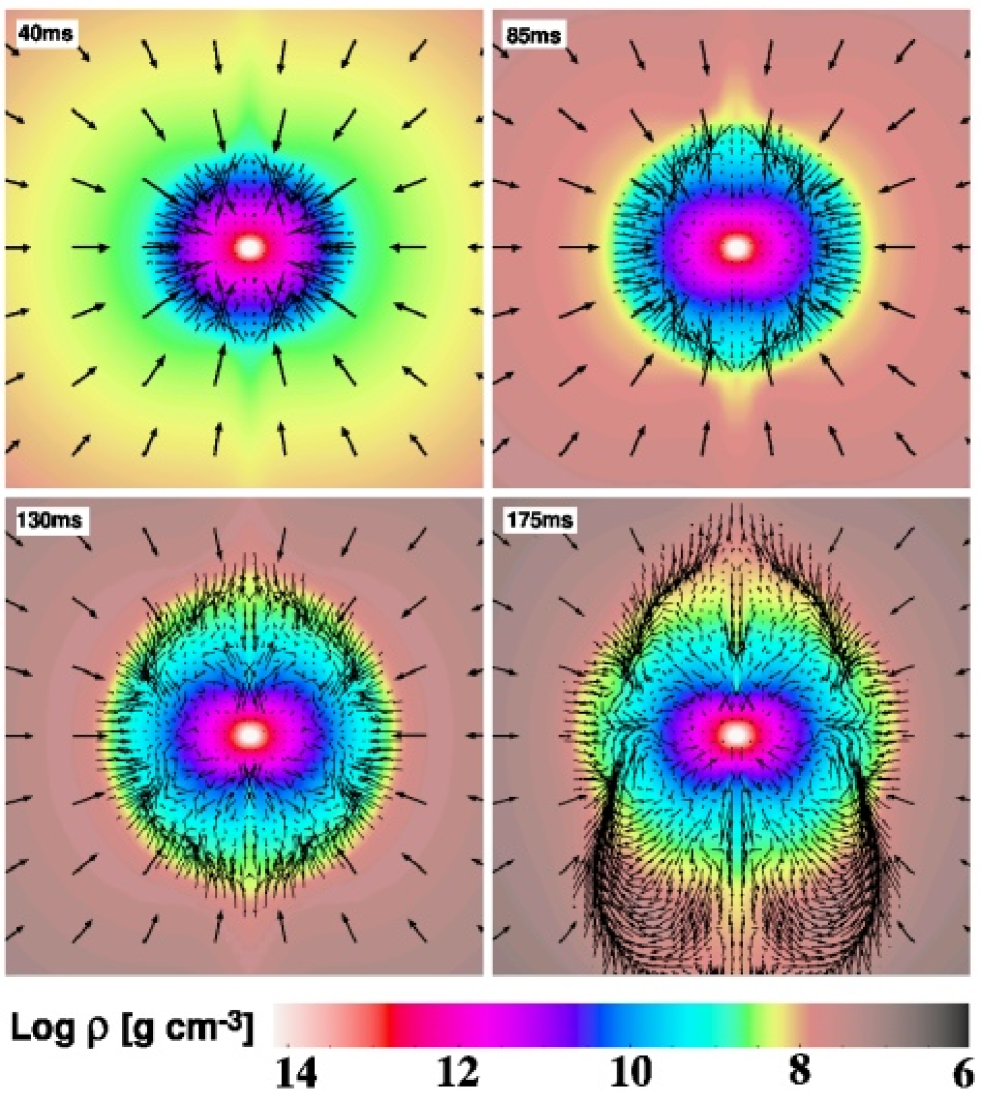
Figure 1 depicts snapshots of mass density color maps in the inner 600 kilometers (km) on a side of Model A ( = 2.68 rad s-1) at various times after bounce up to 175 milliseconds. Velocity vectors are superposed to trace the flow. A salient characteristic of this plot is the degree of oblateness induced by rotation. In the inner 30 km, the axis ratio of isodensity contours is approximately 2:1, but further out it is more moderate. At a given radius of 90 km, the equator-to-pole ratio in the mass density gradually increases with time starting at a value of 2.5 at 30 ms. This increase is a consequence of the relative decrease in the accretion rate along the poles due to the centrifugal barrier of rotation and the establishment of a funnel (Burrows, Ott, & Meakin 2003). The mapping between the oblateness of the density field near the “neutrinosphere” and the neutrino flux field has been a feature in past discussions of the latter’s rotationally-induced anisotropy (e.g., Shimizu et al. 2001; Kotake, Yamada, & Sato 2003; Janka & Mönchmeyer 1989ab). Note that the position of the shock wave (identified by the clear jump in color and velocity field) grows steadily with time and that a top-bottom asymmetry develops at the latest time. Since this late-time dipole-like structure is most manifest near the shock wave, and the shock at this time is near a radius of 300 km, the top-bottom matter asymmetry does not much affect the neutrino emissions emerging from the inner 50-100 km.
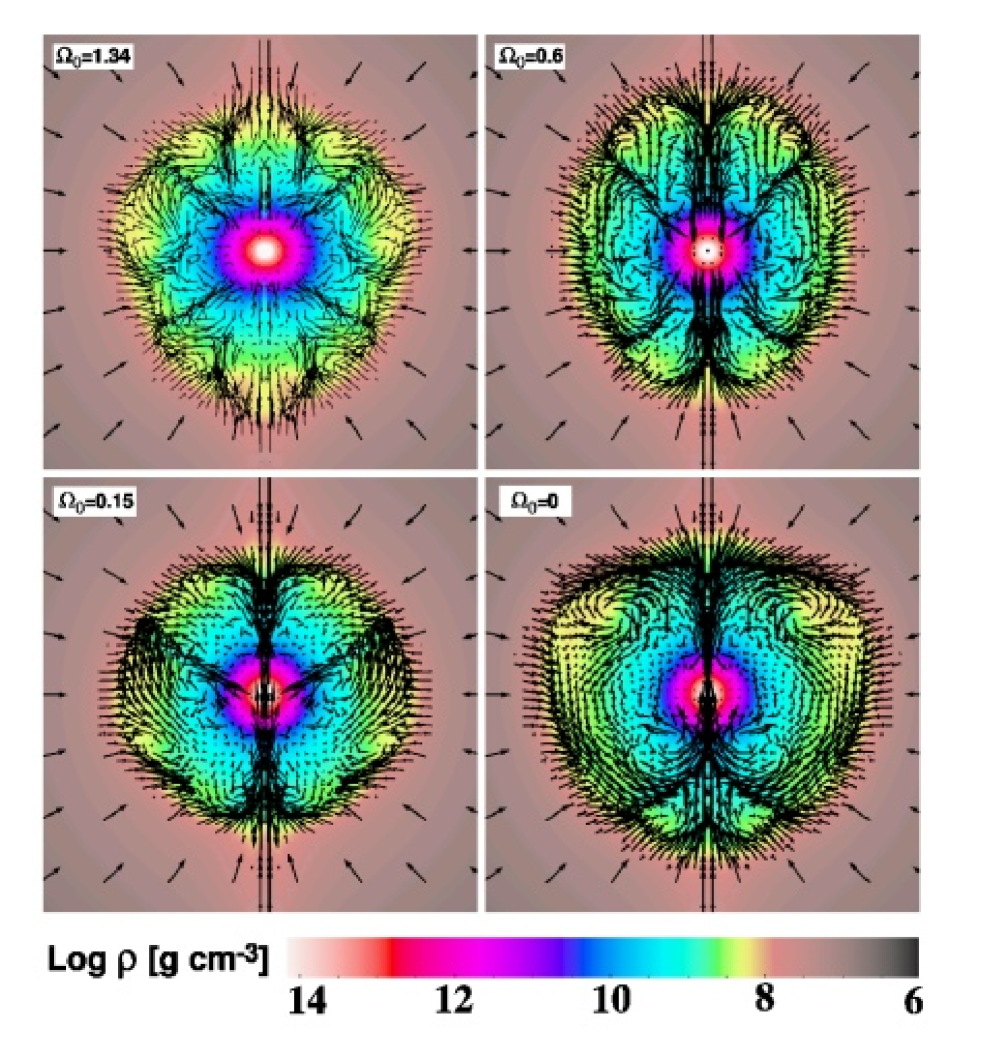
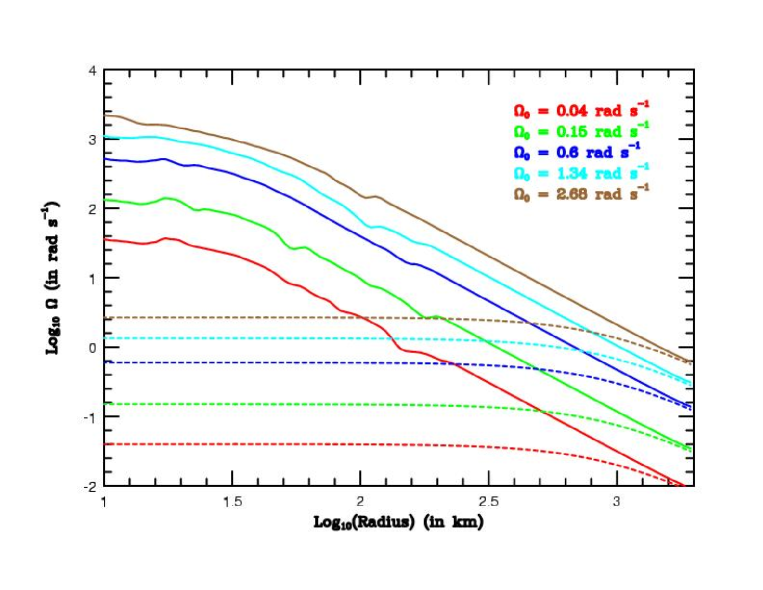
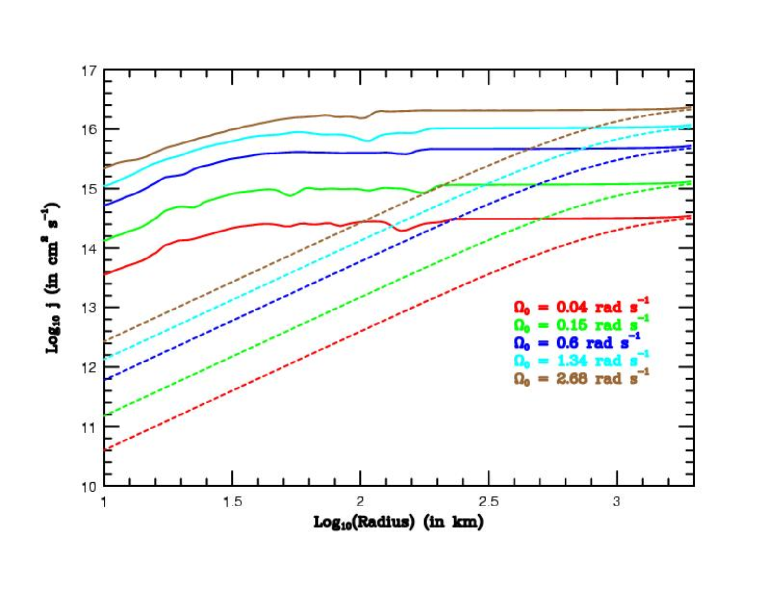
Figure 2, which shows the corresponding mass density maps and velocity fields for the different rotation laws represented by Models B, C, D, and F (non-rotating) at 175 milliseconds after bounce, is more relevant to the question at hand. From the clearly weak dependence of the degree of oblateness of the color contours (i.e., red, purple) with initial rotational parameter , we see that only the fastest of the models in this model set ( = 2.68 and 1.34 rad s-1) manifest dramatic oblateness in the isodensity contours, and this in only the inner 100 km. Figure 3 portrays the corresponding “final” (at 175 ms) angular velocity and specific angular momentum profiles for Models A-E,F. Since the models depicted were generated using 2D MGFLD with multiple neutrino species and realistic opacities, 2D hydrodynamics with rotation, and a realistic equation of state (Lattimer & Swesty 1991), this figure gives the most accurate mapping between initial rotational law and “final” protoneutron star rotation profile yet calculated. Even with = 0.6 rad s-1 (initial period, P0, 10 seconds), Fig. 2 shows no dramatic rotational flattening, though at 175 ms the equator-to-pole density ratio at a fixed radius of 90 km is 1.5, at a fixed radius of 50 km is 1.4, and at a fixed radius of 30 km is 1.2. The corresponding ratio at 30 km and 175 ms for = 1.34 rad s-1 is 2.0. We conclude that when one uses more sophisticated 2D multi-group neutrino transport instead of leakage or gray schemes, and consistently incorporates rotation into the dynamics of collapse and shock formation, models with “final” core spin periods greater than 10 milliseconds ( rad s-1) show only modest rotational distortions in the inner core. This does not mean that rotation does not have dynamical effects. Rather, it means merely that only rapid rotation (as quantified here) can induce significant matter oblateness near the neutrino decoupling surfaces. Note that Models A and B have initial spin rates at the upper end of those generated by Hirschi, Meynet, & Maeder (2004).
Figure 2 also demonstrates that the number of convective rolls and plumes increases with spin rate. At , only large-scale convective modes predominate. However, for rad s-1, the number of rolls hovers around five at 175 ms, as does the number of downwelling plumes. The barrel-shaped structures rotating on cylinders that are created after bounce are broken up by these rolls in a classic pattern. Note, however, that for the most rapidly rotating Model A the number of rolls is actually smaller than for Model B. Consistent with the Solberg-Høiland stability condition, convection in rapid Model A is partially stablized in the gain region. Also, the polar heating rate for Model A is sufficiently high relative to its equatorial heating rate that the polar entropy is always much higher than that off the poles. Furthermore, buoyancy behind the shock keeps the hot bubble generated by neutrino heating near the poles confined there.
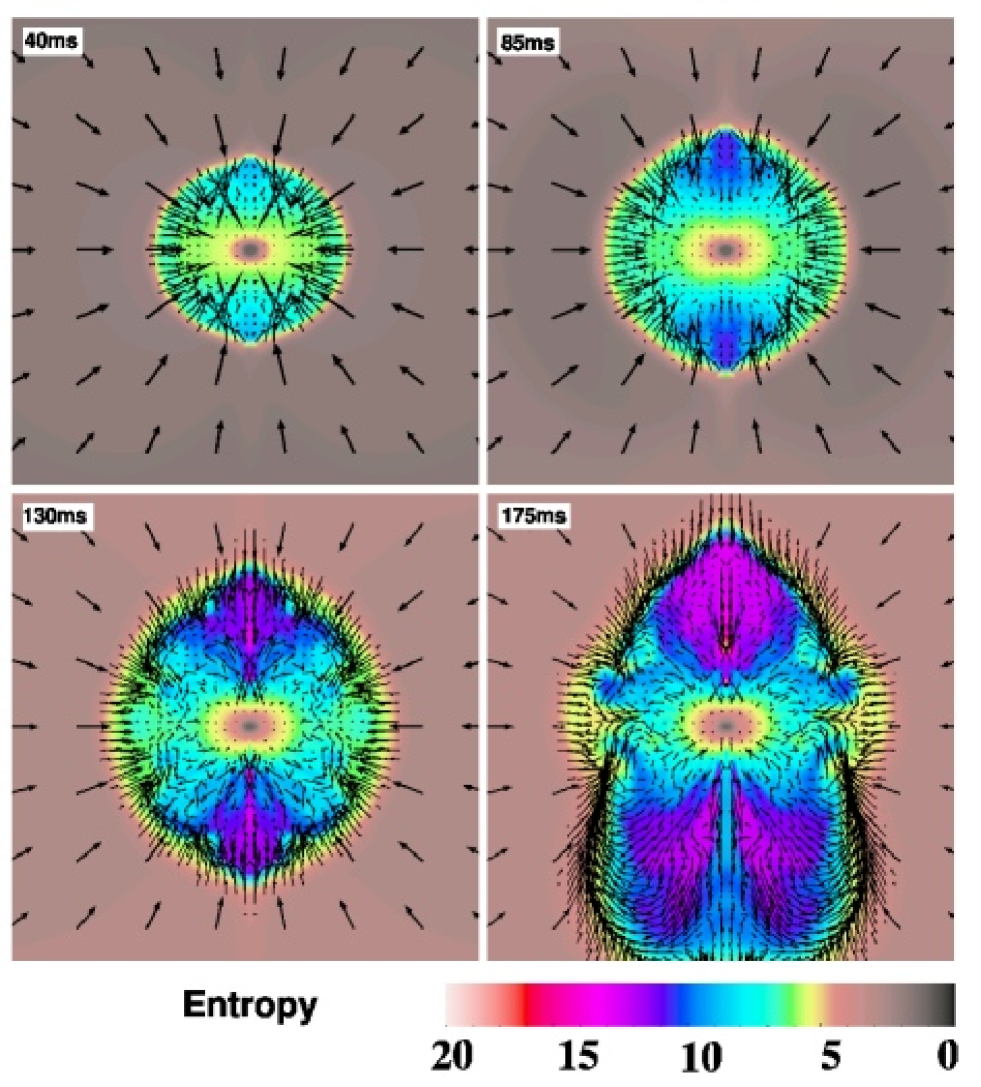
Figure 4 depicts the entropy distribution of Model A as a function of time. We see that early in the model’s post-bounce evolution the entropy along the poles is larger (purple) than along the equator. This is a manifestation of the larger heating rate along the poles caused by the rotation-induced asymmetry of the neutrino flux and heating rates (§4). For Model A after 85 ms, an angular region that extends approximately 45∘ from the pole clearly has higher entropies. In these simulations, there is a slight axis anomaly due to resolution and finite-difference inaccuracies when we use cylindrical coordinates. However, this region extends only a few degrees on either side of the pole and does not explain the much-wider-angle high-entropy caps. Note that in the VULCAN/2D ALE scheme, during infall the specific angular momentum is advected numerically along the Eulerian grid to better than 1 percent, but in the inner core (0.3 M⊙) the advection error can reach 10%. However, by numerical construction we conserve total angular momentum exactly.
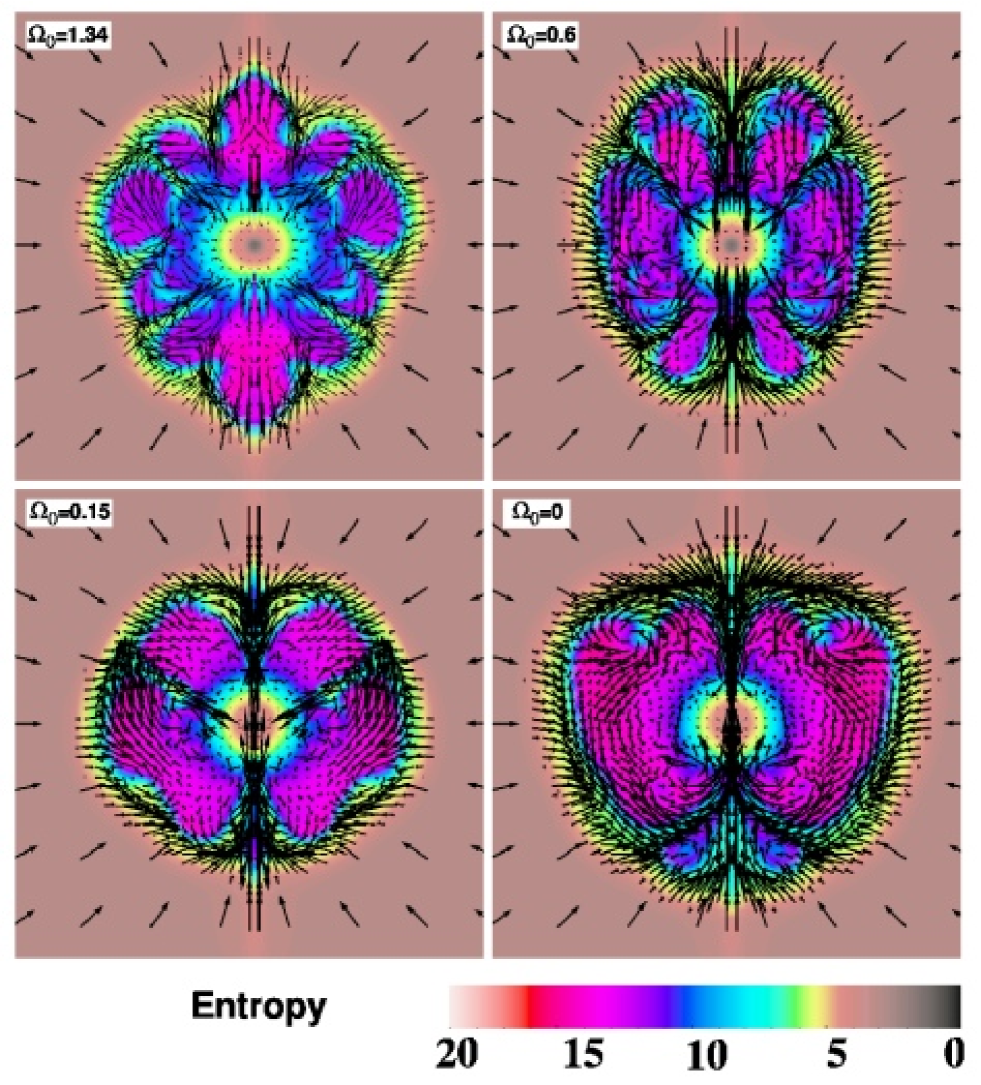
However, as Fig. 4 indicates, with time the region of high entropy spreads in angle from the poles. For Model A, the top-bottom asymmetry emerges before the higher-entropy material has spread over the full 180∘ of the simulation behind the shock. But, for rotating Models B-E, though the average radius of the shock always increases after about 100 ms after bounce, the high-entropy rolls have spread completely around the sphere before a significant top-bottom, dipolar asymmetry in the matter or any further dynamical effects are manifest. Figure 5 portrays the entropy maps at 175 ms after bounce for Models B, C, D, and F (non-rotating). Though in these models there is a slightly greater heating rate near the poles, the material there with higher entropy (and, hence, higher buoyancy) spreads in convective rolls away from the poles to larger angles. These “bubbles” are still confined in these models by the shock, before any hint of a dynamical transition is seen. The entropy distribution for these slower models is therefore more mixed than for Model A with its higher spin rate and partially stabilized convection (see Fig. 4).
4 Neutrino Flux and Heating Anisotropies due to Rotation
We now turn to a discussion of the degree of angular anisotropy in the neutrino field induced by core rotation. To demonstrate this physics it is useful to focus on the neutrino flux, local neutrino energy density, and total net gain (net heating rate). The flux and energy density are functions of energy group and species, and all quantities are functions of time and Model. Rather than present all these quantities for every group, every timestep, every species, and every Model we have picked a few slices in this large space to communicate the basic results.
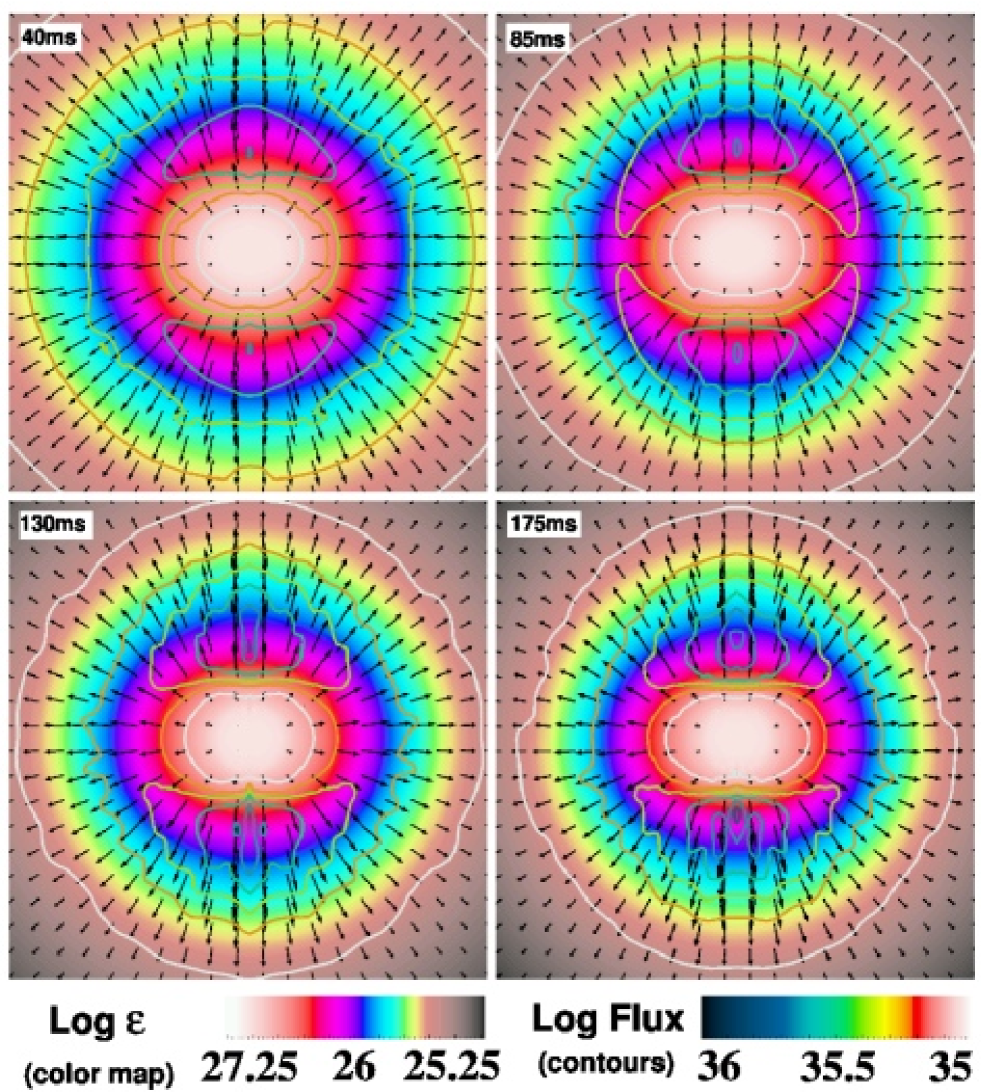
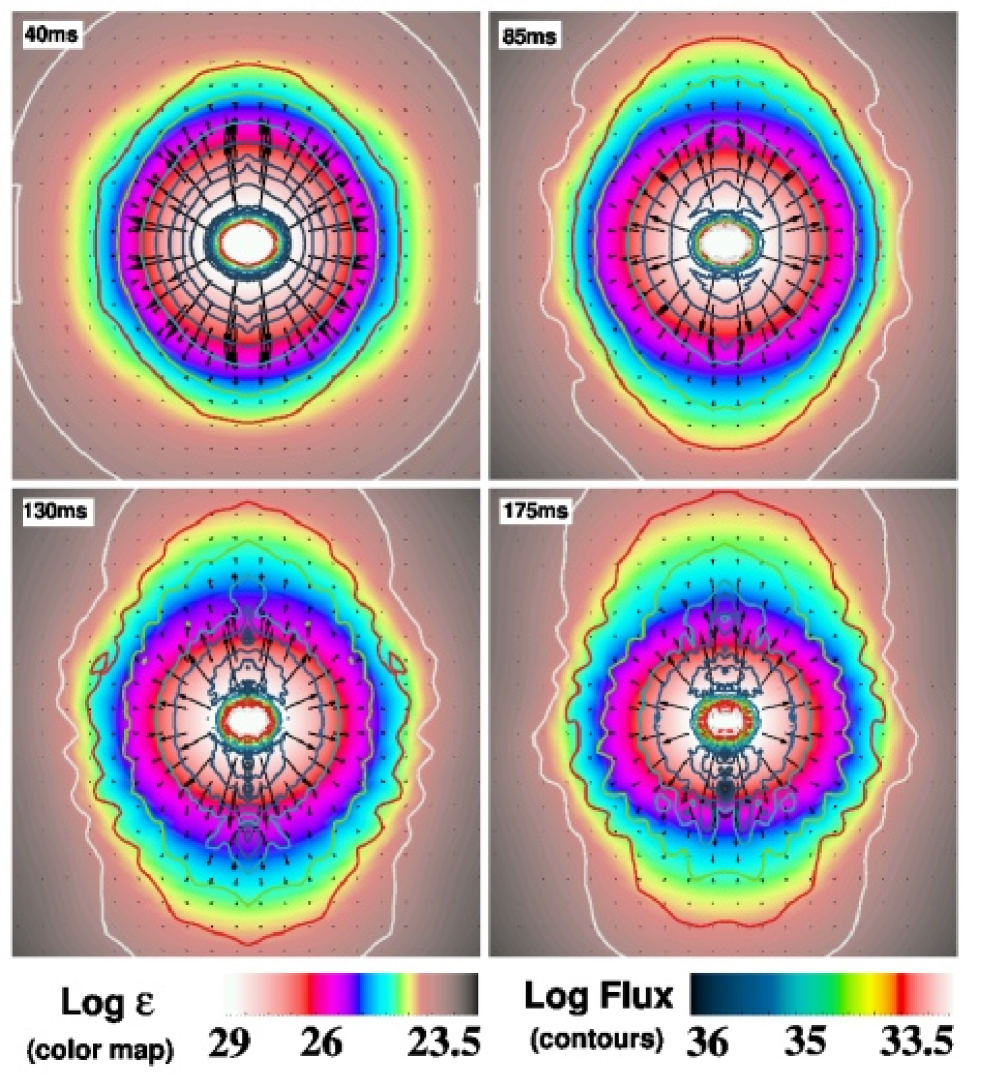
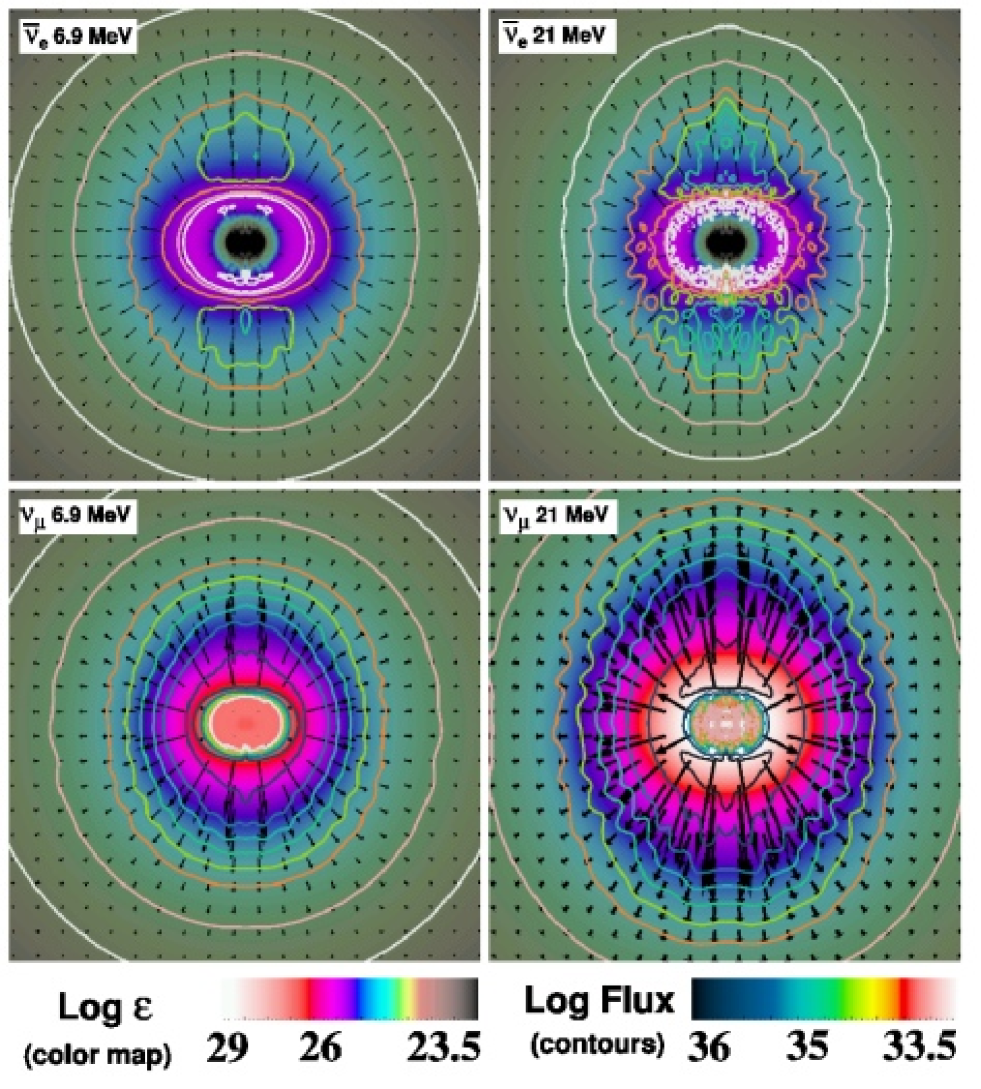
Figure 6 depicts the evolution of the flux (in erg cm-2 s-1 MeV-1; vectors and isocontours) and neutrino energy density (in erg cm-3 MeV-1) for the neutrinos at 6.9 MeV and for high-spin Model A ( rad s-1). The shape of the contours and the relative length of the vectors indicate the anisotropy of the flux at 6.9 MeV. Figure 7 shows the same quantities, but for a neutrino energy of 21 MeV. The higher neutrino-matter cross section of a 21 MeV neutrino puts its decoupling neutrinosphere further out in radius (at ), at different densities and spin rates.
The flatness of the color maps (energy density) on Fig. 6 show that the radiation field is indeed oblate, but by 175 ms has only a 2:1 axis ratio. That ratio gradually increases with time as the core slowly spins up at a rate () of roughly 5-10% per 100 milliseconds. The oblateness of the color contours is roughly consistent with Von Zeipel’s theorem for rotating stars, which states that iso-Tsurfaces follow equipotential surfaces. However, further out in radius the color contours become slightly prolate. This is particularly clear in Fig. 7. The transition from oblate to prolate is generic and is a consequence of the fact that at larger distances the angle subtended at the poles by the oblate, though diffuse, neutrinospheres is larger than the corresponding angle at the equator. However, the pole-to-equator asymmetry is not as large as a naive calculation would imply. The neutrinosphere radius (), if such can be defined in 2D, is a function of neutrino energy. Moreover, for a given neutrino energy is large. The fact that the neutrinospheres for all species and energy groups are not sharp in radius and that there is significant neutrino emission even exterior to a “” surface mutes the magnitude of the flux and energy density anisotropies. This is an important effect that can be determined only using multi-D, multi-group transport. As the shape of the flux contours and the ratio of the vector lengths seen in Figs. 6 and 7 imply, the pole-to-equator flux ratio at 6.9 MeV is at most a factor of 2. At 21 MeV and a radius of 90 km, the corresponding ratio for neutrinos is 3, for neutrinos is 2.5, and for neutrinos is 2 (see Fig. 8). There is a slight tendency for the pole-to-equator flux ratio to be larger for larger neutrino energies, but this ratio is a function of time and a strong function of radius.
A color plot of the net rate of neutrino energy deposition (the net gain) (in erg g-1 s-1, integrated over neutrino energy) for Model A at different times is given in Fig. 9. In this figure, the vectors are velocity vectors. Red and purple represent high rates of heating, while green and yellow represent low rates of heating or net losses. The strong polar heating, particularly at later times, is clearly seen and recapitulates what is seen in Fig. 4. However, though the entropy profile can be smoothed, the heating profile can better maintain asymmetry. Nevertheless, even for this rapidly rotating model the pole-to-equator ratio in heating rate is no greater than 3-5 at 150 km, an important area in the gain region.
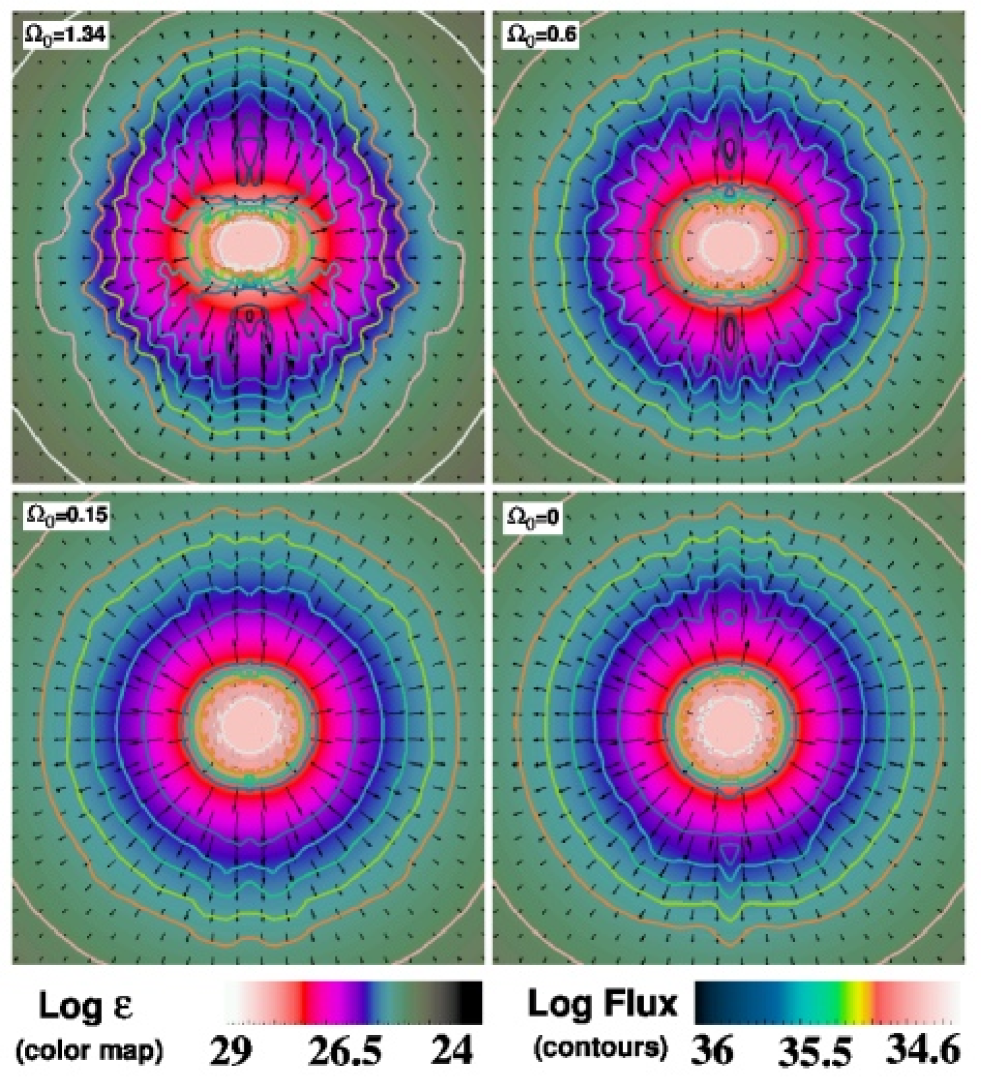
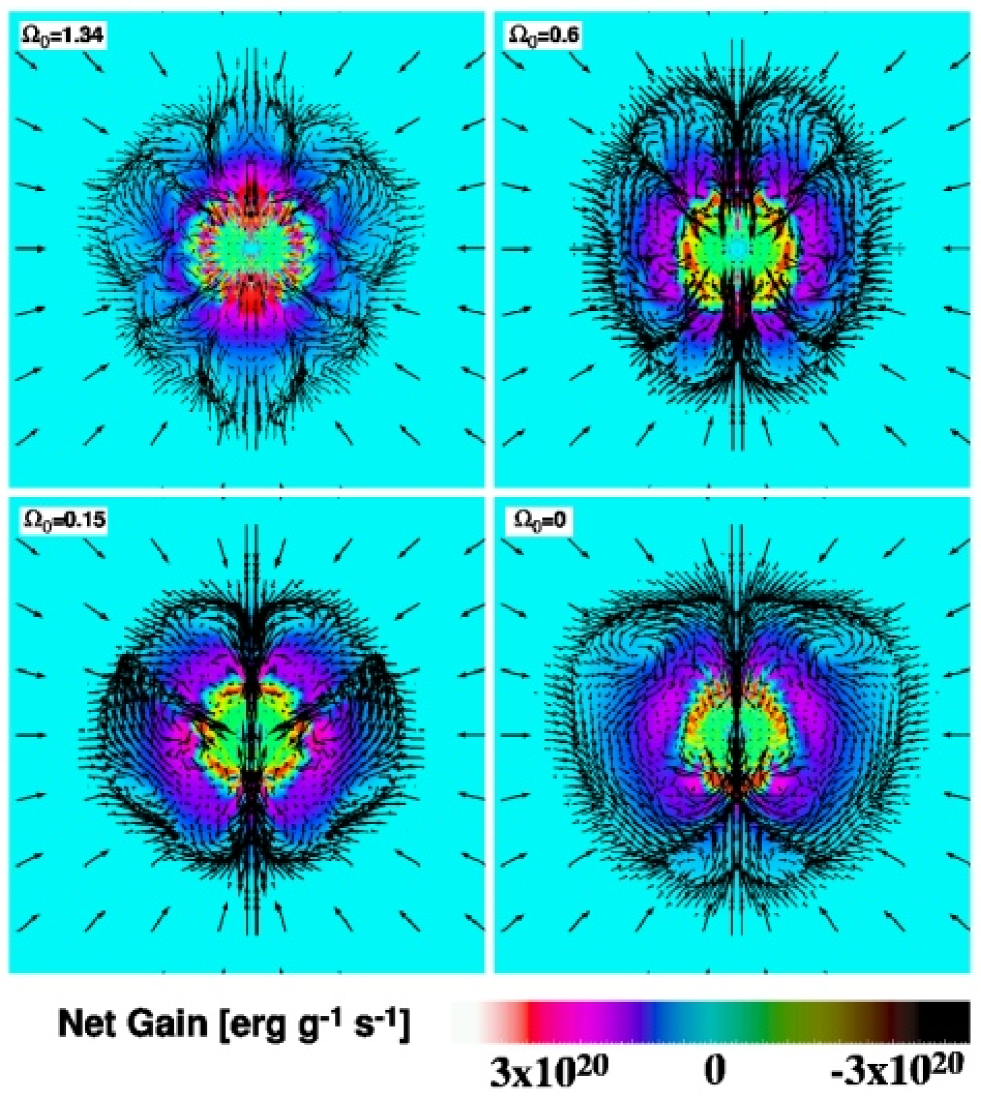
The corresponding color maps, contours, and vectors depicting the flux and energy density distributions (this time at 12 MeV), and the net gain distributions for other models (B, C, D, F [non-rotating]) at 175 ms after bounce are given in Figs. 10 and 11, respectively. There is a slight flux anisotropy for the rad s-1 and rad s-1 models. However, even at 1.34 rad s-1, at 90 km the pole-to-equator flux ratios at 12 and 21 MeV are only 1.2. At 21 MeV and for neutrinos, this ratio is at most 1.4. Even for the rad s-1 model, with a post-bounce spin period of 6-10 ms, the pole-to-equator heating rate anisotropy at 150 km hovers between 1.0 and 2.5. We conclude that while there is a greater heating rate at the poles for rotating models, the rotation rate required for a significant effect is large. Only our Model A shows a significant effect, though the magnitude of this effect as measured by the heating rate asymmetry and pole-to-equator flux ratio are not as large as estimated in the previous literature.
5 Conclusions
Using the 2D multi-group, flux-limited diffusion version of the code VULCAN/2D (Livne et al. 2004), we have calculated the collapse, bounce, shock formation, and early post-bounce evolutionary phases of a core-collapse supernova for a variety of initial rotation rates. This is the first series of such multi-group calculations undertaken in supernova theory with fully multi-D tools. We find that rotation does indeed generate pole-to-equator anisotropies in the neutrino radiation fields and fluxes, but that the magnitude of the asymmetry is not as large as previously estimated. The finite width of the neutrino decoupling surfaces and the broad distribution of neutrino sources above the surface mute the angular contrast. We have explored the angular dependence of the neutrino fields as a function of neutrino species, neutrino energy, and initial rotation rate. Only for our most rapidly rotating model (with rad s-1) do we start to see qualitatively different hydrodynamics, but for the lower rates consistent with the pre-collapse rotational profiles derived in the literature the anisotropies are rather more tame than anticipated. In addition, we have not been able to reproduce the suggestion of Shimizu et al. (2001) and Madokoro, Shimizu, & Motizuki (2004) that even a a few to a few tens of percent neutrino flux anisotropy can have a demonstrable effect on the hydrodynamics. This does not mean that rotation can not play a key role in collapse and supernova dynamics (Burrows, Ott, & Meakin 2003; Burrows et al. 2004; Yamasaki & Yamada 2004). The decrease in the effective gravity due to the centripetal effect can be quite important. Rather, it means that when a realistic mapping between initial and final rotational profiles and 2D multi-group radiation-hydrodynamics are incorporated into collapse simulations the anisotropy of the radiation fields may be only a secondary, not a pivotal factor, in the supernova mechanism. Moreover, we find that the radiation field is always more smooth and symmetric than the matter distribution, with its plumes and convective eddies. The radiation field at a point is an integral over many sources from the different contributing directions. As such, it does not vary as much as the matter on small spatial scales and has very little power at high spatial frequencies. The larger spatial and temporal variations in the neutrino flux are seen for the higher energy groups.
References
- Bethe & Wilson (1985) Bethe, H. & Wilson, J. R. 1985, ApJ, 295, 14
- Bruenn (1985) Bruenn, S.W. 1985, ApJS, 58, 771
- Buras et al. (2003) Buras, R., Rampp, M., Janka, H.-Th., & Kifonidis, K. 2003, Phys. Rev. Lett., 90, 241101
- Burrows et al. (2000) Burrows, A., Young, T., Pinto, P., Eastman, R. & Thompson, T. 2000, ApJ, 539, 865
- Burrows, Hayes, & Fryxell (1995) Burrows, A., Hayes, J., & Fryxell, B.A. 1995, ApJ, 450, 830
- Burrows, Ott, & Meakin (2003) Burrows, A., Ott, C.D., & Meakin, C. 2003, to be published in the proceedings of “3-D Signatures in Stellar Explosions: A Workshop honoring J. Craig Wheeler’s 60th birthday,” held June 10-13, 2003, Austin, Texas, USA
- Burrows et al. (2004) Burrows, A., Walder, R., Ott, C.D., and Livne, E. 2004, “Rotating Core Collapse and Bipolar Supernova Explosions,” to be published in the proceedings of the international conference entitled “The Fate of the Most Massive Stars,” held May 23-28, 2004, at Jackson Lake Lodge in the Grand Teton National Park, Wyoming, USA, ed. Roberta Humphreys (ASP Conf. Series), astro-ph/0409035.
- Burrows et al. (2005) Burrows, A. et al. 2005, in preparation
- Fryer & Heger (2000) Fryer, C.L. & Heger, A. 2000, ApJ, 541, 1033
- Fryer & Warren (2002) Fryer, C.L. & Warren, M. 2002, ApJ, 574, L65
- Fryer & Warren (2004) Fryer, C.L. & Warren, M. 2004, ApJ, 601, 391
- Heger, Langer, & Woosley (2000) Heger, A., Langer, N., and Woosley, S.E. 2000, ApJ, 528, 368
- Heger, Woosley, & Langer (2003) Heger, A., Woosley, S.E., & Langer, N. 2003, in “A Massive Star Odyssey: From Main Sequence to Supernova,” Proceedings of IAU Symposium #212, held 24-28 June 2001 in Lanzarote, Canary Islands, Spain. Edited by Karel van der Hucht, Artemio Herrero, and César Esteban (San Francisco: Astronomical Society of the Pacific), p.357
- Heger, Woosley, & Spruit (2004) Heger, A., Woosley, S.E., & Spruit, H. 2004, astro-ph/0409422
- Herant et al. (1994) Herant, M., Benz, W., Hix, W.R., Fryer, C.L., & Colgate, S.A. 1994, ApJ, 435, 339
- Hirschi, Meynet, & Maeder (2004) Hirschi, R., Meynet, G., & Maeder, A. 2004, submitted to Astron. Astrophys. (astro-ph/0406552)
- Hwang et al. (2004) Hwang, U. et al. 2004, ApJ, in press.
- (18) Janka, H.-T. & Mönchmeyer 1989a, Astron. & Astrophys., 209, L5
- (19) Janka, H.-T. & Mönchmeyer 1989b, Astron. & Astrophys., 226, 69
- Janka, Buras, & Rampp (2003) Janka, H.-T., Buras, R., & Rampp, M. 2003, Nucl. Phys. A, 718, 269
- Janka et al. (2004) Janka, H.-T., Scheck, L., Kifonidis, K., Müller, E., & Plewa, T. 2004, astro-ph/0408439
- Kotake et al. (2003) Kotake, K., Yamada, S., & Sato, K. 2003, ApJ, 595, 304
- Lattimer & Swesty (1991) Lattimer, J.M. & Swesty, F.D., 1991 Nucl. Phys. A, 535,331
- Liebendörfer et al. (2001) Liebendörfer, M., Mezzacappa, A., Thielemann, F.-K., Messer, O. E. B., Hix, W. R., & Bruenn, S.W. 2001, Phys. Rev. D, 63, 103004
- Livne et al. (2004) Livne, E., Burrows, A., Walder, R., Thompson, T.A., and Lichtenstadt, I. 2004, ApJ, 609, 277
- Madokoro, Shimizu, & Motizuki (2004) Madokoro, H., Shimizu, T., & Motizuki, Y. 2004, astro-ph/0312624
- Meynet, Hirschi, & Maeder (2004) Meynet, G., Hirschi, & Maeder, A. 2004, astro-ph/0409508
- Mezzacappa et al. (2001) Mezzacappa, A., Liebendörfer, M., Messer, O.E.B., Hix, W.R., Thielemann, F.-K., & Bruenn, S.W. 2001, Phys. Rev. Lett., 86, 1935
- Ott et al. (2004) Ott, C.D., Burrows, A., Livne, E., & Walder, R. 2004, ApJ, 600, 834
- Rampp & Janka (2000) Rampp, M. & Janka, H.-T. 2000, ApJ, 539, L33
- Shimizu et al. (2001) Shimizu, T., Ebisuzaki, T., Sato, K., & Yamada, S. 2001, ApJ, 552, 756
- Scheck et al. (2004) Scheck, L., Plewa, T., Janka, H.-Th., Kifonidis, K., & Müller, E. 2004, Phys. Rev. Lett., 92, 011103
- Thompson, Burrows, & Pinto (2003) Thompson, T.A., Burrows, A., & Pinto, P.A., 2003, ApJ, 592, 434
- Wang et al. (2002) Wang, L., et al. 2002, ApJ, 579, 671
- Wang et al. (2003) Wang, L., Baade, D., Höflich, P., & Wheeler, J.C. 2003, ApJ, 592, 457
- Willingale et al. (2002) Willingale, R., Bleeker, J.A.M., van der Heyden, K.J., Kaastra, J.S., & Vink, J. 2002, Astron. Astrophys. , 381, 1039
- Willingale et al. (2003) Willingale, R., Bleeker, J.A.M., van der Heyden, K.J., & Kaastra, J.S. 2003, Astron. Astrophys. , 398, 1021
- Woosley & Weaver (1995) Woosley, S.E. & Weaver, T.A. 1995, ApJS, 101, 181
- Yamasaki & Yamada (2004) Yamasaki, T. & Yamada, S. 2004, astro-ph/0412625
| Model Name | Central | at 2000 km | ||||
|---|---|---|---|---|---|---|
| (rad s-1) | (km) | (s) | (s) | (%) | (%) | |
| A | 2.68 | 1000 | 2.34 | 11.70 | 0.29 | 6.50 |
| B | 1.34 | 1000 | 4.69 | 23.45 | 0.075 | 2.25 |
| C | 0.60 | 1000 | 10.47 | 52.36 | 0.015 | 0.50 |
| D | 0.15 | 1000 | 41.89 | 209.44 | 9.4 10-4 | |
| E | 0.04 | 1000 | 157.1 | 785.40 | 6.7 10-5 | |
| F | 0.0 | - | - | - | - | - |
Note. — and are the parameters used in eq. (2) to define the initial rotational profiles and is the initial period. Here, is for the initial configuration and is for the final configuration. See text for discussion.