GMOS Integral Field Spectroscopy of a merging system with enhanced Balmer absorption
Abstract
In this paper we present the three dimensional dynamics of the galaxy SDSS J101345.39+011613.66, selected for its unusually strong Balmer absorption lines (Wo(H)=7.5Å). Using the GMOS-South IFU in Nod & Shuffle mode we have mapped the continuum and optical absorption lines of this =0.1055 field galaxy. This galaxy has a disturbed morphology, with a halo of diffuse material distributed asymmetrically toward the north. Using the [Oii] emission line (Wo[Oii]=4.1Å) we find that the gas and hot OB stars are offset from the older stars in the system. The gas also has a spatially extended and elongated morphology with a velocity gradient of across 6 kpc in projection. Using the strong and absorption lines we find that the A- stars are widely distributed across the system and are not centrally concentrated arguing that the A-star population has formed in molecular clouds outside the nucleus. By cross correlating the spectra from the datacube with an A-star template we find evidence that the A-star population has a 40 shear in the same direction as the gas. The disturbed morphology, strong colour gradients and strong H and H absorption lines in SDSSJ 101345.39 argue that this is a recent tidal interaction/merger between a passive elliptical and star-forming galaxy. Although based on a single object, these results show that we can spatially resolve and constrain the dynamics of this short lived (yet important) phase of galaxy formation in which the evolutionary process take galaxies from star-forming to their quiescent end products.
1 Introduction
Galaxies with strong Balmer absorption lines in their spectra (H-strong, or HS galaxies) represent a short-lived but potentially important phase in galaxy evolution. Such lines indicate a stellar population dominated by A-stars which are normally either absent or overwhelmed by the much brighter OB stars. There is likely a variety of physical mechanisms that can lead to such a stellar population (e.g. Dressler et al. 1982; Couch et al. 1987; Poggianti et al. 1999; Balogh et al. 1999), but most invoke a major transformation from one galaxy type to another. Although such galaxies are very rare in the local Universe, their short lifetime means they could potentially represent an important phase in the evolution of most normal galaxies.
While high resolution imaging has demonstrated that most bright, nearby HS galaxies are spheroidal, often with signs of interaction (Yang et al. 2004; Couch et al. 2004; Balogh et al. 2004), the dynamics have been extremely difficult to observe and understand. Norton et al. (2001) have obtained longslit spectra of galaxies in the Zabludoff et al. (1996) sample, and find evidence that most of the galaxies are in the process of transforming from rotationally-supported, gas-rich galaxies to pressure-supported, gas-poor galaxies.
However, longslit spectroscopy mixes spatial and spectral resolution, and a better understanding of the dynamics can be obtained from integral field spectroscopy. This allows us to identify the physical locations of the gas, old (K) stars, young OB-stars and (the short-lived) massive A-stars, and to decouple their dynamics from their spatial distribution. In this paper we demonstrate the feasibility of using an integral field unit (IFU) to study the dynamics of HS galaxies. We have selected one field galaxy from the Sloan Digital Sky Survey (SDSS) and used the GMOS-South IFU in Nod & Shuffle mode to study the rest-frame optical spectra. Using this technique we can investigate the spatial distribution of star formation through the [Oii] emission and the distribution of the young A-stars through the (much stronger) stronger H and H absorption lines.
In §2 we present the data reduction and analysis. The results are presented in §3. Finally we summarise our results and present the implications in §4. We use a cosmology with =0.3, 0.7 and a Hubble constant of 70Mpc-1. In this cosmology, 2 kpc subtends 1′′ on the sky at .
2 Observations and Data Reduction
The target is selected from the SDSS DR1 (Abazajain et al. 2001), and was identified as a HS galaxy by Goto et al. (2003). This field galaxy has a redshift , with J2000 coordinates RA: 10:13:45.39, Dec: +01:16:13.66. Absorption lines in the SDSS spectra were fit with a double–Gaussian profile model to account for narrower emission filling within the absorption line, and all galaxies with rest-frame equivalent widths (EWs) Å were identified as HS. For this pilot study, we chose a relatively bright example, with mag (which corresponds to ). SDSSJ101345.39 has strong absorption lines and weak (but non-negligible) emission lines (Fig. 2). Post-starburst galaxies with strong H absorption, but with non-negligible [Oii] or H emission lines are usually referred to as e(a) galaxies. However as Balogh et al. (2004) show, e(a) galaxies with Wo([Oii])10Å and Wo(H)10Å appear to have the same properties of strict k+a galaxies (which are HS but have no detectable [Oii] or H emission). k+a galaxies are predominantly bulge dominated with little sign of spiral structure and signatures of recent (substantial) bursts of star-formation (Balogh et al. 2004). In this study, we have selected one galaxy which falls in this ”k+a plus weak emission” category in order to compare and contrast the dynamics and spatial distribution of the gas with that of the young stellar component.
![[Uncaptioned image]](/html/astro-ph/0412088/assets/x1.png)
True colour gri image of SDSSJ 101345.39 from the SDSS imaging. Both panels show the GMOS-IFU field of view. The main panel has been thresholded to emphasise the low surface brightness material outside the nucleus as well as the extension of material to the north, suggesting SDSSJ 101345.39 may have recently undergone an interaction. The inset is the same image but scales to emphasise the full range of surface brightness and shows that most of the stars are located inside the GMOS-IFU field of view. We have rotated this image to agree with the IFU observation, and so North is right and East is up.
2.1 Imaging
Using the SDSS gri-band imaging we construct a true colour image of SDSSJ 101345.39. Each image has an exposure time of 60 seconds and was obtained in 1.2′′ seeing. The final images have a plate scale of 0.4′′/pixel. The high surface brightness material in SDSSJ 101345.39 looks like a bulge dominated galaxy, however the lower surface brightness structure has a disturbed morphology (Fig. 1) of diffuse material, distributed asymmetrically toward the north, which may be indicative of a tidal interaction or merger. The GMOS-IFU field of view covers the central nucleus (where most of the stars are located), but the much lower surface brightness material is located outside the IFU field and extends over a radius.
2.2 SDSS Spectroscopy
The SDSS spectroscopy of SDSSJ 101345.39 shows strong H 4340.5Å and H 4101.7Å absorption lines, as well as emission lines. From the original SDSS spectra, we measure Wo(H)=7.5Å in absorption, and Wo(O[ii])=4.1Å in emission. The galaxy also shows H 6562.8Å and [Nii] 6583.0Å emission; although the measured equivalent width of H is 7.9Å, this is compromised by the strong underlying Balmer absorption. Taking into account the underlying absorption, the emission line ratios may be indicative of weak AGN activity in the galaxy (although as we show in §3, most of the emission is from a resolved component, and we therefore attach a cautionary note that, from our current data, the evidence for an AGN is tentative).
![[Uncaptioned image]](/html/astro-ph/0412088/assets/x2.png)
SDSS spectra of SDSSJ 101345.39. This spectrum has a lower resolution than the GMOS spectrum, but shows the [Oii] emission line as well as the much stronger H and H absorption lines. The SDSS spectra also covers the H emission line.
2.3 GMOS Spectroscopic Imaging
New observations of SDSSJ 101345.39 were taken with the GMOS-South IFU in Nod & Shuffle mode on 2004 February 28th U.T. during science verification time for a total of 3 hours in seeing and photometric conditions111Based on observations obtained at the Gemini Observatory, which is operated by the Association of Universities for Research in Astronomy, Inc., under a cooperative agreement with the NSF on behalf of the Gemini partnership: the National Science Foundation (United States), the Particle Physics and Astronomy Research Council (United Kingdom), the National Research Council (Canada), CONICYT (Chile), the Australian Research Council (Australia), CNPq (Brazil) and CONICET (Argentina).. Using the Nod & Shuffle mode we chopped away from the target by every 30 seconds. In this configuration the IFU uses a fiber fed system to reformat the field onto two long slits. Using the -band filter in conjunction with the B600 grating results in two tiers of spectra being recorded. The spectral resolution in this configuration is 1700. The [Oii](3726.1,3728.8Å) emission line and H and H absorption features all fall in regions of low sky emission and absorption.
In the Nod & Shuffle mode, the object and background regions are observed alternately through the same fibres by nodding the telescope. In between each observation the charge is shuffled on the CCD by a number of rows corresponding to the the centre-to-centre spacing of the blocks of 50 fibres into which each slit is divided. For the Nod & Shuffle mode, each alternate block is masked off so that it receives no light from the sky but acts simply as an image store. The slit to field mapping was arranged so that the resultant half of the total object and background field (75 + 3.55) formed a contiguous sub-field of 55. Since each alternate block is masked, each exposure can be stored in different regions of the CCD without contamination from any other region of the sky. The sequence of object and background exposures can be repeated as often as desired with the photoelectrons from each exposure being stored in their own unique regions of the detector. At the end of the sequence, the CCD is read, incurring a read-noise penalty only once (see Glazebrook & Bland-Hawthorn 2001) for further details of this general approach). For each fiber (and corresponding spectrum), we identify the corresponding sky spectrum in the shuffled position and subtract them to achieve Poisson–limited sky subtraction.
![[Uncaptioned image]](/html/astro-ph/0412088/assets/x4.png)
The reduced, sky-subtracted spectrum of SDSS J101345.39, generated by collapsing the central two square arcseconds of the galaxy. We have marked the strongest emission and absorption features. The hashed regions show the positions of the GMOS chip gaps.
The GMOS data reduction pipeline was used to extract and wavelength calibrate the spectra of each IFU element. The variations in fiber-to-fiber response were removed using twilight flat-fields and the wavelength calibration was achieved using a CuAr arc lamp. The wavelength coverage of the final data is 4080–5400Å. No flux standards were observed, as the spectral features of interest are narrow enough that the standard sensitivity is sufficient.
Since the datacube has a large wavelength coverage we correct for the parallactic angle by modelling a 2-hour observation running from -1 to +1 hour angle and corresponding minimum and maximum airmasses of 1.17 and 1.21. The average atmospheric dispersion between 400nm and 540nm is 0.67 at an angle roughly North–South. After building the datacube, we use idl to model and correct this aberration using a linear interpolation at each slice of the datacube along the wavelength axis.
We show the reduced, sky-subtracted spectrum, collapsed over the central two arcseconds of the galaxy in Fig. 4 and identify the strongest features.

3 Results
3.1 Spatial Light Distribution
To investigate the spatial distribution of the gas and stars in the galaxy we begin by extracting narrow-band slices from the datacube around the emission and absorption lines. We fit and subtract the continuum around the line of interest using a 3– clip to be sure that neighbouring emission and absorption lines are omitted. We then extract the narrow-band images from the datacube by collapsing each spectrum over the feature of interest. We also extract the continuum regions by median filtering each spectral pixel in the datacube between 4900–5300Å.
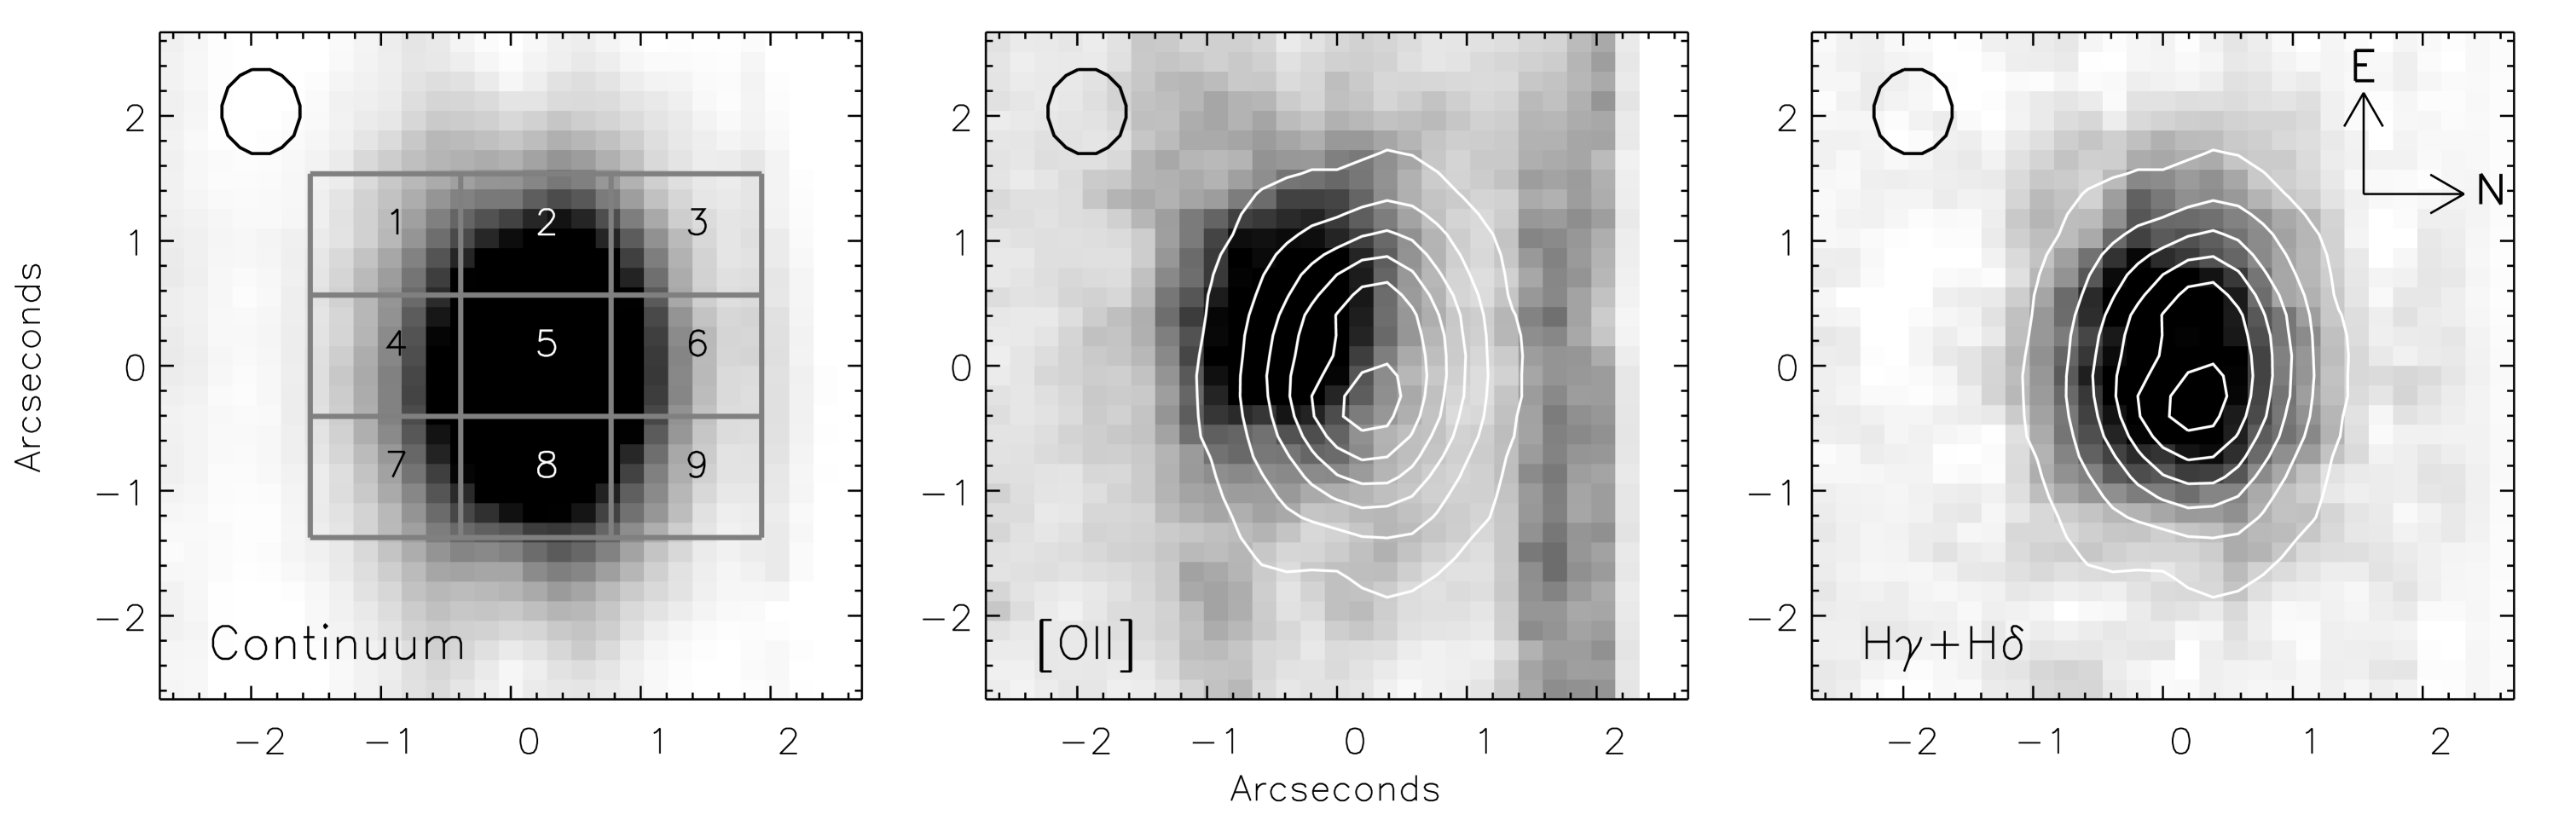
In Fig. 3 we show the spatial distribution of the relatively older stars (as traced by the continuum light between 4900Å and 5300Å), the gas (as traced through the [Oii] emission line) and the young, massive stars (traced by the H and H absorption lines). Fig. 3 shows that, while both the [Oii] emission and Balmer absorption lines are extended, they do not have the same spatial distribution. In particular, the centroid of the [Oii] emission is offset kpc to the SE from the older stars and the H and H absorption lines.
This difference is shown in Fig. 5, where we split the datacube into nine spatial bins. It is clear that the shape of the continuum is not constant across the galaxy. This is confirmed by comparing with the colour gradients in the SDSS imaging. By binning the imaging data into pixels (1.2 bins, matching the same spatial bins as in Fig. 5) we investigate the colour gradients across the galaxy (which can be seen in the inset panel of Fig. 1). In each panel of Fig. 5 we show the corresponding g-r and u-r colours determined from the SDSS imaging data. Both the spectroscopic and imaging data show the colour gradient across the galaxy with panels [1,2&4],[3,5&7] and [6,8&9] having average g-r colours of , and and u-r colours of , and respectively confirming that changing shape of the continuum seen in the IFU data is real and not simply an artifact of the observations.
The spatial distribution of the young OB stars, as traced by the rest-frame UV continuum, is consistent with that of the [Oii] emission, and offset by 2 kpc in projection from the older stellar population (indicated also by the colour gradient in the imaging). The colour gradient is in approximately the same direction as the surface brightness asymmetry, and suggests that the galaxy consists of at least two components, possibly as the result of a recent merger.
3.2 Emission Line Dynamics
To investigate the dynamics in more detail we return to the datacube and fit the emission and absorption lines on a pixel-by-pixel basis. The [Oii] emission line doublet and underlying (rest frame UV) continuum was fitted using a minimisation procedure. The spectra were averaged over a spatial pixel region, except where the signal was too low to give a significant detection of the line, in which case the smoothing area was increased to pixels. In regions where this averaging process still failed to give an adequate (i.e. the inclusion of an emission line component does not improve the fit), no fit was made. We required a minimum of 25 (S/N of 5) to detect the line, and allow the signal to drop by a of 9 to calculate the error in the velocity. This corresponds to a formal 3 error. In Fig. 6 we show the [Oii] velocity structure. This shows a velocity shear of across 6 kpc in projection . The velocity field of the gas does not resemble that of a disk. However, if one of the progenitors was a gas rich disk, then the observed shear may be arise due residual motion of a gas disk following a merger. Assuming this is the case, we estimate that the mass of the gas-rich progenitor was () 1.21010. This mass estimate should be viewed as a lower limit to the progenitors mass since we may be seeing only a residual part of the motion that the disk had before the encounter.
![[Uncaptioned image]](/html/astro-ph/0412088/assets/x6.png)
Left: The UV continuum intensity (colour scale) with the continuum from the older stellar population overlaid as contours. Right: Two dimensional velocity field of the galaxy derived from the [Oii] emission line. The galaxy shows a shear across the galaxy with peak-to-peak velocity difference of .
3.3 A-type stars
To investigate the EWs of the short-lived A- stars we turn to the H and H absorption lines. Using a similar procedure as used to fit the [Oii] emission features we simultaneously fit the H and H absorption features (with a fixed separation but variable intensity and width) and show the resulting two dimensional distribution of EWs in Fig. 7. We estimate the 1– uncertainties by perturbing all of the parameters of the best fit such that . From the distribution of EWs it is clear that the A- star population is most prominent at the same location as the old stellar population, but also has a large contribution near the peak in the [Oii] distribution. Whilst the two peaks in the distribution of EWs in the galaxy are statistically significant, we note that systematic uncertainties such as emission line filling of the H and H absorption lines may cause the EW to appear artificially low. We therefore attach little significance to the ‘double peaked’ distribution of EWs, but rather note that the distribution of A-stars in the galaxy is widespread. This is particularly important for understanding the formation of the A-star population since it suggests that the A-stars are not formed from gas funnelled into the nucleus but rather from material which is much more widespread.
![[Uncaptioned image]](/html/astro-ph/0412088/assets/x7.png)
Two dimensional map of the equivalent widths of the H+H absorption lines. This shows two peaks in the EWs, one at the peak location of the old stellar population, and one at the peak location of the younger OB stellar population. The contours are spaced by 1– found by varying the fit such that .
To obtain the velocity structure of the A-type stars, the spectra from the 9 spatial bins in Fig. 5 are cross-correlated with a template star of type A2V. The absorption line velocities in individual panels are shown in Fig. 5, with the zero-point defined such that the A-stars in the middle panel have zero velocity. The A-stars velocity field appears to have a shear in the same direction of the gas, although the lines have a greater intrinsic width and therefore the large error bars preclude any stronger conclusion.
We can obtain an estimate of the age of the A-star population by comparing the average galaxy spectrum with the spectral library of Jacoby et al. (1984). The strength of the K-line at Å is especially sensitive to the spectral type of the early A-type stars (Rose 1985). Based on the relative strength of the K-line and the neighbouring H+H line at Å the galaxy spectrum best resembles that of an A2 star (hence the choice of the A2 stellar template for cross correlation above). Taking the effective temperature of an A2 dwarf to be 9100 K (di Benedetto 1998), and interpolating the theoretical isochrones of Bertelli et al. (1994) we arrive at an estimate of 0.44 Gyr for a MS turnoff at A2. Likewise, the ages for A1 and A3 dwarfs are estimated to be 0.39 and 0.47 Gyr respectively although stellar mixes and metallicity makes this estimate uncertain.
4 Discussion and Conclusions
We have selected one field galaxy from the SDSS which shows strong Balmer absorption lines (which are indicative of a strong A- star population), but has only a small ongoing star-formation rate. In this pilot study, we have demonstrated the ability of IFU observations to disentangle the spatial and velocity distributions of the stellar and gaseous components through the measurement of both emission and absorption features.
The main results are summarised as follows:
-
1.
The SDSS images show a bright nucleus and more diffuse material distributed asymmetrically toward the north (Fig. 1). The disturbed morphology of the field galaxy SDSSJ 101345.39 is suggestive of an interaction (or merger) between two galaxies.
-
2.
The continuum from the older stellar population is spatially offset by 2 kpc from the young, hot OB stars (traced from the rest-frame UV continuum) and is easily seen from the changing shape of the continuum across the spatial domain of the datacube in the IFU observation (Fig. 5). This colour gradient is also reflected by the strong colour gradient seen in the SDSS imaging.
-
3.
By extracting narrow-band slices of the emission and absorption lines in the the GMOS IFU datacube, we find that the gas (traced through the [Oii] emission line) is spatially extended with an elongated morphology, approximately coincident with the young, hot, OB star population (Fig. 3).
-
4.
The and absorption lines are widely distributed (Fig. 3). The peaks of these absorption lines are spatially co-incident with the older stellar population and the centre of the gas. The A-star population are not confined to the nuclear regions. Their spatial distribution is different from that of the [Oii] emission, but the two appear related.
-
5.
The gas has a velocity shear of across 6 kpc in projection (Fig. 6), but the velocity field does not resemble that of a disk. However, assuming that the velocity shear arises due to residual motion of a gas disk which has been disturbed as the result of an interaction, we estimate that the gas rich progenitor had a dynamical mass of at least . This mass estimate should be viewed as a lower limit since some of the angular momentum of the gas-rich progenitor may have been lost during the interaction.
-
6.
The A-stars do not show the same amplitude of velocity motion as the gas, however, there is evidence of a 40 shear in approximately the same direction as the velocity motion of the gas (although the large error bars preclude any strong conclusions).
Our observations suggest that the activity in SDSS J102145.39 may be the result of a strong tidal interaction between a passive (possibly elliptical) galaxy (giving rise to the old stellar population), and a gas-rich, star-forming (spiral or irregular?) galaxy (giving rise to the spatially offset of hot stars and nebular emission). The interaction between the two components is likely to have been responsible for the production of the A-star population in a burst of star formation.
By comparing the galaxy spectrum with spectral libraries and stellar population models (Jocoby et al. 1984, Vazdekis & Arimoto 1999) we estimate an burst age of 0.5Gyr although we caution that systematic uncertainties such as hidden emission, differing metallicities and pollution of K- type stars make this estimate uncertain. Unfortunately the wavelength coverage of our GMOS data do not extend to Mgii or H, making it difficult to constrain the underlying old population or dust absorption. Future observations at these wavelengths would allow us to trace the dynamics and metallicities of the old stars and further constrain the burst age, as well as locate the position of any possible AGN (which may be important for understanding black hole growth in these galaxies).
We can estimate the mass of the underlying old population from the -band magnitude (K=13.2+/-0.001, Balogh et al. 2004) and assuming a canonical value of 1.0 for the stellar mass-to-light ratio (Bruzual & Charlot 2003). We estimate that the total stellar mass is . It is interesting to contrast this with the mass of the young A-star population, and the current star formation rate. If we assume a Salpeter IMF (Salpeter 1955), we can estimate the mass of the burst population by comparing the equivalent width of H (7.5Å) with the models of Shioya et al. (2004). In order to produce absorption of this strength, their models require a burst population of at least by mass (ie., ). We note that this agrees well with the lower limit on the dynamical mass that we estimated from the velocity shear in the [Oii] emission (we note that it is difficult to place an upper limit on the mass of the gas rich progenitor). If the burst mass fraction was skewed towards higher mass stars, the burst mass could be a factor lower. The current residual star formation rate inferred from the [Oii] flux is (Kennicutt 1998), so that in 0.5Gyr, a mass of only would be converted into stars. Thus it seems that the residual star formation is at least 1/100th of the rate during the burst, while the mass involved in the burst is about 1/10th of the mass of the old stellar population.
The spectra, morphological information and kinematics of SDSSJ 121345.39 appears very similar to local field E+A galaxy NGC 2865 (Hau, Carter and Balcells 1999) in which a 0.4–1.2Gyr old burst has occurred due to the merger of a gas-rich (Sb or Sc) spiral and an elliptical galaxy. A quantitative discussion of the star-formation truncation mechanism will have to wait until we have a statistically significant sample, but we can outline the possibilities which cause this process. Competing models for E+A galaxy formation predict very different distributions of stellar populations following the interaction. In SPH simulations for mergers between spiral and elliptical galaxies the gas tends to sink to the galaxy centre on timescales much less than the starburst duration, and therefore suggest that the gas and A-stars should be centrally concentrated and segregated away from the older stellar population (e.g., Hernquist & Weil 1992) (although these models do not take into account the hot ISM in the elliptical). However, other models suggest that the gas in the progenitor should be clumpy (in molecular clouds) rather than distributed as a smooth medium, and the result of the merger is to scatter these star forming regions across the galaxy (compressing/squeezing the gas and causing the A-star starburst as the interaction occurs). As the gas clouds scatter either in the spiral arms of the progenitor or in the new ICM, they evaporate and the star formation is truncated as the density of the clouds falls (eg.Mahos & Hernquist, 1996, Kojima & Noguchi 1997). In our pilot study we have shown that the A-stars are widely distributed across the galaxy, which coupled with the spatially extended morphology of the gas suggests a clear preference for the latter model.
Although these observations show a clear preference for the squeezed cloud model it is not yet clear that this is true for the HS galaxy population as a whole. The next step is to generate a statistically useful sample of such galaxies, in a variety of environments, to be able to generalise our conclusions and investigate the star-formation rate of the present day Universe. This is important for constraining current models for galaxy formation in which these HS galaxies may represent an important phase in the evolution of todays local luminous spheroidal galaxies.
References
- (1) Abazajian, K. et al. (The SDSS Collaboration) 2004, AJ, submitted
- (2) Balogh, M. L., Morris, S. L., Yee, H. K. C., Carlberg, R. G., Ellingson, E., 1999, ApJ, 527 54
- (3) Balogh, M. L., Miller, C., Nichol, R., Zabludoff, A., Goto, T., 2004, ApJ submitted
- (4) Bartholomew, L. J., Rose, J. A.; Gaba, A. E., Caldwell, N., 2001 AJ, 122 291
- (5) Bertelli, G., Bressan, A., Chiosi, C., Fagotto, F., Nasi, E. 1994, A&AS 10 275
- (6) Bruzual, G., & Charlot, S. 2003, MNRAS, 344 1000
- (7) Bothun, G. D., & Dressler, A. 1986, ApJ, 301 57
- (8) Caldwell, N., Rose, J. A., Dendy, K., 1999 AJ, 117 140
- (9) Couch, W. J., & Sharples, R. M., 1987, MNRAS, 229 423
- (10) di Benedetto, G. P., 1998 A&A, 339 858
- (11) Dressler, A., & Gunn, J. E., 1982, ApJ, 263 533
- (12) Glazebrook, K., & Bland-Hawthorn, J., 2001, PASP, 113 197
- (13) Goto, ., Nichol, R. C., Okamura, S., Sekiguchi, M., Miller, C. J.; Bernardi, M., Hopkins, A., Tremonti, C., Connolly, A., Castander, F. J. et al. 2003, PASJ, 55 771
- (14) Hau, G. K. T., Carter, D., Balcells, M. 1999 ApJ, 206, 437
- (15) Hernquist, L., & Weil, M. L., 1993, MNRAS, 261 804
- (16) Jacoby, G. H., Hunter, D. A., Christian, C. A., 1984, ApJS, 56 257
- (17) Kennicutt, R. C. 1998, ARA&A, 36, 189
- (18) Kojima, M., Noguchi, M., 1997, ApJ, 481 132
- (19) Lavery, R. J., & Patrick, J. P., 1988, ApJ, 330 596
- (20) Liu, C. T., Kennicutt, R. C. Jr, 1995, ApJ, 450 547
- (21) Mihos, J. C., Hernquist, L., 1996, ApJ, 464 641
- (22) Norton, S. A., Gebhardt, K., Zabludoff, A I., Zaritsky, D., 2001, ApJ, 557 150
- (23) Poggianti, B. M.; Smail, I., Dressler, A., Couch, W J., Barger, A J., Butcher, H, Ellis, R. S., Oemler, A., 1999, ApJ, 518 576
- (24) Rose, A. J., 1985 AJ 90 1927
- (25) Salpter, E. E., 1955, ApJ, 121 161
- (26) Shioya, Y., Bekki, K., Couch, W. J., 2004, ApJ, 601 654
- (27) Vazdekis, A., Arimoto, N. 1999, ApJ, 125 144
- (28) Vazdekis, A. 1999, ApJ, 513 224
- (29) Yang, Y., Zabludoff, A. I., Zaritsky, D., Lauer, T. R., Mihos, J. C., 2004, ApJ, 607 528
- (30) Zabludoff, A. I.; Zaritsky, D., Lin, H., Tucker, D., Hashimoto, Y., Shectman, S A., Oemler, A., Kirshner, R. P. 1996, ApJ, 466 104