Abstract
The latest cosmological observables analyses seem to converge to a concordant view of the cosmological model: namely the power law -CDM. The recent WMAP results comfort this new standard model. Nevertheless, some degeneracy in the CMB physics do not allow one to exclude alternative models. A combined analysis with other cosmological observations is thus needed. An example of such work is shown here, focusing on the abundance of local clusters. The latter is a traditional way to derive the amplitude of matter fluctuations, but which suffers from a lack of accurate knowledge of their masses. Here we show that the mass temperature relation can be specified for any cosmological model from consistency arguments, removing most of this uncertainty. This allows to obtain an estimation of the amplitude of matter fluctuations with an accuracy of 5%. Quite remarkably, this amplitude can be also tightly constrained from existing CMB measurements. However, the amplitude inferred in this way in a concordance model (-CDM) is significantly larger than the value derived from x-ray clusters. Such a discrepancy may reveal the existence of a new dark component in the Universe. It may alternatively reveal a significant depletion of the gas during the formation of clusters. In all cases, an essential element of clusters formation history seems to be missing.
keywords:
Cosmology – CMB – Clusters of galaxy – Parameter estimationNew Physics In Clusters of Galaxy
A New Dark Matter Component ?
Introduction
The cosmological scenario seems more and more well defined. Recent cosmological analyses have lead to the so-called concordance model. The latter passes a lot of cosmological tests. Nevertheless, some observations seem not to be concordant. Furthermore, constraints on the concordance model are obtained in some (well motivated) particular framework. Some alternatives are thus still possible and the conclusions may be drawn with care. In a first section we will examine the concordance model through the constraints and degeneracies given by the study of CMB anisotropies on cosmological parameters. We then show how some combined analyses of different cosmological observations could lead to a more precise view of the concordance model. After few remarks on the dark matter candidates, we will focus on the amplitude of fluctuations and the need for new physics (or dark matter component) to reconcile clusters and CMB constraints.
1 The concordance model
From CMB
Constraints
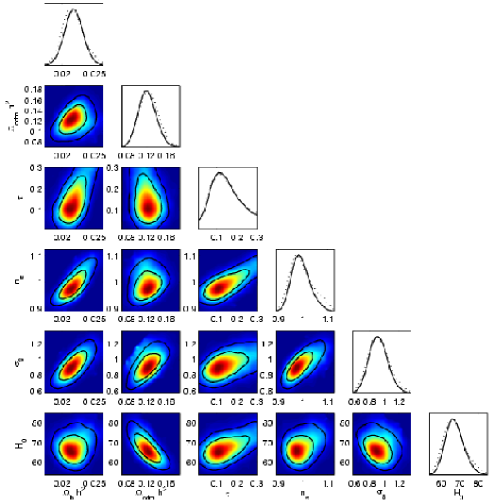
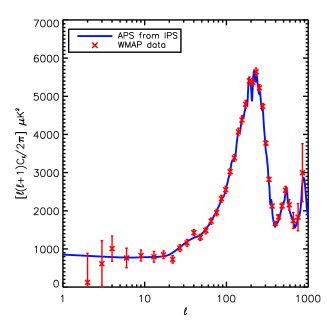
The CMB anisotropies observations are used since their discovery in the early nineties by COBE-DMR to put constraints of cosmological parameters. The detection of the Sachs-Wolfe plateau in the angular power spectrum (APS hereafter) in 1992 allows one to put constraints on the shape of the initial power spectrum (IPS hereafter) of fluctuations by constraining its amplitude and slope [22]. Then the first hint for the presence of a first acoustic peak in the APS around the degree scale (multipole moment ) was enough for excluding low density models (open models) and comforting inflationary predictions for a flat Universe (no curvature) [33]. Then new observations were made from ground, balloon and recently satellite again, with a large range of instruments, strategies, frequencies, resolutions. All these data were used progressively to make better and better constraints on cosmological parameters. Today around thirty experiments have observed the microwave sky and the last one opens a new generation of observation. WMAP 2003 release (first release) marked a step in CMB anisotropies studies [60]. The APS derived from full sky maps both in temperature and in cross-polarization helped in constructing a better convergence to the new standard -CDM model. WMAP becomes a reference by constraining most of the cosmological parameter by itself. Such result, shown in table 1 and Figure 1, was obtained in the following framework: a cosmic scenario in which the anisotropies are due to some Gaussian random and adiabatic fluctuations evolving in a cold dark matter and dark energy dominated (topologically trivial) Universe, in which the initial power spectrum is a power law caracterised by its amplitude () and slope (). Further hypothesis (or priors on the parameters) assumed are summarized in Table 1. In such (well motivated) scenario, most of the errors on the cosmological parameters are smaller than 10%.
| \sphlineParameter | symbol | Value with errors | Hypothesis |
|---|---|---|---|
| \sphlineBaryon density | |||
| Dark matter density | |||
| Hubble constant | |||
| Optical depth | |||
| Spectral index | |||
| \sphline |
captions,table
Degeneracies
Even in such well defined scenario some degeneracies remain. Some parameters have the property of changing the APS, when varying, in an opposit manner from other (combinations of) parameters at first order. For example, an early reionisation will suppress power at smale scales in the temperature APS, whereas a blue power spectrum (index bigger than 1) will enhance the power at small scale relative to the large scales. Even at WMAP sensitivity, such effects are still visible (elongated ellipses in Figure 1).
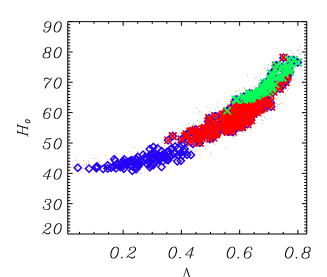
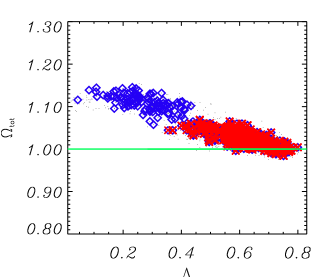
If some of the hypothesis made in the above scenario are relaxed more degeneracies appear. That is the case for the one between the Hubble constant and the total density if the Universe (or curvature) . The Figure 2 shows in blue the confidence intervalles obtained with WMAP in the plane without assumptions on these parameters. In red are the contours when a prior km/s/Mpc is assumed. Such example shows that the CMB by itself do not prove the flatness of the Universe. Nevertheless the CMB data excluded drastically open low density models.
Another kind of degeneracies appear when more freedom is let to the initial conditions. The APS is the result of the evolution in a particular cosmology of some initial conditions such as the IPS. The APS could be written as follows:
| (1) |
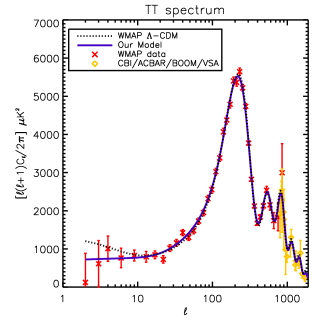
where is the IPS and is the transfer function depending on the cosmological parameters such as the densities, the Hubble constant, etc. As we have seen the “standard” scenario considers power law IPS. If such hypothesis is relaxed, then the constraints on cosmological parameters weaken. Figure 3 show an example from [6] where two APS are drawn over WMAP data. The dotted model is the best power law -CDM model obtained in [51], whereas the blue solid line model in a pure matter dominated flat model () with a IPS caracterised with two different slopes at large and small scales. These two models are thus equiprobable as seed of the WMAP observed APS.
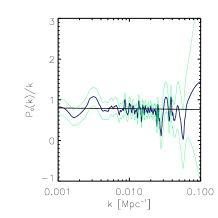
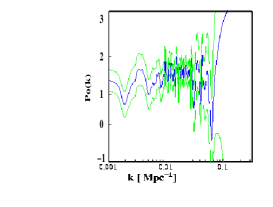
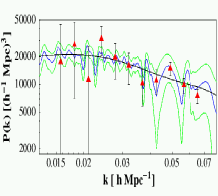
As noted by the WMAP team, few outliers in the observed APS make some strong contributions in the global which is consequently subsequently high. These outliers, expected to be due to some experimental effects not well substracted could also have cosmic origin. Some features in the IPS could for example produce such deviations from the theoretical APS. Under the assumption that these outliers are cosmological signal, Tocchini–Valentini et al. ([53]) have inverted the relation in equation 1 to retrieve the IPS from the APS (by assuming concordance cosmological parameters). The results is plotted in Figure 4 (left). The IPS derived from WMAP (in blue with error bars en green) exhibit deviations from a simple power law (black horizontal line). If such an IPS is now evolved to present time one have the corresponding matter power spectrum that can be confronted to observations. As shown in Figure 4 (center), the deviations in the IPS produce deviations in the matter power spectrum that are in agreement with the features detected by the Sloan Digital Sly Survey (SDSS, [48]) comforting the idea of cosmological origin of the deviations in the WMAP APS. The method used by Tocchini-Valentini et al. could be applied whatever the cosmology is. Given the degeneracy illustrated by Equation 1, one can retrieve a IPS able to fit WMAP for a purely matter dominated Universe. Figure 4 (right) shows the IPS retrieved in such a cosmology ().
The CMB anisotropies studies can bring a lot of information on the cosmological scenario. Strong constraints could be put if a reasonable framework is assumed. Nevertheless, degeneracies remain in more general approaches. The physics of the CMB anisotropy imply degeneracies in the shape of the APS. Moreover, the initial conditions remain degenerated with the evolution of the Universe (see also [12]).
From Combined Analysis
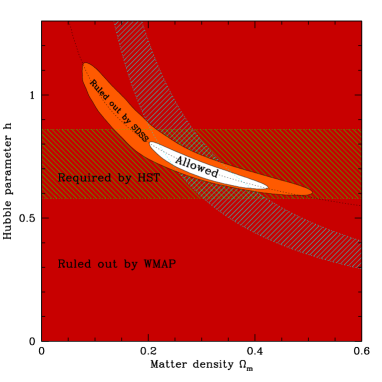
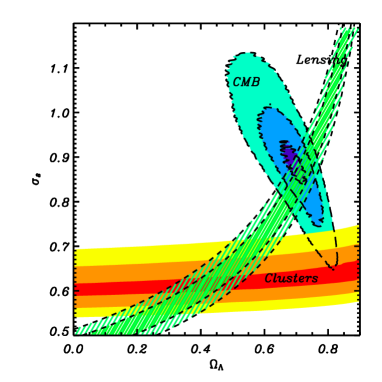
In order to break these degeneracies, one can combine constraints from different observations. Angular distances, shape of the matter power spectrum, Hubble law are not sensitive to the cosmological parameters in the same way as the APS of CMB anisotropies. This allows one to break degeneracies intrinsic to one of the observable. Figure 5 summarizes such a combination. Most of studies implying this kind of combinations converge to the now standard “concordant model” ([15, 52, 51]). Some observations remain nevertheless inconsistent and combining them may lead to other conclusions ([31, 6, 57]). Such an example is given in the next sections.
2 Dark matter
Dark matter is now a major component of the cosmological model. We have direct proofs of existence (rotation curves of galaxy, mass luminosity ratios, or lensing of background galaxy by clusters). This dark matter is probably non baryonic (massive compact halo objects search seems to indicate that such dark matter could only contribute to 20% of the total mass of clusters [1, 61]) and may contribute to 25% of the total density of the Universe (with 5% of baryons and 70% of dark energy in the concordance model).
This dark matter could be cold (few GeV, and non relativistic at galaxy formation), warm (few keV) or hot (few eV and relativistic at galaxy formation). Few candidates can be classified as follows ([21]): existing (light neutrinos),well motivated (heavy neutrinos, neutralinos, axions) and other (self-interactive particles, wimpzillas, …). Recent experiments have put a lower limit on the mass of the neutrinos ([30]). On the other side, heavy neutrinos have not been detected in laboratory, and the shape of the matter power spectrum from CMB and galaxy surveys ([52]) sets an upper bound to the mass of such particles. From these limits one can deduce the cosmological contribution of neutrinos in the energy density budget:
whereas the total dark matter contribution is . Neutrinos (light or heavy) can not therefore explain the full dark matter content. The next well motivated candidate is the neutralino (cold dark matter). It is the lightest supersymetric particle. It has not been detected yet but recent experiments (from cosmology or particle physics) could not exclude it. See [21] for a better an more complete review of non baryonic dark matter and [8] for alternatives to the supersymetric candidates.
3 The amplitude of fluctuations
The amplitude of matter fluctuations in the present-day universe is an important quantity of cosmological relevance. The abundance of clusters is an efficient way to evaluate this quantity, commonly expressed by , the r.m.s. amplitude of the matter fluctuations on the scale. This quantity can also be determined by the study of weak lensing shear or as a derived parameter from CMB analysis. The determination of has gained some tension because the amplitude of matter obtained from clusters with hydrostatic equation leads to low values ([35, 41, 49])while WMAP obtained recently ([51]).
From CMB
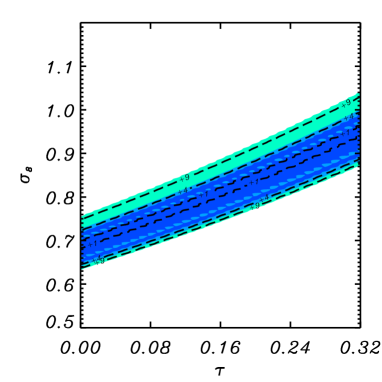
WMAP team determination of cosmological parameter lead to the concordance model. Such a model, normalized to CMB scales imply a value of the amplitude of fluctuations . This quantity is related to the amplitude of the APS in temperature around , whatever the shape of the IPS ([6]). However, some degeneracies may alter this “first order” assumption. Some physical processes which lower the power of fluctuations at small scale may lower the value of . This is the case of the reionisation of the Universe (or the presence of neutrinos). Figure 7 shows the degeneracy between the optical depth of reionisation () and the amplitude of fluctuations () when only the temperature APS is considered (which means no constraints on ). For a Universe in a concordance model but without reionisation, the amplitude of fluctuation can be as low as . The cross power spectrum (temperature–polarisation E) of WMAP contains a signature at large scale of an early reionisation. This suggests a value of quite high leading to the value of quoted by [51]. This signature is nevertheless weak because some galactic foregrounds contamination may play a role at these scales. The full polarized spectrum (E–E), released soon, may clarify this.
From weak lensing shear
From Clusters of Galaxy
A statistical precision of few % on is possible from existing samples of x-ray clusters, but in practice the relation between mass and temperature is needed for such evaluation:
| (2) |
This value of has been estimated from x-ray properties of clusters by different methods, essentially hydrostatic equation on one side and numerical simulations on the other side, which lead to sensitively different normalizations (from to ).
We have shown in [5] a third way to derive the value of that we called self-consistent.
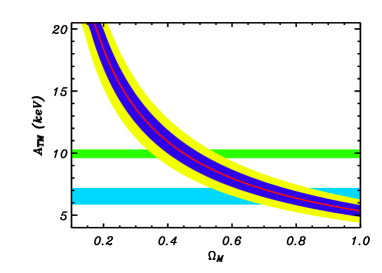
Clusters are useful cosmological probes in several important ways. Their baryonic fraction can be inferred from observations: . Under the assumption that the baryonic and dark matter amounts are representative of the universe, the baryon fraction can be related to the cosmological parameters density and : where is a numerical factor that has to be introduced in order to correct for the depletion of gas during cluster formation and which can be determined only from numerical simulations ([59]). In practice a good working value, at least in the outer part of clusters, is ([20]). The baryonic content of the Universe is now known quite accurately through WMAP and other CMB measurements (, [51]) the statistical uncertainty being doubled in order to account for differences in various priors) essentially consistent with the abundance of Deuterium ([29]) and with the baryonic content of the IGM ([54]). We can furthermore assume the following relation given by the position of the first Doppler peak in the CMB APS ([37]): . Then, if we consider a sample of clusters around 4 keV from which we know the baryon mass ([55]) we can rewrite Eq. 2 as: , plotted in Figure 7 (red solid line with error bars envelops). From there we conclude that varies with and is consistent with the baryon fraction in clusters whatever the cosmology is, contrarily to the previous determinations (horizontal shaded regions).
Knowing the mass-temperature relation and its uncertainty we can determine the amplitude of matter fluctuations by fitting the local temperature distribution function and assuming a -like spectrum with . Here we use the Sheth and Tormen (1999) mass function and a sample of x-ray selected local clusters ( erg/s/cm2 and , [7] updated from BAX, [47]). The result is shown as lines in Figure 8. As one can see, at a given value of the amplitude of is well constrained. Furthermore to the first order the best is independent of ( for . interestingly close to the value obtained by [58]: ). Our conclusion appears somewhat surprising as it differs from standard analyzes based on a fixed normalization , which cannot account simultaneously for the baryon fraction in a consistent way for arbitrary .
Evidence of New physics
In the following we use the constraint on in a concordance model obtained from the CMB fluctuations analysis including the temperature–polarization cross power spectrum (TE) by the WMAP team. The comparison of the value of from CMB data with the one from clusters is revealing a critical discrepancy among the two measurements (Figure 8). It is clear that within any model with the amplitude of we derived from clusters is significantly smaller than what is expected from the CMB alone ().
As mentioned before, an accurate knowledge of is critical to properly evaluate the amplitude of matter fluctuations in the concordance model.
Here above, we have considered models in which the dark matter is only made of cold dark matter, the dark energy being a pure cosmological constant (in term of the equation of state of vacuum , this means ), and that x-ray gas and known stars are the only existing baryons in clusters.
A first possibility to investigate is to examine whether a different equation of state for the vacuum, so-called quintessence, might solve this discrepancy. We have therefore investigated flat models with arbitrary and quintessence content . Indeed combinations of CMB and clusters data are known to provide tight constraints on such models ([15]). With the approach developed here, models which were found to match CMB and clusters were found to satisfy the following constraints: and . Such models are currently at odds with constraints on quintessential models ([15, 52, 42]) resulting from combination of various data including the supernovae type Ia data. We have therefore to turn toward more drastic paths to solve the above issue.
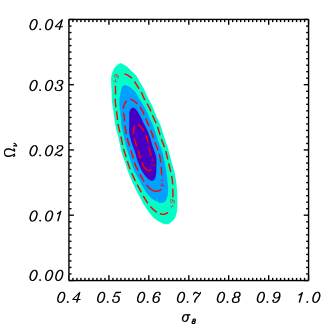
In the following, we examine whether the introduction of an additional component of the dark matter content of the universe would allow to remove the above discrepancy. Neutrinos are known to exist and to be massive, so perhaps the most natural massive component of the universe to be introduced is in the form of a neutrino contribution. This solution has already been advocated in order to solve this discrepancy in an Einstein de Sitter Universe ([16, 6]). Indeed the presence of a light, but non-zero, component of the dark matter modifies significantly the transfer function of primordial fluctuations which results in a lower amplitude on small scales. Given existing measurements of mass differences we consider only the case where the masses are equal. Within a concordance model (, ) by combining the constraints from CMB and clusters data, and marginalizing on (, , , ) we found that a contribution of is preferred with a significance level, well above 3 (see Figure 9a), improving the significance of such possible evidence compared to Allen et al (2003). This confirms that the presence of a small contribution of neutrinos, with a typical mass of .25 eV, to the density of the universe allows to reconcile the amplitude of matter fluctuations from clusters with the one inferred from CMB data. We notice that such value is above the upper limit inferred by the WMAP team using a combination of several astronomical data ([51]). Finally, weak shear estimations have provided measurements of the amplitude of matter fluctuations which not favor such a solution.
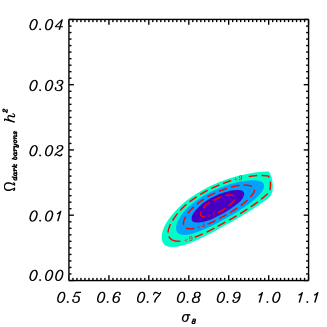
We are therefore left with the conclusion that our initial assumption that baryons in clusters are fairly representative of baryons in the universe is unlikely and therefore that the observed amount of baryon in clusters does not reflect the actual primordial value (a possibility that has been advocated by [17]). Several mechanisms could lead to this situation: the most direct way could be the fact that a significant fraction of the baryons are in a dark form, either in the Universe or in clusters (for instance either in the form of Macho’s, or in a large gaseous unidentified component, [9]), or that a significant fraction of the baryons has been expelled from clusters during their formation process. In such cases, the observed is biased low. The actual mass of clusters can then be obtained assuming a depletion factor implying that represents the missing baryons. Again the combination of CMB and clusters constraints allow to evaluate the amplitude of . From Figure 9b, one can see such a component, should represent nearly half () of the primordial baryon in order to solve the discrepancy. Although heating processes are advocated in order to account for observed properties of x-ray clusters, they currently do not lead to such a high level of depletion ([4]).
4 Summary
We have seen how the concordance model seems to fit pretty well the CMB power spectrum data, as well as a combination of other cosmological observations. But it is also noticeable how much some degeneracies may unable one to give strong constraints on cosmological parameters. Furthermore, all the observations are not concordant. The determination of the amplitude of matter fluctuations within pure cold dark matter models, using two methods, namely the CMB and the local clusters abundance, leads to two surprising significantly different values. There are several ways out to solve out this discrepancy, although each of them represents a noticeable difference with the standard concordance model. The existence of a non-baryonic dark component, like a neutrino contribution, would allow to solve this discrepancy, although such a solution leads to a low value of which is not favored by some other evidences. If the actual value is actually larger, , the unavoidable conclusion is that the baryonic content of clusters is not representative of the Universe. In this case, an astrophysical solution could be that baryons in clusters could be in a dark form, or at least undetected until now. Alternatively, baryon in clusters could have been severely depleted implying that the actual value is much smaller than the value we used above, the apparent baryon fraction being biased low compared to the actual primordial value. Finally, several observations might help to clarify this issue: the above conclusion relies on the actual value of the optical depth found by WMAP. Other sources of informations on will also obviously put light on this issue: weak lensing can potentially allow to measure directly the actual amplitude of matter fluctuations with a similar precision to what has been obtained here with clusters, provided that systematic uncertainties are fully understood. Other direct measurements of the amplitude of matter fluctuations like those derived from the Lyman– forest power spectrum ([14]) could also bring light on this issue. It is remarkable that some of these observations that are expected in the near future will potentially bring fundamental informations on clusters physics or alternatively may reveal the existence of a previously unidentified type of dark matter with as low as 0.01.
Acknowledgements.
This research has made use of the X-Rays Clusters Database (BAX) which is operated by the Laboratoire d’Astrophysique de Toulouse-Tarbes (LATT), under contract with the Centre National d’Etudes Spatiales (CNES)1
References
- [1] Afonso, C., et al. 2003, A&A, 400, 951
- [2] Allen, S. W., Schmidt, R. W., & Bridle, S. L. 2003, MNRAS 346, 593
- [3] Bacon D., Massey R., Refregier A., Ellis R., 2003, MNRAS, 344, 673
- [4] Bialek, J. J., Evrard, A. E., & Mohr, J. J. 2001, ApJ, 555, 597
- [5] Blanchard, A., & Douspis, M. 2004, A&A in press, astro-ph/0405489
- [6] Blanchard, A., Douspis, M., Rowan-Robinson, M., & Sarkar, S. 2003, A&A 412, 35
- [7] Blanchard, A., Sadat, R., Bartlett, J. G., & Le Dour, M. 2000, A&A, 362, 809
- [8] Boehm, C., Fayet, P., & Silk, J. 2004, PhrvD, 69, 101302
- [9] Bonamente, M., Joy, M. K., & Lieu, R. 2003, ApJ 585, 722
- [10] Brown M., Taylor A., Bacon D., Gray M., Dye S., Meisenheimer K., Wolf C., 2003, MNRAS, 341, 100
- [11] Bryan, G.L. & Norman, M.L. 1998, ApJ 495, 80
- [12] Bucher, M., Dunkley, J., Ferreira, P. G., Moodley, K., & Skordis, C. 2004, Physical Review Letters, 93, 081301
- [13] Chang T.-C., Refregier A., Helfand D. J., Becker R. H., White R. L., 2004, ApJ submitted, astroph/0408548
- [14] Croft, R.A.C. Weinberg, D.H., Katz, N., Hernquist, L. 1998, ApJ 495, 44
- [15] Douspis, M., Riazuelo, A., Zolnierowski, Y., & Blanchard, A. 2003, A&A 405, 409
- [16] Elgarøy, Ø. & Lahav, O. 2003, Journal of Cosmology and Astro-Particle Physics, 4, 4
- [17] Ettori, S. 2003, MNRAS 344, L13
- [18] Evrard A. E., Metzler C. A. & Navarro J. F., 1996, ApJ 469, 494
- [19] Fosalba, P., Szapudi, I., 2004, ApJ in press, astro-ph/0405589
- [20] Frenk, C.S, White, S.D.M et al. 1999, ApJ 525, 554
- [21] Gondolo, P., 2004, astro-ph/0403064
- [22] Gorski, K. M., Hinshaw, G., Banday, A. J., Bennett, C. L., Wright, E. L., Kogut, A., Smoot, G. F., & Lubin, P. 1994, ApJL, 430, L89
- [23] Grainge, K., et al. 2003, MNRAS 341, L23
- [24] Hamana T., Miyazaki S., Shimasaku K., Furusawa H., Doi M., Hamabe M., Imi K., Kimura M., Komiyama Y., Nakata F., Okada N., Okamura S., Ouchi M., Sekiguchi M., Yagi M., Yasuda N., 2003, ApJ, 597, 98
- [25] Heymans C. et al., 2004, astroph/0406468
- [26] Hinshaw, G., et al. 2003, ApJ supp., 148, 135
- [27] Hoekstra H., Yee H., Gladders M., 2002, ApJ, 577, 595
- [28] Jarvis M., Bernstein G., Jain B., Fischer P., Smith D., Tyson J., Wittman D., 2003, ApJ, 125, 1014
- [29] Kirkman, D., Tytler, D., Suzuki, N., O’Meara, J. M., & Lubin, D. 2003, ApJS 149, 1
- [30] Klapdor-Kleingrothaus, H. V., Krivosheina, I. V., Dietz, A., & Chkvorets, O. 2004, Physics Letters B, 586, 198
- [31] Kochanek, C. S. & Schechter, P. L. 2004, Measuring and Modeling the Universe, 117
- [32] Kuo, C. L., et al. 2004, ApJ 600, 32
- [33] Lineweaver, C. H., Barbosa, D., Blanchard, A., & Bartlett, J. G. 1997, A&A, 322, 365
- [34] Massey, R., Refregier, A. Bacon, D., Ellis, R. 2004, astroph/0405457
- [35] Markevitch, A. 1998, ApJ 504, 27
- [36] Navarro, J. F., Frenk, C. S. & White, S. D. M. 1995, MNRAS 275, 720 (NFW)
- [37] Page, L., et al. 2003, ApJS 148, 233
- [38] Pearson, T. J., et al. 2003, ApJ 591, 556
- [39] Refregier, A. 2003, ARA&A 41, 645
- [40] Refregier A., Rhodes J., Groth E. J., 2002, ApJL, 572, L131
- [41] Reiprich, T. H., & Böhringer, H. 2002, ApJ 567, 716
- [42] Riess, A.G. et al. 2004, ApJ 607, 665
- [43] Rhodes J., Refregier A., Collins N. R., Gardner J. P., Groth E. J., Hill R. S., 2004, ApJ, 605, 29
- [44] Roussel, H., Sadat, R. & Blanchard, A. 2000, A&A 361, 429
- [45] Ruhl, J. E., et al. 2003, ApJ 599, 786
- [46] Sadat, R., & Blanchard, A. 2001, A&A 371, 19
- [47] Sadat, R., Blanchard, A., Kneib, J.-P., Mathez, G., Madore, B., & Mazzarella, J. M. 2004, A&A, 424, 1097
- [48] www.sdss.org
- [49] Seljak, U. 2002, MNRAS 337, 769
- [50] Sheth, R. K. & Tormen, G. 1999, MNRAS 308, 119
- [51] Spergel, D. N. et al. 2003, ApJS, 148, 175
- [52] Tegmark, M. et al., 2004, astro-ph/0310723, Phys. Rev. D 69, 103501
- [53] Tocchini–Valentini, D., Douspis, M., & Silk, J., 2004, MNRAS in press, astro-ph/0402583
- [54] Tytler, D. et al., 2004, astro-ph/0403688
- [55] Vikhlinin, A., Forman, W. and Jones, C. 1999, ApJ 525, 47
- [56] Van Waerbeke, L., Mellier, Y., Hoekstra, H. 2004, A&A, 393, 369
- [57] Vauclair, S. C., et al. 2003, A&A, 412, L37
- [58] Viana, P. T. P., Nichol, R. C., & Liddle, A. R. 2002, ApJL 569, L75
- [59] White, S.D.M., Navarro, J.F., Evrard, A.E. & Frenk, C. 1993, Nature 366, 429
- [60] lambda.gsfc.nasa.gov/product/map
- [61] Yoo, J., Chanamé, J., & Gould, A. 2004, ApJ, 601, 311