The Transformation of Cluster Galaxies at Intermediate Redshift††thanks: Based on observations carried out at the ESO Very Large Telescope (VLT), Chile, as part of the ESO Large Program LP-166.A-0701 and proposals 69.A-0683 and 72.A-0759.
Abstract
We combine imaging data from the Advanced Camera for Surveys (ACS) with VLT/FORS optical spectroscopy to study the properties of star-forming galaxies in the cluster CL0152-1357. We have morphological information for 24 star-forming cluster galaxies, which range in morphology from late-type and irregular to compact early-type galaxies. We find that while most star-forming galaxies have colors bluer than 1.0, eight are in the red cluster sequence. Among the star-forming cluster population we find five compact early-type galaxies which have properties consistent with their identification as progenitors of dwarf elliptical galaxies. The spatial distribution of the star-forming cluster members is nonuniform. We find none within Mpc of the cluster center, which is highly suggestive of an intracluster medium interaction. We derive star formation rates from [OII] line fluxes, and use these to compare the global star formation rate of CL0152-1357 to other clusters at low and intermediate redshifts. We find a tentative correlation between integrated star formation rates and , in the sense that hotter clusters have lower integrated star formation rates. Additional data from clusters with low X-ray temperatures is needed to confirm this trend. We do not find a significant correlation with redshift, suggesting that evolution is either weak or absent between .
Subject headings:
galaxies: clusters: general, galaxies: clusters: individual (CL0152-1357), galaxies: evolution, galaxies: interactions, galaxies: high-redshift1. Introduction
Galaxy morphology is influenced by environment. This is illustrated at the most basic level by the difference in the morphological mix of galaxies in high density galaxy clusters and low density groups, or the field. In the local universe, the highest density environments of massive cluster cores are composed almost exclusively of early-type galaxies, i.e. ellipticals and lenticulars (S0s), while in the field, gas-rich disks and irregular galaxies dominate. In the lower density field and in low-mass groups, interactions and mergers are linked to enhanced star formation rates and starbursts (Schweizer, 1987; Sanders & Mirabel, 1996; Johnson et al., 1999; Conselice, Bershady, & Gallagher, 2000; Barton, Geller, & Kenyon, 2000; Pustilnik et al., 2001; Homeier, Gallagher, & Pasquali, 2002; Struck & Smith, 2003). It might be expected that ram pressure from a dense intracluster medium (ICM) compresses molecular clouds and triggers a starburst (Bekki & Couch, 2003). Therefore, it is not intuitively clear if gas-rich galaxies infalling into high density clusters would have increased or decreased star formation rates relative to the field. In intermediate redshift cluster samples, the star formation rates of cluster galaxies are suppressed relative to the field, even when the different morphological mix is accounted for (Balogh et al., 1997, 1998; Hashimoto et al., 1998). While the star formation rates in clusters increase as a function of redshift, they are still lower than the star formation rates in the field population at that redshift. The mechanism by which star formation in cluster galaxies is suppressed is still unclear, but there is substantial evidence that suppression, not enhancement, is the dominant outcome (Couch et al., 2001; Ellingson et al., 2001; Postman, Lubin, & Oke, 2001; Lewis et al., 2002; Martínez et al., 2002).
Two of the most widely discussed mechanisms for star formation suppression are ram pressure stripping (Gunn & Gott, 1972), and a more gentle form of galaxy-ICM interaction termed ’starvation’ (Larson, Tinsley, & Caldwell, 1980). Both of these mechanisms may operate with varying degrees of importance, but stripping is expected to quench star formation rapidly ( Myr; e.g. Quilis, Moore, & Bower 2000), whereas starvation leads to a decline in the star formation rate over a longer timescale ( Gyr; e.g. Bekki, Couch, & Shioya 2002). The other mechanism of note is galaxy harassment, where galaxy-galaxy interactions combined with the tidal field of the cluster are expected to lead to strong mass loss and a drastic change in morphology (Moore, Lake, & Katz, 1998).
In the Virgo cluster, ram pressure stripping is the leading explanation for the observation that gas-deficient dwarf galaxies are found in regions of higher X-ray surface brightness (Lee, Richer, & McCall, 2000). Also in Virgo, there is direct evidence for ram pressure stripping of spiral galaxies in the form of HI and “bow-shock” morphology (Vollmer et al., 2004; Kenney et al., 2004). Further evidence for the importance of galaxy-ICM interactions comes from a study by Smith (2003), who found that the hot X-ray halos of cluster early-type galaxies are missing, showing that stripping of gas halos occurs in dense environments. Also, the existence of cluster passive spirals, galaxies with spiral structure but no detected star formation, can also be interpreted as evidence for ram pressure strippping (Goto et al., 2003; Yamauchi & Goto, 2004; Kodama et al., 2004). However, the importance of ram pressure stripping and starvation on the morphology-density relation as a whole has yet to be determined. Due to degenerate outcomes in color-morphology space of vastly different formation scenarios, we must observe at higher redshifts to probe the dominant processes in producing the morphology-environment correlations seen in the present day universe.
CL0152-1357 () was observed as part of an ongoing project with the Advanced Camera for Surveys (ACS) to obtain imaging of intermediate redshift cluster galaxies, with the goal of tracing the evolution of cluster galaxy properties. In this paper we combine morphological information from ACS imaging with ground-based spectroscopy to characterize the population of star-forming cluster galaxies, and to provide constraints on the mechanisms which influence the evolution of the star-forming population in clusters.
We begin our investigation of how the properties of star-forming galaxies depend on environment in § 3 by establishing the morphologies, colors, and locations of our sample galaxies. In § 4 we calculate star formation rates for individual galaxies, and use these to derive an integrated star formation rate for the cluster. We compare this to other clusters at low to intermediate redshift in § 5, and explore relationships with redshift, , and . In § 6 we discuss the possibility that ram pressure stripping is responsible for extinguishing star formation in CL0152-1357, and in § 7 we discuss the likely fate of the star-forming galaxies. In § 8, we present our conclusions.
We use , and km s-1.
2. Observations and Reductions
CL was discovered in three cluster surveys: the Wide Angle ROSAT Pointed Survey (WARPS; Ebeling et al. 2000), the ROSAT Deep Cluster Survey (RDCS, Rosati et al. 1998) and the Serendipitous High-redshift Archival ROSAT Cluster Survey (SHARC; Romer et al. 2000). It is not dynamically relaxed, and contains two massive clusters in the process of merging, both at redshifts of (Demarco, 2003; Demarco et al., 2004). The mass within 1 Mpc is M⊙ from a weak-lensing analysis (Jee et al., 2004). There also appears to be structure in addition to the two massive components. An example of this is a group of red cluster sequence galaxies to the east of the northern component; this structure is also detected in the weak-lensing mass map as well as diffuse X-ray emission.
CL0152-1357 was observed in the F625W, F775W, and F850LP bandpasses (hereafter , , and ) with the ACS (Ford et al., 2002) Wide Field Channel as part of the guaranteed time observation program (proposal 9290). The observations were taken in a mosaic pattern, with 2 orbits of integration in the , , and filters at each of the four pointings. Due to the of overlap between the pointings, the core of the cluster was imaged for a total of 8 orbits in each filter. The data were processed with the pipeline (Blakeslee et al., 2003a, b). Our photometry is calibrated to the AB magnitude system using zeropoints of (), (), and () (Sirianni et al., in preparation). Object detection and photometry was performed by SExtractor (Bertin & Arnouts, 1996) incorporated within the pipeline. A more detailed description can be found in Benítez et al. (2004). We use isophotal magnitudes (MAGISO) for colors and total magnitudes (MAGAUTO) from Sextractor (Bertin & Arnouts, 1996).
The spectroscopic data were taken with the FORS1 and FORS2 instruments on the VLT, and are fully described in Demarco et al. The pixel scale ranges from pixel-1, the spectral resolution from Å pixel-1, the slit widths from , and the seeing was (Demarco et al. 2005). The wavelength coverage was Åor Å. S/N ranged from less than 1 in cases where no continuum was detected, to at Å rest-frame. Redshift completeness fractions were determined by counting the number of galaxies in the field of view within the specified magnitude (color, morphology) limits compared to the fraction of those with redshifts. The sample of 100 field galaxies used in § 3.1 is from the spectroscopic sample of confirmed non-cluster members with redshifts and ACS coverage. This field sample covers the redshift range . Galaxies for spectroscopic follow-up were selected as having photometric redshifts . The redshift selection was not uniform with color, but was biased towards red galaxies. Therefore, the completeness as a function of color, shown in Figure 1, varies by a factor of 2 for blue and red galaxies brighter than .
3. Results
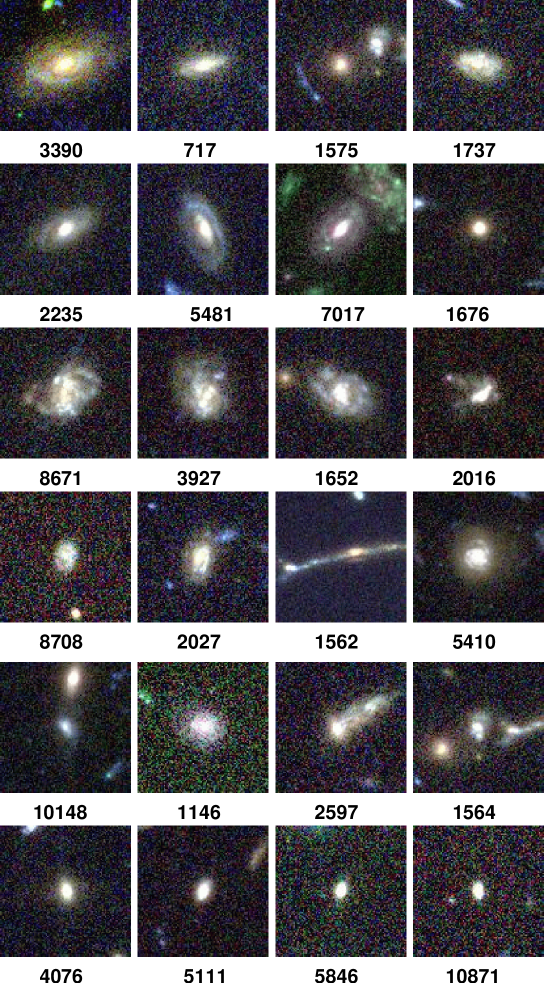
The spectroscopic sample contains 102 cluster members, 33 of which have emission lines indicative of star formation, and 2 are AGN. Emission lines were identified by eye on the 2D spectral images. The weakest [OII] line identified is 12 Å EW. Table 1 lists information for the star-forming galaxies (excluding AGN). We have morphological information for 24 of the star-forming galaxies that overlap with our ACS field. Figure 2 shows color cutouts of the star-forming cluster members.
3.1. Morphology
Morphologies were determined by visual classifications on the T-type system (de Vaucouleurs et al., 1991). All galaxies in the field with magnitude were classified by MP (Postman et al., in preparation). 20% of the galaxies were also classified by MF, NC, and BH to estimate the classification errors. Unanimous or majority agreement was achieved for 75% of objects with . There was no significant offset between the mean classification from the independent classifiers.
Visual morphologies of the cluster members with evidence for ongoing star formation, indicated by the detection of [OII] emission, fall into three categories: red cluster sequence spiral galaxies (Sa and earlier), compact ( kpc) early-type galaxies (), and irregular/late-type spiral galaxies ( ) that are typically expected to have star formation. Only one of the galaxies (2016) is highly disturbed, indicative of a major merger.
In Figure 3 we present histograms of the visually classified morphologies for galaxies with and without emission lines. For the cluster galaxies, we see a clear correlation of morphology with star formation, which is absent in the field sample. Also, the distribution of morphological types is different between cluster and field, with a significant number of disky galaxies in the field sample, and early-type morphologies in the cluster sample.
Five of the star-forming cluster members have early-type morphologies and compact appearances. We fit 2D light profiles to the PSF-convolved images using GALFIT (Peng et al., 2002). The results are shown in Table 2. We fit a single Sersic profile where the surface brightness varies as (Sersic, 1968; Ciotti & Bertin, 1999). A profile with is a de Vaucouleurs profile, and one with describes an exponential disk. We find that these compact early-type cluster members have effective radii ranging from kpc. This is lower than the mean of 3.4 kpc from 53 early-type (T ) cluster member galaxies. Thus, we are able to confirm their visually compact appearance. The low measured values for these compact early-type galaxies is consistent the trend of magnitude and surface brightness profile found for E and dE galaxies in the nearby Universe (Graham & Guzmán, 2003).
None of the early-type galaxies with [OII] is a luminous point source in the 37ks Chandra image. These galaxies have narrow [OII] emission lines, and none has [NeIII] ; broad lines and [NeIII] are typical of active nuclei. For galaxy 1006=10871, we also detect [OIII] and H, and we can apply a diagnostic criteria from Rola, Terlevich, & Terlevich (1997). We find log([OIII]/H)=0.3 and log([OII]/H)=0.6, locating it within the HII galaxy regime, but in a region also populated by LINERs. Thus we cannot rule out an active nucleus origin for the [OII] emission. This applies to all galaxies in our sample, however, these compact early-type galaxies lack properties typical of star-forming galaxies, such as a patchy appearance (indicating the presence of gas and dust).
3.2. Colors of Star-forming Galaxies
In Figure 5 we present a histogram of the values for cluster member galaxies with and without detected star formation. There is a strong segregation in the colors of star-forming and non-star-forming galaxies. While the star-forming galaxies range in color from blue to red, galaxies without detected star formation are almost exclusively red. This leads to the conclusion that with reliable photometric redshifts, a simple color selection to separate the star-forming and passive cluster populations is fairly robust (e.g. Gray et al. 2004). However, such a selection is not well suited to study the overall properties of the star-forming cluster members; there is a small but significant fraction of red star-forming galaxies.
3.2.1 Fraction of Star-forming Red Cluster Sequence Galaxies
The red cluster sequence (RCS) is the prominent red ridge in color magnitude diagrams of large galaxy samples. In low redshift clusters, it is composed exclusively of ellipticals and S0s. However in this galaxy sample we have RCS members with current star formation as indicated by the presence of [OII] emission, also noted in Demarco et al. (2004). To calculate the fraction of RCS galaxies with ongoing star formation, we need the completeness of our spectroscopic survey as a function of magnitude, and the magnitude distribution of the red cluster sequence (RCS) galaxies. The redshift completeness as a function of color is shown in Figure 1. Galaxy selection was biased towards red galaxies. After correcting for color, there was also a % bias towards early-type morphologies, but we will neglect this correction as it is much smaller than the color bias.
To define the red cluster sequence we take all non-stellar objects with and . We iteratively fit a linear relation to this sample with clipping. The color-magnitude relation defining the red cluster sequence for CL0152-1357 is thus
The standard deviation about this relation is 0.07 magnitudes, and we define an object as an RCS member if its deviation is less than , or magnitudes, from this relation. A more detailed explanation of the red cluster sequence will be presented in Blakeslee et al. (in preparation).
The deviation in magnitudes from the RCS, RCS, is given in column 8 of Table LABEL:sfrs. There are 8 galaxies with colors placing them in the RCS. Of the RCS galaxies with spectra, how many show evidence for star formation? There are spectra for 73 RCS cluster member galaxies. Of these 73, 44 are brighter than , and 6 of the 44 have evidence for star formation (%). If we choose a slightly fainter magnitude limit of , then the number of RCS cluster member galaxies with spectra is 65, and 8 have detected [OII] (%).
After correcting for color bias in the redshift incompleteness fractions, there is a slight bias against galaxies with late-type morphologies (T). We conclude that the fraction of RCS galaxies with ongoing star formation in CL is . We note that this is an underestimate, because we have access only to [OII] in emission as our star formation indicator.
3.3. Segregation of Star-forming Galaxies
In Figure 6 we show the Chandra contour map with the positions of the cluster members indicated as solid dots, and the edges of the ACS mosaic as dotted lines. The star-forming galaxies are marked according to their morphology: triangles, squares, and diamonds represent compact galaxies, spirals/irregulars, and RCS spirals. A similar figure without the morphological imformation can be found in Demarco et al. (2004). We find no star-forming galaxies within the main X-ray peaks, that is, within a contour value of 0.3 counts s-1. Considering the area between the two main X-ray peaks as the center, there appears to be a sharp transition around kpc ( kpc from the center of the southern cluster), within which we find almost no star-forming galaxies. We note that if the distribution of cluster galaxies is spherically symmetric, a few might be expected simply from projection effects. However, there are also few spectroscopically confirmed cluster members within kpc to the northwest and southeast of the northern cluster. Therefore, the radius at which this transition occurs is not well constrained by our observations.
4. Star Formation Rates
Star formation rates are derived from [O II] emission line luminosities. There are a few prescriptions for converting [OII] line fluxes to star formation rates (Gallagher, Hunter, & Bushouse 1989, Kennicut 1992, Kewley, Geller, & Jansen 2004). We will use the prescription of Kewley et al. (2004),
This relation was derived using the mean reddening corrected [OII]/H ratio () from the Nearby Field Galaxies Survey (Jansen et al., 2000). Systematic errors in [OII] derived SFRs arise from metallicity and extinction effects. For field galaxies in the nearby Universe, both of these quantities have been shown to correlate with -band luminosity (e.g. Jansen, Franx, & Fabricant 2001). Because we have no information about metallicity or dust extinction, and how these might scale with luminosity for our sample, we have not included these corrections. They should therefore be considered lower limits on the true SFRs. In the next section we assume an average internal extinction of 1 magnitude at H for comparison with other studies. We convert our line fluxes to luminosities by assuming all galaxies are at the cluster distance ().
The emission-line fluxes were measured by fitting single Gaussian profiles interactively using SPLOT in IRAF. We fit several spectra on five separate occasions to estimate errors on our flux measurements due to continuum selection. For the highest line fluxes, the errors were %, while for the lowest, errors approached 20%. Combining this error with the error on the SF prescription, errors on our SFRs range from %. A representative L[OII] error of 10% results in a SFR error of %. EWs were also measured interactively with SPLOT in IRAF on background-subtracted but non-flux calibrated spectra. EWs were estimated as the mean of 5 separate measurements, and the quoted errors are the maximum deviation from the mean measurement.
We can set a limit on the SFR for those galaxies where the [OII] line was not detected. A typical [OII] emission line width for the star-forming galaxies in our sample is 11Å. We set the limit as twice the standard deviation in counts within Å of the wavelength of the redshifted [OII]. We then relate the mean counts to the mean flux to arrive at upper limits for SFRs. These are below 1.0 M for all galaxies (with two exceptions). For comparison, the lowest measured SFR is 0.12 M⊙ yr-1. This reflects the widely varying quality of the spectroscopic sample. The distribution of our SFR limits is shown in Figure 8.
The smallest slit width for the spectroscopic observations is . With the exception of 3 galaxies, the effective radii of all identified star-forming cluster members are less than , and the seeing was , so we do not apply an aperture correction.
4.1. Integrated Star Formation Rate
Due to the small number of galaxies in our sample and redshift completeness effects with color, we choose not to compute the fraction of SF galaxies with density or radius as it is fraught with uncertainty due to selection effects. To minimize discrepancies due to differences in survey characteristics, Finn, Zaritsky, & McCarthy (2004) compared integrated SFRs, which are dominated by galaxies with the largest star formation rates. A comparison of integrated SFRs is more accurate than a fractional comparison. Here we compare the overall star-forming properties of CL0152-1357 to that of other clusters at low to intermediate redshift. The spatial limits of the lower redshift cluster studies determine a limit of for comparison. is the radius where the mean cluster density is 200 times the critical density of the universe, , at that redshift. We write the expression for as
We take as the total projected mass within 1 Mpc: M M⊙ (Jee et al., 2004). For CL0152 at , kpc, or .
In comparing our results we must include corrections for completeness and extinction. Also, because this is a merging cluster, it is not straightforward to choose a cluster center. We discuss these issues in the following sections.
4.1.1 Incompleteness Correction
Compared to an imaging survey, a spectroscopic survey suffers significantly more from incompleteness. We will correct for this using the redshift completeness as a function of color and magnitude, but first we estimate the validity of our incompleteness correction by considering the cluster CL0023, which has spectroscopic narrow-band imaging data. 70% of the star forming galaxies and 65% of the star formation was missed in the spectroscopic survey versus the imaging survey covering the same area (Finn, Zaritsky, & McCarthy, 2004). Correcting for this incompleteness should be the same as correcting for incompleteness in the redshift survey (Lubin et al., 1998). Of the 23 galaxies in the Finn et al. (2004) sample with SFRs M⊙ yr-1 that are matched with spectroscopically confirmed cluster members in the Lubin et al. (1998) sample, 21 are brighter than . The cumulative completeness of the spectroscopic survey is at , and at . Therefore the incompleteness is %, in good agreement with the narrow-band imaging results. Thus, when we compute the normalized integrated star formation rate below, we correct for incompleteness using the redshift completeness function presented in Figure 1.
4.1.2 Extinction Correction
For the galaxies where we detect [OII], our star formation rates are underestimated due to reddening. From the Nearby Galaxies Survey, Jansen et al. (2000) established that there is a luminosity-extinction relation, in the sense that more luminous galaxies have larger . However, the scatter in this relation is large, and it is unclear if intermediate redshift cluster galaxies follow the same relation as the local star-forming population. Therefore, to correct for extinction, we follow convention and assume 1 magnitude of internal extinction at H, (e.g. Balogh & Morris 2000, Couch et al. 2001; Balogh et al. 2002, Finn et al. 2003). This corresponds to magnitudes at using the Galactic extinction law of Cardelli, Clayton, & Mathis (1989). We thus correct our fluxes by a factor of 5.25.
4.1.3 Integrated SFR for CL0152
If we restrict ourselves to , then the choice of a cluster center is an important one. The distribution of cluster galaxies and the X-ray emission are elongated. In the spectroscopic survey, more star-forming galaxies are detected at the southern end of the cluster. In fact, if we choose the center of the northern clump as , then we have no star-forming galaxies within . Our integrated SFR changes from 4.5 M⊙ yr-1 with 5 galaxies, to 5.3 M⊙ yr-1 with 8 galaxies if is between the clumps or on the southern clump. If we were to take instead of , the integrated SFR would not depend significantly on the choice of cluster center, changing at most from 19.1 to 19.9 M⊙ yr-1.
We choose a point between the two massive clusters as the cluster center: 01:52:41.55, 13:57:56.7. Our observed, uncorrected integrated star formation rate is M⊙ yr-1. Next we correct this for incompleteness and extinction. Four of these galaxies have , are brighter than , and have a mean SFR of 1.1 M⊙ yr-1. We measure a cumulative completeness of 0.17 for galaxies with , and 0.23 for galaxies with , so we will use a cumulative completeness of 0.20 for this sample. Then we should have roughly 20 galaxies with a mean SFR of 0.9 M⊙ yr-1. The fifth galaxy has and SFR=0.2 M⊙ yr-1. The cumulative completeness for red galaxies is 0.53, and we do not apply a correction. Thus, the completeness corrected total SFR is 18.2 M⊙ yr-1. We then apply an extinction correction corresponding to 1.8 magnitudes of extinction at [OII]. We thus correct our total SFR by a factor of 5.25, for a total of 96 M⊙ yr-1. The error on this estimate is unlikely to be lower than 20%.
5. A Comparison of Cluster SFRs
To investigate what dominates the star-forming properties of cluster galaxies, evolution or cluster characteristics, in Figure 9 we plot integrated SFRs and the mass-normalized integrated SFRs versus redshift, , and . Cluster parameters are listed in Table 3.
Finn, Zaritsky, & McCarthy (2004) plotted mass-normalized integrated cluster SFRs versus redshift and velocity dispersion, which was intended as a proxy for mass. Kodama et al. (2004) added the cluster CL0024+17 at to this plot. Here we add CL0152 at , and also plot the integrated SFR and the mass-normalized cluster SFR against two quantities that describe the state of the ICM: the X-ray luminosity and the X-ray gas temperature.
We take integrated star formation rates and errors from Finn, Zaritsky, & McCarthy (2004) and Kodama et al. (2004). The integrated star formation rates for A1689, AC114, A2390, CL0024, CL0023, and CL0152 are (Balogh et al., 2002), (Couch et al., 2001), (Balogh & Morris, 2000), (Kodama et al., 2004), (Finn, Zaritsky, & McCarthy, 2004), and M⊙ yr-1, respectively. These numbers were derived from H spectroscopy for A1689 and AC114, and narrow-band imaging for A2390, CL0024, and CL0023. Here we include an incompleteness correction of 2.5 for AC114 from the values presented in Finn, Zaritsky, & McCarthy (2004), and for A1689 adopt the incompleteness and a slit aperture correction of 2.8 from Kodama et al. (2004). Where errors on are not listed, we assume a 10% error.
In the right-hand panels, we divide the integrated SFRs by cluster mass in units of M⊙. We refer to these values as mass-normalized cluster SFRs. For CL0152, CL0024, and AC114 we use the lensing masses of M⊙ (Jee et al., 2004), M⊙ (Kneib et al., 2003), and M⊙ (Natarajan, Kneib, Smail, & Ellis, 1998). For consistency with Kodama et al. (2004) we use M⊙ for A1689 (King, Clowe, & Schneider, 2002), but we note that recent work by Broadhurst et al. (2005) and Zekser et al. (2005) indicate a value of M⊙. This also illustrates the typical uncertanties in mass estimates from lensing analyses. For CL0023 we use the estimate of M⊙ in Kodama et al. (2004). Where errors on mass are not listed, we assume a 10% error.
We find a possible inverse correlation of integrated SFR and , but also note that the scatter is large. Using the non-parametric Spearman rank correlation test, we find a 70%, or , inverse correlation between integrated SFR and . However, this disappears when CL0024 is excluded. For the mass-normalized cluster SFR and , it is more significant, 94%. The trend remains even when CL0024 is excluded. We find no significant correlation between either the integrated SFR and redshift or the mass-normalized integrated SFR and redshift.
CL0024 has the highest integrated SFR of the clusters surveyed so far. It also has the lowest X-ray temperature and X-ray luminosity, but its weak-lensing mass (within ) is similar to CL0152 (within 1 Mpc) and AC114, and it is at a similar redshift to AC114. Considering only these 3 clusters, it appears that it is the ICM that has the dominant effect on star formation in cluster galaxies. However, we caution that until more clusters with low and are observed, such a conclusion is tentative. In fact, it may be that is a more accurate measure of cluster mass than the values derived from lensing analyses, in which case the fundamental correlation is between cluster SFR and cluster mass, with either no or weak evolution between . One possible complication is additional ICM heating from AGN, which may introduce some scatter in the expected TMclus correlation for a virialized system. There is some evidence for a significant AGN population in the cluster MS1054 (Johnson, Best, & Almaini, 2003), and CL0152 has two confirmed AGN associated with the southern clump (Demarco et al., 2004).
Let us briefly review what is qualitatively expected from hierarchical models. Borgani et al. (2002) (see Fig. 6) predict a trend of a rising SFR with redshift until , and a decline thereafter. More massive halos have larger SFRs at high redshift which rise more slowly, peak at higher redshift, and decline more sharply. Around the trend of SFR with halo mass has reversed, with lower mass halos having higher SFRs. There is also a prediction of a larger spread of integrated cluster SFRs with decreasing redshift for clusters that differ in mass, but an overall trend of decreasing cluster SFR with redshift. We do not find evidence for this in our data. We note that if CL0024 is excluded, then there is a tentative correlation of mass-normalized cluster SFR with redshift, however, this arises because in this sample more massive clusters are at lower redshift. Also, “normalizing” the model halos by mass exaggerates the differences in cluster SFRs at these redshifts, and would not give such a correlation. Testing such models must involve observations of many clusters at over a range of cluster masses to look for similarity at intermediate redshifts and strong diversity at low redshifts.
6. Star Formation Extinguishment Mechanism
The segregation of star-forming and passive galaxies in this cluster is striking. That no star-forming galaxies are found within the regions of high ICM density points to a galaxy/ICM interaction as the cause. There are two major contenders in the galaxy/ICM interaction category: ram pressure stripping and starvation. The two are distinguished by the timescale over which they are expected to operate. Ram pressure stripping affects the entire gas supply of a galaxy, disk and halo, whereas starvation only concerns the more loosely bound halo of gas, commonly termed the ’reservoir’, which if left undisturbed, will settle to the disk and participate in star formation. Ram pressure stripping is expected to occur on timescales of a few tens of Myr, and starvation Gyr.
For a comparison with Treu et al. (2003), we estimate, using standard assumptions, the radius at which ram pressure stripping becomes important for a typical infalling spiral galaxy into the southern cluster. We assume a smooth ICM and a density profile of the form
We use the virial radius Mpc, the gas mass within the virial radius M⊙, the core radius, = kpc, and (Maughan et al., 2003). to find M⊙ Mpc-3. Following Fujita & Nagashima (1999), we write the condition for ram pressure stripping as
where is in M⊙ Mpc-3, is in km s-1, and is in cm-2.
With these parameters, the stripping radius for a Milky Way-type galaxy moving at a velocity of 1000 km s-1 relative to the ICM is Mpc. The closest projected star-forming galaxies to the southern clusters are Mpc. Although this is a crude estimate, the segregation of star-forming and non-star-forming galaxies in CL is consistent with an ICM interaction as the dominant mechanism. The crucial distinguishing observation is the time for star formation to be extinguished, which we cannot make here.
7. Evolution of Star-forming Galaxies in CL0152
Each of the red sequence spirals has evidence for a central stellar concentration above an exponential disk, which we will refer to as a bulge. This contrasts with the blue late-type star-forming galaxies, about half of which show no evidence for a bulge. Their red colors cannot be due solely to dust, as they appear smooth while the blue spirals have patchy appearances, a clear indication of a larger amount of dust extinction. The fact that these red spirals are in the red cluster sequence means that the bulk of their stellar population was formed at a similar redshift as the ellipticals that make up the majority of the RCS in this cluster. Given their red color, the presence of a bulge, and their relatively low star formation rates, it is probable that these red sequence spirals will become S0s.
The compact early-type galaxies have rest-frame values from to . A minimum fading of magnitudes from to 0 is expected assuming a single burst population with an age of 3 Gyr at . Adding even a 1% burst with an age of 10 Myr increases the fading to magnitudes, and a burst of 10% to magnitudes. We therefore expect these galaxies to fade to M to . This is consistent with an identification as progenitors of dwarf elliptical galaxies that are populous in present day clusters (Conselice, Gallagher, & Wyse, 2001; Geha, Guhathakurta, & van der Marel, 2003; Jerjen, Binggeli, & Barazza, 2004; Rakos & Schombert, 2004).
These compact early-type galaxies may also be related to “harassed” low surface brightness disk galaxies. The simulations of Moore et al. (1999) explore the effects of galaxy harassment on high and low surface brightness (LSB) disk galaxies, and indicate that the outcome is significantly different for the two types of objects. LSB galaxies lose between % of their stars, and remnants are well-fitted by exponential disks with scale-lengths between kpc, which is consistent with the scale-lengths of the compact early-type galaxies discovered in CL0152. To match the absolute magnitudes of these compact galaxies, infalling field LSB disk galaxies would have to have absolute B magnitudes of to before the effects of harassment, assuming the young and old stellar populations are equally stripped.
We also note a possible connection to the ”missing” faint red galaxy population in the luminosity functions of intermediate redshift clusters (Kodama et al., 2004; Goto et al., 2005). Perhaps the faint red population is still forming at , and the descendants of these star-forming compact galaxies will make up the missing faint red galaxies.
8. Conclusions
We have identified a population of star-forming galaxies in the cluster CL0152-1357 at (Demarco et al., 2004), and we investigate their morphologies, colors, and spatial distribution. We derive star-formation rates from [OII] fluxes, and use these to compare the integrated SFR within with other clusters between . Our conclusions are as follows.
-
•
The 24 star-forming galaxies with ACS morphological information range from compact early-types to spirals, with only one highly disturbed galaxy. The colors of the star-forming galaxies range from blue to red, and 8 out of 24 have colors placing them on the red cluster sequence. We find that the fraction of red cluster sequence galaxies with [OII] emission is likely to be . Six of these galaxies have obvious spiral morphologies, and presuming an absence of major mergers, will most likely evolve into red sequence S0s. Thus, % of red cluster sequence S0s in massive clusters at z=0 are still forming stars at a low level at . However, their overall red colors indicate that they formed most of their stars during the epoch of massive cluster ellipticals.
-
•
We find no massive early-type galaxies with [OII] emission lines down to a 12 Å observed limit, corresponding to approximately 7 Å rest-frame EW. All galaxies with [OII] are spiral, irregular, or compact, low-to-intermediate mass early-type galaxies. These compact early-type galaxies have rest-frame magnitudes of to . Assuming a moderate amount of magnitudes of -band fading, this overlaps with present-day dwarf elliptical magnitudes, and we identify them as possible dwarf elliptical progenitors. We also note that these may be the ”missing” faint red galaxy population in intermediate redshift clusters (Kodama et al., 2004; Goto et al., 2005).
-
•
We find a paucity of star-forming galaxies within kpc of the projected cluster center, and none within the main X-ray peaks. Using simple, standard assumptions about the density profile of the ICM, this radius is consistent with the expected effect of ram pressure stripping.
-
•
We measure the integrated star formation rate within for CL0152-1357, and find a value similar to that of the cluster CL0023+0423, although these clusters differ by at a least a factor of 2 in mass. We find an inverse correlation of the mass-normalized integrated star formation rate and , and no trend with redshift. However, a larger cluster sample is needed to reach a definitive conclusion, and additional data on clusters with low X-ray temperatures will be pivotal.
References
- Allen, Ettori, & Fabian (2001) Allen, S. W., Ettori, S., & Fabian, A. C. 2001, MNRAS, 324, 877
- Balogh et al. (1997) Balogh, M. L., Morris, S. L., Yee, H. K. C., Carlberg, R. G., & Ellingson, E. 1997, ApJ, 488, L75
- Balogh et al. (1998) Balogh, M. L., Schade, D., Morris, S. L., Yee, H. K. C., Carlberg, R. G., & Ellingson, E. 1998, ApJ, 504, L75
- Balogh & Morris (2000) Balogh, M. L. & Morris, S. L. 2000, MNRAS, 318, 703
- Balogh et al. (2002) Balogh, M. L., et al. 2002, ApJ, 566, 123
- Barton, Geller, & Kenyon (2000) Barton, E. J., Geller, M. J., & Kenyon, S. J. 2000, ApJ, 530, 660
- Bekki, Couch, & Shioya (2002) Bekki, K., Couch, W. J., & Shioya, Y. 2002, ApJ, 577, 651
- Bekki & Couch (2003) Bekki, K. & Couch, W. J. 2003, ApJ, 596, L13
- Benítez et al. (2004) Benítez, N., et al. 2004, ApJS, 150, 1
- Bertin & Arnouts (1996) Bertin, E. & Arnouts, S. 1996, A&AS, 117, 393
- Blakeslee et al. (2003a) Blakeslee, J. P., Anderson, K. R., Meurer, G. R., Benítez, N., & Magee, D. 2003a, in ASP Conf. Ser. 295, Astronomical Data Analysis Software and Systems XII, ed. G. Piotto, G. Meylan, S. G. Djorgovski, & M. Riello (San Francisco: ASP), 257
- Blakeslee et al. (2003b) Blakeslee, J. P., et al. 2003b, ApJ, 596, 143
- Borgani et al. (2002) Borgani, S., Governato, F., Wadsley, J., Menci, N., Tozzi, P., Quinn, T., Stadel, J., & Lake, G. 2002, MNRAS, 336, 409
- Broadhurst et al. (2005) Broadhurst, T., et al., 2005, ApJ, in press
- Cardelli, Clayton, & Mathis (1989) Cardelli, J. A., Clayton, G. C., & Mathis, J. S. 1989, ApJ, 345, 245
- Ciotti & Bertin (1999) Ciotti, L. & Bertin, G. 1999, A&A, 352, 447
- Conselice, Bershady, & Gallagher (2000) Conselice, C. J., Bershady, M. A., & Gallagher, J. S. 2000, A&A, 354, L21
- Conselice, Gallagher, & Wyse (2001) Conselice, C. J., Gallagher, J. S., & Wyse, R. F. G. 2001, ApJ, 559, 791
- Couch et al. (2001) Couch, W. J., Balogh, M. L., Bower, R. G., Smail, I., Glazebrook, K., & Taylor, M. 2001, ApJ, 549, 820
- de Vaucouleurs et al. (1991) de Vaucouleurs, G., de Vaucouleurs, A., Corwin, H. G., Buta, R. J., Paturel, G., & Fouque, P. 1991, Volume 1-3, XII, 2069 pp. 7 figs.. Springer-Verlag Berlin Heidelberg New York,
- Demarco (2003) Demarco, R. 2003, PhDT
- Demarco et al. (2004) Demarco, R. et al., A&A, submitted
- Ebeling et al. (2000) Ebeling, H., et al. 2000, ApJ, 534, 133
- Ellingson et al. (2001) Ellingson, E., Lin, H., Yee, H. K. C., & Carlberg, R. G. 2001, ApJ, 547, 609
- Finn, Zaritsky, & McCarthy (2004) Finn, R. A., Zaritsky, D., & McCarthy, D. W. 2004, ApJ, 604, 141
- Ford et al. (2002) Ford, H., et al. 2002, SPIE, 4854, 81
- Fujita & Nagashima (1999) Fujita, Y. & Nagashima, M. 1999, ApJ, 516, 619
- Gallagher, Hunter, & Bushouse (1989) Gallagher, J. S., Hunter, D. A., & Bushouse, H. 1989, AJ, 97, 700
- Geha, Guhathakurta, & van der Marel (2003) Geha, M., Guhathakurta, P., & van der Marel, R. P. 2003, AJ, 126, 1794
- Goto et al. (2003) Goto, T., et al. 2003, PASJ, 55, 757
- Goto et al. (2005) Goto, T. et al., 2005, submitted
- Graham & Guzmán (2003) Graham, A. W. & Guzmán, R. 2003, AJ, 125, 2936
- Gray et al. (2004) Gray, M. E., Wolf, C., Meisenheimer, K., Taylor, A., Dye, S., Borch, A., & Kleinheinrich, M. 2004, MNRAS, 347, L73
- Gunn & Gott (1972) Gunn, J. E. & Gott, J. R. I. 1972, ApJ, 176, 1
- Hashimoto et al. (1998) Hashimoto, Y., Oemler, A., Jr., Lin, H., Tucker, D. L. 1998, ApJ, 499, 589
- Homeier, Gallagher, & Pasquali (2002) Homeier, N., Gallagher, J. S., & Pasquali, A. 2002, A&A, 391, 857
- Jansen et al. (2000) Jansen, R. A., Franx, M., Fabricant, D., Caldwell, N. 2000, ApJS, 126, 271
- Jansen, Franx, & Fabricant (2001) Jansen, R. A., Franx, M., & Fabricant, D. 2001, ApJ, 551, 825
- Jee et al. (2004) Jee, M., et al. 2005, ApJ, in press (astro-ph/0409304)
- Jerjen, Binggeli, & Barazza (2004) Jerjen, H., Binggeli, B., & Barazza, F. D. 2004, AJ, 127, 771
- Johnson et al. (1999) Johnson, K. E., Vacca, W. D., Leitherer, C., Conti, P. S., & Lipscy, S. J. 1999, AJ, 117, 1708
- Johnson, Best, & Almaini (2003) Johnson, O., Best, P. N., & Almaini, O. 2003, MNRAS, 343, 924
- Kenney et al. (2004) Kenney, J. D. P., van Gorkom, J. H., & Vollmer, B. 2004, AJ, in press
- Kennicutt (1992) Kennicutt, R. C., Jr. 1992, ApJ, 388, 310
- Kewley, Geller, & Jansen (2004) Kewley, L. J., Geller, M. J., & Jansen, R. A. 2004, AJ, 127, 2002
- King, Clowe, & Schneider (2002) King, L. J., Clowe, D. I., & Schneider, P. 2002, A&A, 383, 118
- Kneib et al. (2003) Kneib, J., et al. 2003, ApJ, 598, 804
- Kodama et al. (2004) Kodama, T., Balogh, M. L., Smail, I., Bower, R. G., Nakata, F. 2004, MNRAS, in press
- Larson, Tinsley, & Caldwell (1980) Larson, R. B., Tinsley, B. M., & Caldwell, C. N. 1980, ApJ, 237, 692
- Lee, Richer, & McCall (2000) Lee, H., Richer, M. G., & McCall, M. L. 2000, ApJ, 530, L17
- Lewis et al. (2002) Lewis, I., et al. 2002, MNRAS, 334, 673
- Lotz, Martin, & Ferguson (2003) Lotz, J. M., Martin, C. L., & Ferguson, H. C. 2003, ApJ, 596, 143
- Lubin et al. (1998) Lubin, L. M., Postman, M., Oke, J. B., Ratnatunga, K. U., Gunn, J. E., Hoessel, J. G., & Schneider, D. P. 1998, AJ, 116, 584
- Mahdavi & Geller (2001) Mahdavi, A. & Geller, M. J. 2001, ApJ, 554, L129
- Martin, Lotz, & Ferguson (2000) Martin, C. L., Lotz, J., & Ferguson, H. C. 2000, ApJ, 543, 97
- Martínez et al. (2002) Martínez, H. J., Zandivarez, A., Domínguez, M., Merchán, M. E., Lambas, D. G. 2002, MNRAS, 333, 31
- Maughan et al. (2003) Maughan, B. J., Jones, L. R., Ebeling, H., Perlman, E., Rosati, P., Frye, C., & Mullis, C. R. 2003, ApJ, 587, 589
- Moore, Lake, & Katz (1998) Moore, B., Lake, G., & Katz, N. 1998, ApJ, 495, 139
- Moore et al. (1999) Moore, B., Lake, G., Quinn, T., & Stadel, J. 1999, MNRAS, 304, 465
- Natarajan, Kneib, Smail, & Ellis (1998) Natarajan, P., Kneib, J., Smail, I., & Ellis, R. S. 1998, ApJ, 499, 600
- Ota et al. (2004) Ota, N., Pointecouteau, E., Hattori, M., & Mitsuda, K. 2004, ApJ, 601, 120
- Peng et al. (2002) Peng, C. Y., Ho, L. C., Impey, C. D., & Rix, H. 2002, AJ, 124, 266
- Postman, Lubin, & Oke (2001) Postman, M., Lubin, L. M., & Oke, J. B. 2001, AJ, 122, 1125
- Pustilnik et al. (2001) Pustilnik, S. A., Kniazev, A. Y., Lipovetsky, V. A., & Ugryumov, A. V. 2001, A&A, 373, 24
- Quilis, Moore, & Bower (2000) Quilis, V., Moore, B., & Bower, R. 2000, Science, 288, 1617
- Rakos & Schombert (2004) Rakos, K. & Schombert, J. 2004, AJ, 127, 1502
- Rola, Terlevich, & Terlevich (1997) Rola, C. S., Terlevich, E., & Terlevich, R. J. 1997, MNRAS, 289, 419
- Romer et al. (2000) Romer, A. K., et al. 2000, ApJS, 126, 209
- Rosati et al. (1998) Rosati, P., della Ceca, R., Norman, C., Giacconi, R. 1998, ApJ, 492, 21
- Sanders & Mirabel (1996) Sanders, D. B. & Mirabel, I. F. 1996, ARA&A, 34, 749
- Scharf et al. (1997) Scharf, C. A., Jones, L. R., Ebeling, H., Perlman, E., Malkan, M., & Wegner, G. 1997, ApJ, 477, 79
- Schweizer (1987) Schweizer, F. 1987, Nearly Normal Galaxies. From the Planck Time to the Present, 18
- Sersic (1968) Sersic, J. L. 1968, Atlas de Galaxes Australes; Vol. Book; Page 1, 0
- Smith (2003) Smith, R. J. 2003, MNRAS, 344, L17
- Struck & Smith (2003) Struck, C. & Smith, B. J. 2003, ApJ, 589, 157
- Treu et al. (2003) Treu, T., Ellis, R. S., Kneib, J., Dressler, A., Smail, I., Czoske, O., Oemler, A., & Natarajan, P. 2003, ApJ, 591, 53
- Vollmer et al. (2004) Vollmer, B., Beck, R., Kenney, J. D. P., & van Gorkom, J. H. 2004, AJ, in press
- Wu, Xue, & Fang (1999) Wu, X., Xue, Y., & Fang, L. 1999, ApJ, 524, 22
- Yamauchi & Goto (2004) Yamauchi, C. & Goto, T. 2004, MNRAS, 352, 815
- Zekser et al. (2005) Zekser, K. C., et al., 2005, ApJ, in press
| ID | ID | RCS | Flux[OII] | SFR | EW [OII] (Å) | |||||
|---|---|---|---|---|---|---|---|---|---|---|
| VLT | ACS | MAGISO | MAGISO | MAGAUTO | mag | erg s-1 cm-2 | M⊙ yr-1 | Å | ||
| 1290 | 8671 | 0.8416 | 1.51E-16 | 3.4 | ||||||
| 650 | 3927 | 0.8671 | 1.32E-16 | 2.9 | ||||||
| 125 | 0.8376 | 1.23E-16 | 2.7 | |||||||
| 144 | 0.8442 | 1.05E-16 | 2.3 | |||||||
| 1006 | 10871 | 0.8485 | 1.01E-16 | 2.2 | ||||||
| 347 | 1676 | 0.8463 | 9.24E-17 | 2.0 | ||||||
| 1530 | 0.8367 | 8.20E-17 | 1.8 | |||||||
| 1146 | 5111 | 0.8641 | 7.09E-17 | 1.6 | ||||||
| 306 | 5481 | 0.8539 | 6.55E-17 | 1.4 | ||||||
| 3014 | 0.8474 | 4.72E-17 | 1.0 | |||||||
| 295 | 1652 | 0.8370 | 4.72E-17 | 1.0 | ||||||
| 327 | 2016 | 0.8247 | 4.24E-17 | 0.9 | ||||||
| 161 | 0.8447 | 4.18E-17 | 0.9 | |||||||
| 1131 | 5846 | 0.8237 | 3.72E-17 | 0.8 | ||||||
| 868 | 8708 | 0.8297 | 3.09E-17 | 0.7 | ||||||
| 47 | 2027 | 0.8436 | 2.71E-17 | 0.6 | ||||||
| 270 | 1562 | 0.8450 | 2.21E-17 | 0.5 | ||||||
| 851 | 5410 | 0.8360 | 1.98E-17 | 0.4 | ||||||
| 898 | 10148 | 0.8300 | 1.71E-17 | 0.4 | ||||||
| 1532 | 1146 | 0.8413 | 1.95E-17 | 0.4 | ||||||
| 377 | 2597 | 0.8379 | 1.67E-17 | 0.4 | ||||||
| 1238b | 0.8456 | 1.55E-17 | 0.3 | |||||||
| 1258 | 7017 | 0.8394 | 1.50E-17 | 0.3 | ||||||
| 184 | 0.8397 | 1.36E-17 | 0.3 | |||||||
| 204 | 3390 | 0.8386 | 1.15E-17 | 0.3 | ||||||
| 248 | 4076 | 0.8472 | 1.47E-17 | 0.3 | ||||||
| 551 | 2235 | 0.8362 | 1.45E-17 | 0.3 | ||||||
| 18 | 717 | 0.8248 | 8.63E-18 | 0.2 | ||||||
| 234 | 1564 | 0.8474 | 7.07E-18 | 0.2 | ||||||
| 267 | 1575 | 0.8443 | 8.38E-18 | 0.2 | ||||||
| 394 | 1737 | 0.8329 | 6.88E-18 | 0.2 | ||||||
| 3013 | 0.8224 | 5.50E-18 | 0.1 | |||||||
| 26b11The blue wavelength coverage was not sufficient to detect [OII] 3727; only [OIII] 4959,5007 was detected. | 0.8372 |
Note. — Notes: Colors are computed with MAGISO; total is MAGAUTO. RCS is deviation in magnitudes of from the red cluster sequence. Errors on Flux[OII] ranges from 5-20% from the highest to the lowest luminosities. Combining this with the error in the L[OII]-SFR relation (Kewley, Geller, & Jansen, 2004), errors on SFRs range from %. EWs are the mean of 5 interactive measurements in SPLOT. EW errors are taken as the largest deviation from the mean. EWs are observed EWs; to transform to rest-frame, divide by (1+z).
| ACS ID | , pixels | , kpc | T type | |
|---|---|---|---|---|
| 4076 | 7.1 | 2.7 | 4.7 | |
| 5111 | 4.3 | 1.7 | 1.4 | |
| 10871 | 3.8 | 1.4 | 0.8 | |
| 1676 | 3.1 | 1.2 | 5.4 | |
| 5846 | 2.8 | 1.1 | 1.8 |
| Cluster | Redshift | M⊙ | 1044 erg s-1 | (keV) | Ref |
|---|---|---|---|---|---|
| A1689 | 0.183 | 8.1 | 1 | ||
| A2390 | 0.228 | 2 | |||
| AC114 | 0.32 | 3 | |||
| CL0024 | 0.395 | 4 | |||
| CL0152 | 0.837 | 5 | |||
| CL0023 | 0.845 | 6 |