8000
2005
A robust sample of submillimetre galaxies: constraints on the prevalence of dusty, high-redshift starbursts
Abstract
We develop and apply a dual-survey extraction technique to published submm images of the Lockman Hole using the SCUBA and MAMBO bolometer arrays. Cut above 5, this catalogue of submm galaxies (SMGs) is significantly more robust than previous samples, typically selected above 3.0–3.5, with a much-reduced likelihood of real, faint SMGs (beneath and around the confusion limit) entering the catalogue via superposition with noise. Our selection technique yields 19 SMGs of which we expect at most two to be due to chance superposition of SCUBA and MAMBO noise peaks. The flux limit of the sample (5 mJy at 0.85 mm), which is sensitive to luminous, dusty galaxies at extreme redshifts, is optimally matched to a deep 1.4-GHz image (4.6 Jy beam-1 rms) which probes starbursts in the regime. A high fraction of these robust SMGs (80%) have radio counterparts which, given the probable 10% contamination by spurious sources, suggests that very distant SMGs ( 3–4) are unlikely to make up more than 10% of the bright SMG population. Finally, the accurate radio positions are used to test the accuracy of positions determined in the submm, with important implications for upcoming surveys with SCUBA-2.
1 Introduction
Submm surveys pick up dusty objects at extreme redshifts, galaxies that drop out of surveys at shorter and longer wavelengths due to obscuration and unfavourable corrections, respectively. The first cosmological surveys using SCUBA and MAMBO quickly and radically changed the accepted picture of galaxy formation and evolution, moving away from the optocentric view of the last century. The discovery of so-called ‘SCUBA galaxies’ Sm97 was greeted with surprise due to the remarkable evolution in the dusty, starburst galaxy population implied by such a large source density at the flux levels accessible to the first generation of bolometer arrays B99 . Excitement was replaced by pessimism with the first efforts to study SMGs at optical/IR wavelengths: early reports, backed by a study in the HDF-N H98 , suggested that the majority of the submm population had no plausible optical counterparts. Attention was diverted to various redshift engines and broadband photometric techniques A03 ; W04 . As a result, only a handful of detailed studies were attempted, often for extreme, non-representative galaxies.
Recent progress has largely been the result of radio imaging of submm survey fields, though early radio follow-up data were not well matched to the depth of the submm imaging and only modest detection rates were achieved. Once sufficient depths were attained I02 , radio maps were able to pinpoint half of the brightest known SMGs to 0.3′′ and, combined with the submm flux density, provide a rough estimate of redshift. Radio data also enabled some refinement of submm samples, increasing the detection fraction to two thirds of SMGs at 0.85-mm flux levels in excess of 5 mJy. With positions in hand, these bright SMGs were found to be a diverse population — some quasar-like, with broad lines and X-ray detections I98 ; K03 , some morphologically complex I00 , some extremely red Sm99 ; I02 ; W03b ; D04 , some with the signatures of obscured AGN and/or superwinds Sm03 .
Spectroscopic redshifts have been extremely difficult to determine, requiring a significant investment of time on 10-m telescopes with highly efficient spectrometers. The first systematic survey was undertaken by Chapman et al. C03 ; Sw04 ; C05 . The median redshift is now known to be 2.2 for -mJy galaxies selected using SCUBA and pinpointed at 1.4 GHz. A similar survey with a modern red-sensitive spectrometer has yet to be attempted. We must therefore accept that present knowledge may be biased by wavelength coverage and by the need to identify targets via radio imaging (which does not benefit from the same correction as submm observations and is thought to impose an artificial redshift cut-off at 3–4).
Accurate redshifts have facilitated the first systematic measurements of molecular gas mass for SMGs (1011 M⊙) via observations of CO N03 ; G05 , as well as constraints on gas reservoir size and dynamical mass T05 . The results agree with earlier work on what were thought to be less representative systems F98 ; F99 , suggesting that SMGs are massive systems and providing some of the strongest tests of galaxy-formation models to date G03 .
Despite this progress, a detailed understanding of SMGs remains a distant goal. Confusion currently limits our investigations to the brightest quartile of the submm population (though surveys through lensing clusters have provided a handful of sources more typical of the faint population that dominates the cosmic background Sm02 ). We must also recall that selection biases have potentially skewed our understanding — limited coverage of red and IR wavelengths in spectroscopic surveys, and a third of SMGs remain undetected in the radio and thus untargeted by existing spectroscopic campaigns.
Here, we present a robust sample of bright SMGs selected using SCUBA and MAMBO in one of the ‘8-mJy Survey’ regions: the Lockman Hole. Our goal is to provide a bright sample which we would expect to detect in well-matched radio imaging () whilst minimising, so far as is practicable, the possibility that sources are spurious or anamalously bright. We may thus determine the true fraction of radio drop-outs () amongst SMGs, as well as practical information such as the intrinsic positional uncertainty for SMGs in the absence of radio/IR counterparts.
2 Sample selection
Our objective here is to avoid one of the most common criticisms levelled at submm surveys — the potentially large number of spurious sources present in submm catalogues. This has limited our ability to address the true recovery fraction in the radio, and hence the corrections that must be made to the redshift distributions that are used to determine star-formation histories and galaxy-formation models.
Greve et al. G04 presented a 1.2-mm survey of the ELAIS N2 and Lockman Hole regions, centred on the coordinates mapped at 0.85 mm by SCUBA in the ‘8-mJy Survey’ S02 . Mortier et al. M05 present a refined analysis of SCUBA data for a subset of the Lockman Hole MAMBO image.
Greve et al. argue that several maps with low signal-to-noise ratio (SNR) of the same region, with only marginal differences in frequency, produce several visualisations of essentially the same sky, tracing the same population of luminous, dusty galaxies. We adopt this philosophy here, starting from the 1.2-mm catalogue of Greve et al., looking for matches at 0.85 mm from Mortier et al., substituting SMGs from Scott et al. where blends are evident in the Mortier et al. catalogue.
Existing surveys have typically employed a SNR threshold of 3.0–3.5 and false detections are dominated by ‘flux boosting’, possibly at the 10–40% level S02 . To realise a significant improvement, reducing the probability of an SMG being spurious, with a lower chance of flux boosting, we must limit our sample to higher SNRs. Initially, we take those sources that have a combined statistical significance equivalent to a signal-to-noise ratio (SNR) in excess of 4.5 in a map with Gaussian noise properties, leaving aside the potential clustering of SMGs B04 . We restrict ourselves to the Lockman Hole because these data are of better quality. We then refine the selection criteria by comparing the properties of this sample with catalogues of spurious sources generated by the introduction of arbitrary positional offsets.
| Name | Position at 0.85mm | S/N | Position at 1.2mm | S/N | Sep | Final | ||||
|---|---|---|---|---|---|---|---|---|---|---|
| /mJy | /mJy | S/N | ||||||||
| h m s | h m s | ′′ | ||||||||
| LH-1200.001 = LE850.02 | 10:52:38.6 | +57:24:38 | 10.9 2.1 | 5.1 | 10:52:38.3 | +57:24:37 | 4.8 0.6 | 8.0 | 2.1 | 8 |
| LH-1200.002 | 10:52:38.6 | +57:23:19 | 5.2 2.0 | 2.6 | 10:52:38.8 | +57:23:21 | 4.1 0.6 | 6.8 | 3.6 | 7.6 |
| LH-1200.003 = LE850.14 | 10:52:04.2 | +57:27:01 | 10.5 2.0 | 5.2 | 10:52:04.1 | +57:26:57 | 3.6 0.6 | 6.0 | 3.4 | 8 |
| 10:52:03.9 | +57:27:10 | 1.3 0.6 | 2.2 | |||||||
| LH-1200.004 | 10:52:57.0 | +57:21:07 | 5.7 1.0 | 5.7 | 5.7 | |||||
| LH-1200.005 = LE850.01 | 10:52:01.5 | +57:24:43 | 8.6 1.1 | 8.0 | 10:52:01.3 | +57:24:48 | 3.4 0.6 | 5.7 | 5.1 | 8 |
| LH-1200.006 = LE850.16 | 10:52:27.6 | +57:25:17 | 7.0 1.6 | 4.3 | 10:52:27.4 | +57:25:15 | 2.8 0.5 | 5.6 | 2.6 | 7.4 |
| LH-1200.007 | 10:52:03.4 | +57:18:12 | 5.8 1.3 | 4.3 | 10:52:04.7 | +57:18:12 | 3.2 0.7 | 4.6 | 10.4 | 6.4 |
| LH-1200.008 | 10:51:40.7 | +57:19:53 | 4.6 1.6 | 2.8 | 10:51:41.9 | +57:19:51 | 4.1 0.9 | 4.6 | 9.8 | 5.5 |
| LH-1200.009 | 10:52:28.2 | +57:22:17 | 6.3 1.8 | 3.5 | 10:52:27.5 | +57:22:20 | 3.1 0.7 | 4.4 | 6.3 | 6.0 |
| LH-1200.010 = LE850.06 | 10:52:30.4 | +57:22:13 | 10.8 2.4 | 4.6 | 10:52:29.9 | +57:22:05 | 2.9 0.7 | 4.1 | 9.5 | 6.4 |
| LH-1200.011 = LE850.03 | 10:51:58.3 | +57:18:00 | 5.0 1.3 | 3.9 | 10:51:58.2 | +57:17:53 | 2.9 0.7 | 4.1 | 7.6 | 6.0 |
| 10:51:57.6 | +57:18:05 | 1.6 0.7 | 2.3 | |||||||
| LH-1200.012 = LE850.18 | 10:51:55.9 | +57:23:13 | 4.3 1.0 | 4.2 | 10:51:55.4 | +57:23:10 | 3.3 0.8 | 4.1 | 5.2 | 6.2 |
| LH-1200.014 = LE850.08 | 10:51:59.6 | +57:24:21 | 4.8 1.1 | 4.3 | 10:52:00.0 | +57:24:24 | 2.4 0.6 | 4.0 | 4.9 | 6.2 |
| LH-1200.017 | 10:51:22.5 | +57:18:42 | 14.6 4.1 | 3.5 | 10:51:21.4 | +57:18:40 | 4.8 1.3 | 3.7 | 8.8 | 5.3 |
| LH-1200.019 | 10:51:27.8 | +57:19:47 | 6.7 2.3 | 2.9 | 10:51:28.3 | +57:19:46 | 4.0 1.1 | 3.6 | 4.5 | 5.0 |
| LH-1200.022 | 10:52:03.3 | +57:15:37 | 7.3 2.2 | 3.3 | 10:52:03.0 | +57:15:46 | 2.8 0.8 | 3.5 | 9.1 | 5.0 |
| LH-1200.042 = LE850.29 | 10:52:16.2 | +57:25:05 | 7.2 1.5 | 4.7 | 10:52:16.0 | +57:25:06 | 1.6 0.5 | 3.2 | 1.9 | 6.0 |
| LH-1200.096 = LE850.07 | 10:51:51.4 | +57:26:38 | 6.7 1.7 | 4.0 | 10:51:51.4 | +57:26:40 | 1.6 0.6 | 2.7 | 4.8 | 5.1 |
| LH-1200.104 = LE850.27 | 10:51:53.9 | +57:18:38 | 6.3 1.2 | 5.2 | 10:51:53.7 | +57:18:39 | 2.1 0.8 | 2.6 | 2.1 | 6.2 |


To accomplish this dual-survey extraction, where there are numerous permutations of SNRs that yield the desired SNR, we have developed a simple algorithm. We take the 2- catalogue from the MAMBO image, extracted as described by Greve et al. G04 . We then search for SCUBA sources within 14′′ (roughly the area of five beams), applying a correction for separation and checking for a combined significance above my initial threshold, 4.5. We include sources that exceed 4.5 in either dataset, as long as there is a valid reason why the source is not seen in the other image, and sources with a combined probability exceeding 4.5 with a minimum 2- detection in both images, within 14′′ of one another. To account for the distance between sources, we divide the probabilities by the number of beams inside a circle with a radius equal to the separation of the sources.
The noise properties of submm images are not Gaussian due to the miriad of real, faint sources near the confusion limit. The most important effect of increasing the SNR threshold should be to drastically reduce the false detections due to faint SMGs that have been boosted above the detection threshold by noise — flux boosting S02 ; G04 . However, with so many 2- sources in the catalogues, it is important to investigate how many SMGs may contaminate the combined sample due to random coincidence of faint MAMBO and SCUBA peaks. To this end, we performed simulations, offsetting the MAMBO sample by 30′′ and 45′′ (in R.A. and Dec.). Each simulation typically yields ten SMGs — far too many to hope that a statistically robust catalogue would emerge from the process. The results of these simulations, and for the real samples, are illustrated in the left-hand panels of Fig. 1. The left-hand panels show the scatter of R.A. and Dec. offsets between each MAMBO and SCUBA pair, with symbol size coded to match the SNR of the highest peak. The right-hand panels show histograms of — the radial offset, . The simulated catalogues clearly yield a very different distribution of offsets from the position-matched data, exactly the form expected for randomly scattered peaks, and without the expected concentration of high-SNR pairs at low .
Using the information in these plots we have taken a number of approaches to minimise the number of spurious SMGs in our sample. Most of the sources in the simulated catalogues are the result, perhaps unsurprisingly, of near-coincident low-SNR peaks. We found that raising the minimum catalogue threshold to 2.5 reduced the number of false detections whilst having no effect on the real catalogue. Lowering the search radius to 11′′ reduced the number of false positives in line with the ratio of the respective search areas, removing only one source from the real catalogue. Insisting that the higher of the two peaks is 3.5 removes a further quarter of the simulated SMGs, whilst reducing the real catalogue by half that amount. Finally, we increased the combined theshold to 5 to further reduce the number of rogue sources. The effects of this approach on the SCUBA–MAMBO positional offsets are shown in the right-hand panels of Fig. 1. We are left with a situation where the final catalogue consists of 19 SMGs of which we expect at most two to be the result of coincidence. It is clear that the effect of confusion is less apparent than in previous catalogues, without the sample size shrinking dramatically, though the sample is not entirely immune. We list the resulting 19 sources in Table 1.
Note that all five of the SCUBA sources detected individually above 5 are also found in the MAMBO image with a SNR of at least 2.0, though one is below 2.5 and has thus been excised from my final sample. Of the eight 5- MAMBO sources, only one was not seen by SCUBA at 2.5: LE-1200.4, which lies off the SCUBA map, to the East, but was subsequently detected by Scott et al. (in preparation).
3 Identification of the SMGs in the radio
The process of identifying counterparts to SMGs has been refined in a series of studies I98 ; I00 ; I02 ; I04 ; Sm99 ; Sm00 ; W03a ; W03b ; P05 . The most effective methods employ a combination of radio, optical and IR imaging, searching for the red rest-frame optical light expected of a dust-enshrouded galaxy and the synchrotron emission expected of a starburst or radio-loud active galaxy. Radio sources and EROs are sufficiently rare that associations of either with SMGs can be viewed as robust in most cases.
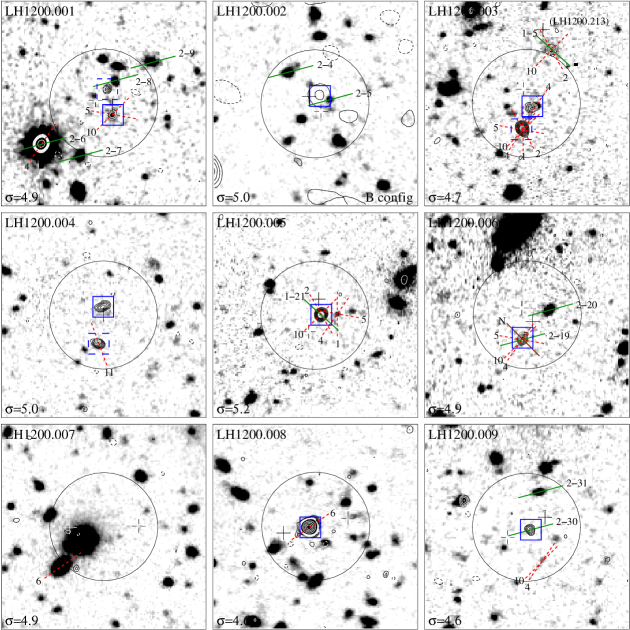
Fig. 2 shows how the flux density of a luminous, dusty starburst varies with redshift at both 1 mm and 1.4 GHz, adopting the SED of Carilli & Yun CY99 . To identify a 5-mJy SMG (the average of the 0.85- and 1.2-mm flux densities) in a 1.4-GHz image, it is clear that the radio data must achieve a sensitivity of at least 5 Jy beam-1.
Even at this radio sensitivity, the lack of a robust radio identification could have at least five origins: i) the SMG could be spurious; ii) the SMG could be flux boosted significantly; iii) the radio/far-IR emission could be significantly larger than the 1.4-GHz synthesised beam I02 ; iv) the characteristic dust temperature could be low C04 ; or, most interestingly, v) the SMG could lie at 3–4 E03 . It is difficult, given the quality of existing samples, and the mis-matched radio/submm datasets, to determine which of these are important, though Ivison et al. I02 showed that (i) affects at least 15% of a 3.5 sample.
Deep, high-resolution, wide-field radio images were obtained at the Very Large Array and employed to pinpoint the SMGs. The data used here are described in detail by Ivison et al. I02 . Fig. 3 shows postage stamps around the positions given in Table 2 (see the printed version of this document) for the nine most significant SMGs. A radio source peaking at 4 in the 1.4′′ or smoothed images, with an integrated flux density in excess of 15 Jy, is considered a robust detection. Fainter sources, where the definition is relaxed to only the integrated flux, were also catalogued.
For each SMG we have searched for a potential radio (1.4-GHz) counterpart out to a radius of 8′′ from the mid-point of the 0.85- and 1.2-mm emission. This relatively large search area (201′′2 around each source) represents a 99% positional confidence region (see later) and should ensure that few real associations are missed.
To quantify the formal significance of each of the potential submm/radio associations, we have used the method of Downes et al. D86 to correct the raw Poisson probability, , that a radio source of the observed flux density could lie at the observed distance from the SMG for the number of ways that such an apparently significant association could have been uncovered by chance.
Of the 19 SMGs in the sample, only four lack robust radio counterparts. The flux densities and positions of all candidate radio counterparts are listed in Table 2 (see the printed version of this document), along with the search positions. Of the four sources which have more than one potential radio counterpart, we find that the correct identification is never statistically obvious. The formal probability of the second candidate association occurring by chance is low, . The obvious interpretations of such multiple statistical associations are either gravitational lensing (implausible in most of the cases here), or clustering of star-forming objects/AGN at the source redshift (already proven in several cases — L02 ; C05 ); another possibility is that sources with multiple radio counterparts are boosted into bright submm catalogues by virtue of comprising multiple, faint, physically unrelated SMGs, i.e. by conventional confusion.
This calculation has yielded statistically robust radio counterparts for 15 of the 19 SMGs. The plausibility of this figure can be checked by noting the ratio of areas inside and outside the circles in Fig. 3, 4.5:1. Ten random ‘field’ radio sources are detected in the outer areas so, given that Jy radio sources are expected to be over-dense around SMGs, we expect only a handful (at most 2–3) of the counterparts to be spurious. Based on the values given in Table 2 (see the printed version of this document), the most likely candidates for spurious associations are LH-1200.007 and LH-1200.019, leaving 15/19 robust radio identifications.

3.1 Implications for submm positional uncertainty
Fig. 4 shows a histogram of R.A. and Dec. positional offsets between the mm/submm centroids and the most likely radio counterparts. A Gaussian fit to the distribution yields a fwhm of 5.2 1.2′′, which translates into an r.m.s. separation of 5.2′′/2.354 = 2.2′′ between the (sub)mm and radio positions. The sample can thus be employed to re-calibrate the rule-of-thumb relationship between positional accuracy, beam size and SNR (typically, SNR 6 here). We must acknowledge a mild circularity to the logic, given that positional offsets have been used to calculate , though this may be offset by the lack of correction for radio sources in the field.
The conventional positional uncertainty, , occurs where the distribution of radial offsets peaks; this is the same as the the r.m.s. separation deduced earlier. Within this radius we expect to find 39.3% of the population, with 86.5 and 98.9% within 2 and 3 (from 1 – ). In the absence of radio counterparts, it would seem from our analysis that around 39% of SMGs can be located within a radial distance of , where is the fwhm beam size, in arcsec). Thus the 1- positional uncertainty for 3–3.5 SCUBA-selected SMGs is 4–5′′, cf. the rule of thumb quoted by Hughes et al. H98 . The most secure SMGs, at 10, representative of those expected in upcoming, confusion-limited, wide-field (tens of square degrees) 0.85-mm surveys using SCUBA-2, with lower significance, simultaneous detections at 0.45 mm, will be located with a uncertainty of , at which level the precision of the telescope pointing and SCUBA-2 flatfield may become important. Assuming these sources of uncertainty can be minimised, the current requirement for deep radio coverage to identify counterparts and enable spectroscopic follow-up may not be as urgent, particularly if deployable integral field units are employed (e.g. KMOS S03 ).
References
- (1) Aretxaga I. et al. 2003, MNRAS, 342, 759
- (2) Blain A.W., Smail I., Ivison R.J., Kneib J.-P., 1999, MNRAS, 302, 632
- (3) Blain A.W., Chapman S.C., Smail I., Ivison R.J., 2004, ApJ, in press (astro-ph/0405035)
- (4) Carilli C.L., Yun M.S., 1999, ApJ, 513, L13
- (5) Chapman S.C., Blain A.W., Ivison R.J., Smail I., 2003, Nature, 422, 695
- (6) Chapman S.C., Smail I., Blain A.W., Ivison R.J., 2004, ApJ, 614, 671
- (7) Chapman S.C., Blain A.W., Smail I., Ivison R.J., 2005, ApJ, in press (astro-ph/0412573)
- (8) Downes A.J.B., Peacock J.A., Savage A., Carrie D.R., 1986, MNRAS, 218, 31
- (9) Dunlop J.S. et al., 2004, MNRAS, 350, 769
- (10) Eales S., Bertoldi F., Ivison R.J., Carilli C., Dunne L., Owen F., 2003, MNRAS, 344, 169
- (11) Frayer D.T. et al. 1998, ApJ, 506, L7
- (12) Frayer D.T. et al. 1999, ApJ, 514, L13
- (13) Genzel R., Baker A.J., Tacconi L.J., Lutz D., Cox P., Guilloteau S., Omont A., 2003, ApJ, 584, 633
- (14) Greve T.R. et al. 2004, MNRAS, 354, 779
- (15) Greve T.R. et al. 2005, MNRAS, submitted
- (16) Hughes D.H. et al. 1998, Nature, 394, 241
- (17) Ivison R.J. et al. 1998, MNRAS, 298, 583
- (18) Ivison R.J. et al. 2000, MNRAS, 315, 209
- (19) Ivison R.J. et al. 2002, MNRAS, 337, 1
- (20) Ivison R.J. et al. 2004, ApJS, 154, 124
- (21) Knudsen K.K., van der Werf P.P., Jaffe W., 2003, A&A, 411, 343
- (22) Ledlow M.J., Smail I., Owen F.N., Keel W.C., Ivison R.J., Morrison G.E., 2002, ApJ, 577, L79
- (23) Mortier A.M.J. et al. 2005, MNRAS, submitted
- (24) Neri R. et al. 2003, A&A, 597, L113
- (25) Pope A. et al. 2005, MNRAS, in press
- (26) Scott S.E. et al. 2002, 331, 817
- (27) Sharples R.M., Bender R., Hofmann R., Genzel R., Ivison R.J., 2003, SPIE, 4841, 1562
- (28) Smail I., Ivison R.J., Blain A.W., 1997, ApJ, 490, L5
- (29) Smail I. et al. 1999, MNRAS, 308, 1061
- (30) Smail I. et al. 2000, ApJ, 528, 612
- (31) Smail I., Ivison R.J., Blain A.W., Kneib J.-P., 2002, MNRAS, 331, 495
- (32) Smail I. et al. 2003, MNRAS, 342, 1185
- (33) Swinbank A.M., Smail I., Chapman S.C., Blain A.W., Ivison R.J., Keel W.C., 2004. ApJ, 617, 64
- (34) Tacconi L.J. et al. 2005, in preparation
- (35) Webb T.M. et al. 2003a, ApJ, 587, 41
- (36) Webb T.M.A. et al. 2003b, ApJ, 597, 680
- (37) Wiklind T., 2004, ApJ, 588, 736