Is there an enhancement of muons at sea level from transient events?
Abstract
In a recent study of a search for enhancements from the galactic center with muons at sea level using the TUPI muon telescope, we have found several ground level enhancements (GLEs) as very sharp peaks above the count rate background. This paper reports a consistent analysis of two GLEs observed in December 2003 and detected after an up-grade of the data acquisition system, which includes a noise filter and which allows us to verify that the GLEs are not mere background fluctuations. The main target of this study is a search for the origin of the GLEs. The results show that one of them has a strong correlation with a solar flare, while the other has an unknown origin, because there is neither a satellite report of a solar flare, nor prompt X-ray emission, and nor a excess of nuclei during the raster scan where the GLE was observed. Even so, two possibilities are analyzed: the solar flare hypothesis and the gamma ray burst (GRB) hypothesis. We show, by using the FLUKA Monte Carlo results for photo-production, that under certain conditions there is the possibility of an enhancement of muons at sea level from GeV GRBs.
1 Introduction
In gamma-ray astronomy, an important energy band of the electromagnetic spectrum, the gap region between gamma-rays up to 30 GeV covered by satellites and the region starting from TeV covered by ground-based experiments is still not very well explored. In order to reach this energy region, since January of 2002 the TUPI muon telescope, located in Niterói, Brazil, has been in operation. Due to a limited aperture ( of opening angle), the TUPI telescope is on the boundary between telescopes with a very small field of view, like the air Cherenkov telescopes, and the small air shower arrays, characterized by a large field of view.
On the other hand, a muon telescope at ground level can be used as an astronomical telescope even if the muon’s parent particles are neutral, such as photons. Muons are expected as products of cosmic ray (protons, nuclei) interaction with the nuclei of the atmosphere via production followed by the decay . However, a small fraction of muons have their origin in photonuclear reactions induced by gamma rays. The ability to distinguish these ”photonuclear” muons from background muons depends upon statistics, the strength and energy spectrum of the emitting source and some characteristic of the experiment such as the angular resolution.
In order to increase the sensitivity of TUPI telescope, an up-grade of the acquisition system was made on December, 2003 and included a new (on-line) discrimination level to increase the counting rate background from approximately one per 20 second to approximately 18 per 10 second. In addition, as the experiment uses scintillator plastics and due to other limitations (see section 3) the counting rate has a dependence with the (on-line) pulse-height discrimination and this new data acquisition allows us to build a noise filter. The aim of this framework is to make a consistent analysis of ground level events, observed as very sharp peaks above the count rate background and found during a study of a possible muon excess from the galactic center.
In this article we report two GLEs detected on December 2003 and obtained under these new conditions. We give emphasis to the study of their origin, including the temporal characteristics on the basis of the time profile shapes of the GLEs and duration. We show, that the first GLE has a strong correlation with solar flares. Because the second GLE has an unknown origin, two possibilities are analyzed. The paper is organized as follows: In section 2, we present the TUPI telescope characteristics. In section 3, the raster search technique is presented. The analysis of the two GLEs is presented in section 4. In section 5 the local effects are analyzed. In section 6 the possible existence of a window to observe GRBs at the ground is discussed and finally in section 7 we present our conclusions.
2 The TUPI telescope
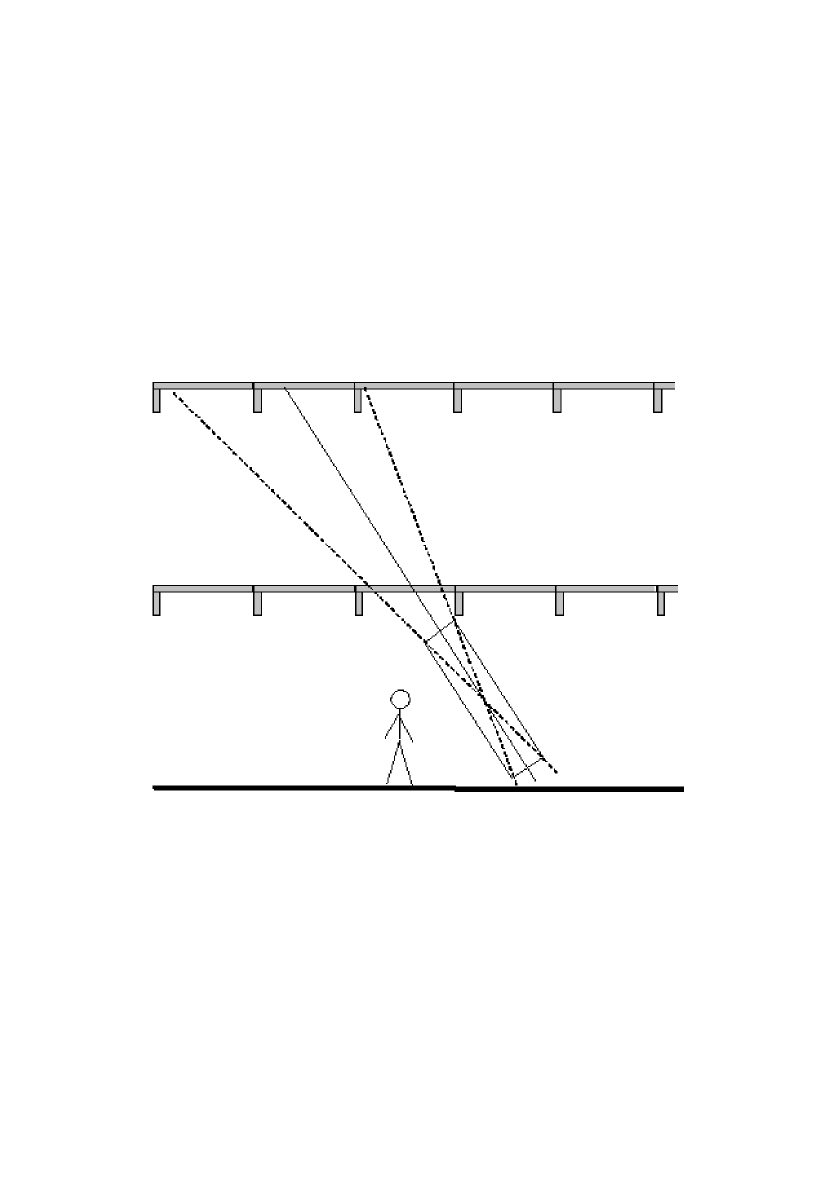
The TUPI muon telescope is installed on the campus of the Universidade Federal Fluminense, Niterói, Rio de Janeiro-Brazil. The position is: latitude: S, longitude: W, at sea level. The telescope is inside a building, under two flagstones of concrete as is shown in Fig.1. The flagstones’s thickness has a dependence on the zenith angle ( in average). For large zenith angles () and in the directions South and West there are two walls with a thickness close to and behind the walls we have open sea. However, for the North and East directions, besides the two walls, there are the buildings of Niteroi City. Consequently, the North and East directions are opaque for almost horizontal atmospheric muons. The flagstones or walls increase the muon energy threshold. The telescope can detect muons at sea level with energies greater than the GeV required to penetrate the two flagstones. In addition the flagstones contribute to the separation, consequently reducing the noise due to non-muon particles.
Most of the particles () observed at sea level are muons. This means that the telescope computes mainly the muon intensity in the atmosphere initiated by cosmic rays (mainly protons), giving the coincidence counting rate of multi-elements (plastic scintillator detectors with ). Each plastic scintillator is viewed by a 5 cm diameter Hamamatsu RS21 photomultiplier. The unit has a energy threshold of and is fed by very stable power supplies. A servo-mechanism (with an equatorial assembly) allows that the axis of the telescope can be pointed so as to accompany a given source. Details of the experimental setup of the TUPI muon telescope as well as a study of the muon background characteristics have previously been reported (Augusto et al., 2003).
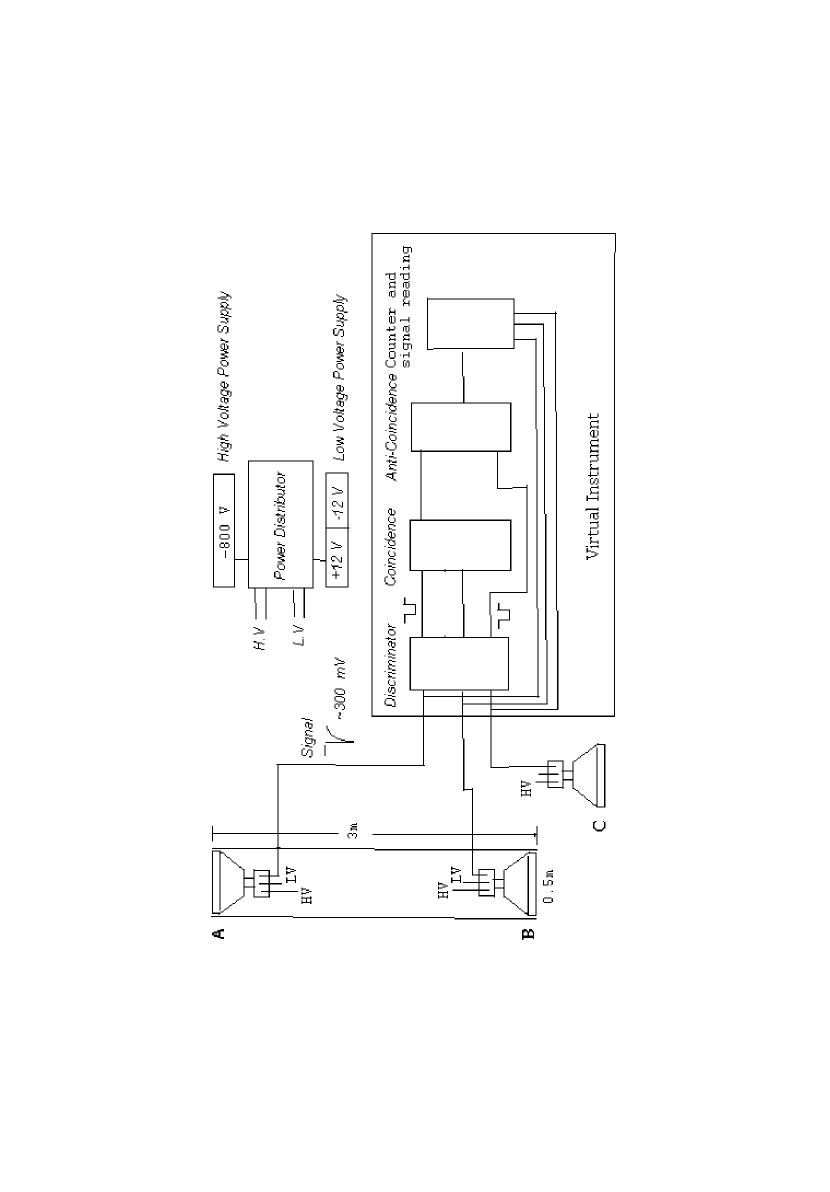
In our experiment, only particles close to the telescope axis are detected ( of aperture and of opening angle). Essentially shower particles coming from other directions are rejected by a combination of coincidence between the two telescope detectors and anti-coincidence with another detector off the telescope axis constituting a trigger system as is shown in Fig.2.
The relative efficiency for the detection of charged particles by plastic scintillator in relation to NaI(Tl) crystal is approximately 50%. The plastic scintillator light emission does not reach the optimum frequency region of the photomultiplier, the de-excitation and light emission do not always occurs preferentially via low-lying impurity levels, and the wavelength of maximum emission happens in a band of waves. In addition the efficiency is also compromised because the coupling between the scintillator and the photocathode (light guide) in our experiment is air and there is the possibility of reflections in the walls of the container where each unit of detection is mounted. Consequently two identical charged particles can give different light-pulse amplitude. In our experiment, a pulse-height discriminator (on line) is used to select only those pulses above a certain amplitude. This eliminates electronic noise and reduces the background (random) count rate of the system. The counting rate (even of single muons) has a dependence on the pulse-height discrimination (on-line) used in the experiment. In order to see the counting rate dependence on the pulse height discrimination, now every time that the trigger conditions are satisfied, the height of the pulses in all the detectors are read and stored in a file. This allows us to choose several (off-line) pulse-height discriminator levels via software starting from a certain value.
The data acquisition is made on the on the basis of the Advantech PCI-1711/73 card with a A/D conversion up to 1000 kHz sampling rate. All the steps from signal discrimination to the coincidence and anti-coincidence are made via software, using the virtual instrument technique. The application programs were written using the Lab-View tools.
3 Raster search technique
The observation of the galactic center began on 2003 June 26, and consisted of on-source and off-source raster scan across parallel lines in declination during a sidereal half-day (12 hours). This is approximately the time that the galactic center is above our horizon in every 24 hours. Starting from 2003 December, the counter rate every 10 seconds was used to observe a possible muon excess in the direction of the galactic center ().
The atmospheric muon flux originating from the decay of charged pions and kaons produced by cosmic rays in the atmosphere is nearly isotropic. However, at lower energy (sub-GeV to GeV) the muon flux is influenced by the magnetic field of the Earth (Hayakawa, 1969). Consequently the muon angular distributions are quite different for different sites on the globe. There are two the main geomagnetic effects on the muon flux observed at ground level: a) The East-West effect, the muon flux is highest (lowest) for direction coming from the West (East). The effect is a consequence of the fact that the electric charge of the primary cosmic ray is mainly positive. The muon flux is a convolution of the primary spectrum and carries the imprint of this geomagnetic effect. b) The azimuthal dependence on the positive-to-negative ratio of muons, a considerable amount of the negative excess is observed for muons coming from the East. The effect is a consequence of the geomagnetic deflection being different for positive and negative particles, as well as the dependence of the path length of a muon on azimuth; a positive muon coming from the East has a longer path length than a negative one. These geomagnetic effects distort the zenith angle distribution of sub-GeV to GeV muons during a raster scan, because the measures (galactic center) begin around the East direction and they finish around West direction.
Fig.3 summarizes the situation for the raster scan on . In the upper part, the telescope output, raw data () is shown. In the lower part the squares represent the integral () flux without any corrections, and this is evaluated from the raw data each hour. One hour of scan corresponds to in hour angle and this also corresponds approximately to the zenith angle, when the declination is not very large, (i.e ). In spite of the telescope’s relatively low angular resolution ( and the small statistics in the counting rate of muons during one hour, inside the angular bins of , it is possible to observe the characteristics indicated above in the muons flux during a raster scan, such as, for example, a muon flux excess from the West direction.
A quantitative result of the West-East effect during a raster scan can be obtained from two symmetrical points, those with the some zenith angle, with one pointing to the West and the other one to the East. Table 1 shows some TUPI results, where the W-E asymmetry is defined as the ratio . This relative value is free from the detection bias and normalization. In Table 1 the Okayama results (Tokiwa et al., 2003) are also included for comparison.
On the other hand, measurements of the absolute muon intensities by telescopes require measurements of the muon energy. In the present stage of our experiment, the detector is only a directional muon counter telescope and only relative intensities can be obtained. The obtaining of absolute muon flux requires normalization to available absolute measurements. Even so, it is well known that below 1 GeV there is a systematic dependence on location due to Earth’s magnetic field (geomagnetic effect). In addition, ground observations using new generations of spectrometers such as the CAPRICE (Boezio et al., 200; Kremer et al., 1999) (in 1997) and the BESS (Tanizaki et al., 2003)(in 2001), both at Mt. Summer () have show that the difference in the muon intensity is as large as about 20% around 1 GeV. The difference can be attributed to the effect of solar modulation. An annual variation of the muon flux at sea level also has been reported, with changes by about 5% at 1 GeV expected.
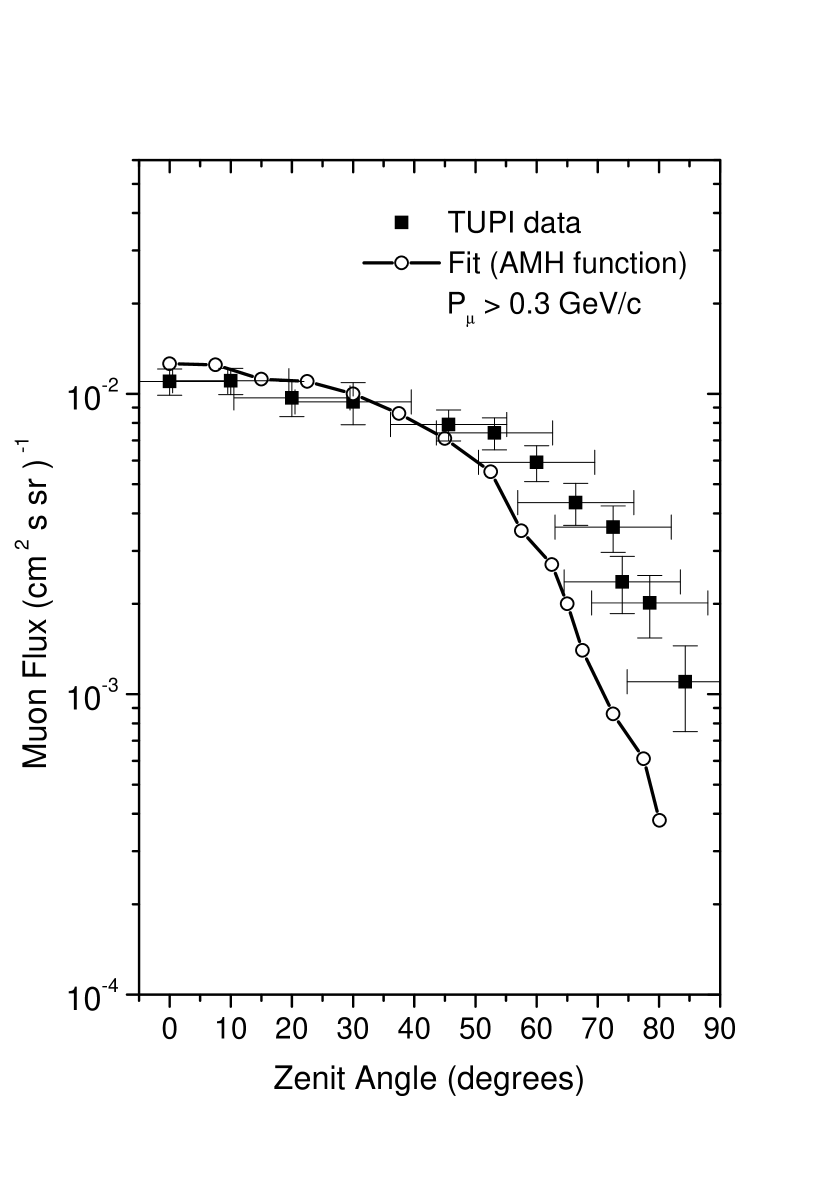
Here, we have opted for the following strategy: measurements of the integral muon intensities has been made at axis orientations of up to . In order to reduce the geomagnetic effects, the measurements are made at fixed azimuth angle (the telescope’s axis always pointed southerly), and a fit with the AMH (Texas A M-University of Houston) function (Green et al., 1979), after a numerical integration and extrapolation to 0.3 GeV, has been made. Fig.4 summarizes the situation. We can see that the Tupi muon intensities are systematically a little higher than the AMH fit for large zenith angle. However, the TUPI muon intensities are consistent with the AMH fit. The several sources of modulation of sub-GeV to GeV muons can explain these differences.
4 Ground level events
The two GLEs reported in this paper were detected on 2003 December, under new conditions of (on-line) pulse-height discrimination level. The duration of the two GLEs is big enough so that the GLEs cannot be interpreted as a surviving solitary small shower, or remains of an extensive shower both begun by conventional cosmic rays. Besides this, the chances of detection of showers with the telescope are small, because they are rejected.
4.1 The first ground level event (GLE 2003/12/02)
The GLE 2003/12/02 was detected during a raster scan off-source. The light curve shape presents several peaks, as shown in Fig.4 (lower panel), with two peaks being dominant, at the beginning and at the end of the GLE. The excesses for these two peaks can be seen over a background rate of approximately 18 coincidences per 10 seconds with significance levels of and respectively.
The analysis began with a search for the origin of the GLE. Following Fig.4 it is possible to see the similarity between the light curve of the two last solar flares on 2003 December 2, reported by the GOES satellite (Combs, 2003) 111(Combs 2003)is available at http://sec.noaa.gov/ftpmenu/plots/xray.html and the light curve of the GLE.
We have verified from literature that there is reported for most of the cases of only GLE linked with energetic solar flares, those with a X-ray prompt emission classified as X-class (above ). These observations of solar flares (Smart and ref. in there, 1996) have led to the identification of two classes of acceleration events: impulsive (prompt) and gradual(post-eruptive or delayed). The impulsive events require selective acceleration such as the gyroresonant interaction with plasma waves. The energetic particles from these events arrive very quickly, around 15 minutes after a flare. In contrast, the gradual events have a strong association with coronal mass ejection (CME) and suggest that the particles in these events are accelerated by CME driven shocks. The energetic particles of these events are observed up to several hours after a flare. The effect on the interplanetary medium occurs preferentially during this post-eruptive phase (Kocharov et al., 1995). In the case of the first GLE, the association is with the two last flares on December 02 2004, whose X-ray prompt emission (the first) is of low intensity (C5.0 class) and (the second) is of medium intensity (M1.5 class). The delay between the X-ray prompt emission and the GLEs is 1.5 hours. Consequently they can be associated with the gradual or post-eruptive events. We would like to point out that the temporal shift between the two prompt X-ray emissions and the GLE’s peaks is practically the same.
Besides the GOES report of X-ray prompt and proton emissions, there is also the report by ACE EPAM WART60 of energetic nuclei such as flows of nuclei () of hydrogen, helium, oxygen and iron emitted by the sun during the flares in the proportion (at one AU from the SUN) in units of as hourly average flux (Shofield, 2003)222(Shofield 2003)is available at http://sd-www.jhuapl.edu/ACE/EPAM/janice/epmwww.cgi?2320+current+e. The beginning of the GLE coincides approximately with the decline of the Sun, when the Sun, was not far from field of view of the TUPI telescope (see Table 2).
On the other hand, an accurate determination of the fluence of solar energetic particles from the flare that might generate muons requires the obtaining of the muon energy spectrum. As already has been indicated, in the present stage of our experiment, the detector is only a directional counter telescope of muons above a energy threshold ( 0.3 GeV).
We have examined also the light curve for this GLE for other pulse-hight amplitude discrimination, as shown in Fig.5. The signal persists even when a high pulse amplitude is used as discrimination level. We would like to comment that there is a third solar X-ray flare () on 2003 December 2, with a beginning at UT. We did not register this because the raster scan only began at UT
4.2 The second ground level event (GLE 2003/12/16)
The GLE 2003/12/16 was also detected during an off-source raster scan. The light curve shape is like a FRED (fast rise exponential decay) as is shown in of Fig.6 (low panel). The excesses for this FRED GLE can be seen over a background rate of approximately 18 coincidences per 10 seconds with significance levels of . The origin of this GLE is unknown, because there is neither a satellites report of a solar flare, nor of prompt X-ray emission, nor an excess of protons or heavy particles during the raster scan where the GLE has been observed. We would like to highlight that the GLE’s duration is 416 seconds. This means that the GLE is not the remains of showers produced by conventional cosmic rays.
The enhancement of muons at sea level from solar flares is linked with the most energetic particles (i.e. protons, alphas…), those with energies above the pion production threshold and above the cut-off rigidity of the region where the detector is located. In fact, the pitch angle (where zero degree pitch angle represents sunward IMF direction) of high energy particles excess linked with solar flare presents a large anisotropy distribution (Duldig, 2001), with a systematic intensity excess around zero degree pitch angle and decreases up to 60 degrees. The excess at large pitch angle, those up to 180 degree as observed by large field of view detectors such as neutron monitors, are constituted by low energy particles. They are in the tail of the distribution, where the intensity is minimum.
Even so, the FRED GLE could be an event connected via the file magnetic lines, with a flare on the other side of the Sun, and not seen by satellites. The probability of detection using a directional telescope of small field of view (0.082 sr of angular window) pointed in a random direction, an event above the horizon is approximately . However, because the telescope can detect a fraction of muons, , even when the core of the air shower is at a distance from the telescope center, the probability is enhanced to ( for primary gamma-rays). is calculated using the lateral distribution function of muons (see sec.6). The detection of an event that happens on the other side of the Sun would correspond to a very large pitch angle, and from the considerations mentioned above, we estimate the probability of detecting a solar flare connected to the back of the Sun at less than 4%.
Another possibility (although remote) to explain the origin of this GLE is to invoke the GRB hypothesis. The temporal and directional coincidences of a GLE with satellite observations of GRBs are strong indications of a common detection. In fact this has been the main objective of several ground experiments, not only the detection of the GRBs TeV counterpart but also their afterglows at X-ray, optical and radio wavelengths. Nowadays it is expected that the rate of observation of GRBs by the GRB coordinate network (GCN) satellites (Barthelmy, 2001)333(Barthelmy 2001) is available at http://gcn.gsfc.nasa.gov/tc4 with the field of view of a large ground based detector such as MILAGRO is smaller than one per month (Smith, 2001).
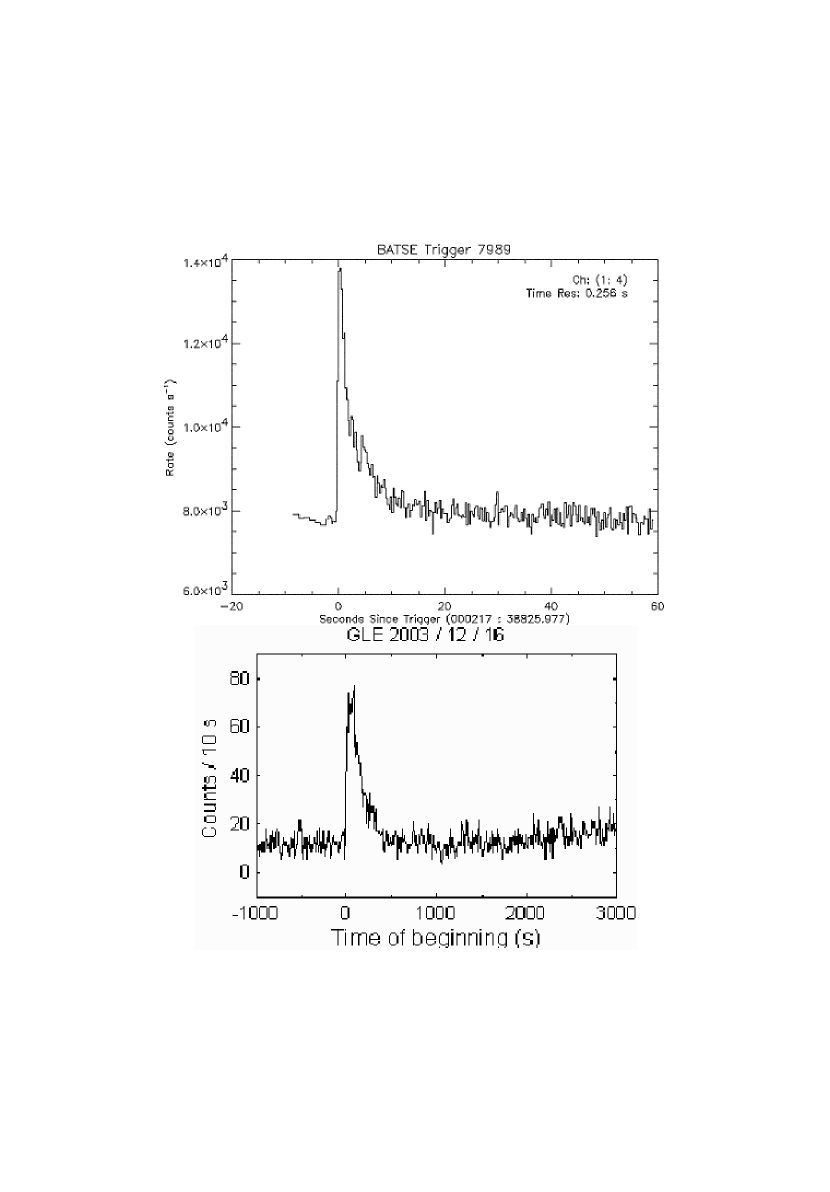
However, we have found GRB satellite notification around two hours from the beginning of the FRED GLE (see Table 2). While we don’t have other evidences which indicates a common detection with GRBs from GCN satellites. Fig.6 shows a comparison between the light curve shapes of the BATSE burst Trigger 7989 and the GLE 2003/12/16. Both are genuine FREDs. We have also examined the light curve for this GLE for other pulse-hight amplitude discrimination levels, as shown in Fig.7. The signal persists even when a high pulse amplitude is used as discrimination level, while the background is basically eliminated. It is possible to see that the signal observed in the GLE linked with the solar flare is more intense when compared with the signal of the FRED GLE.
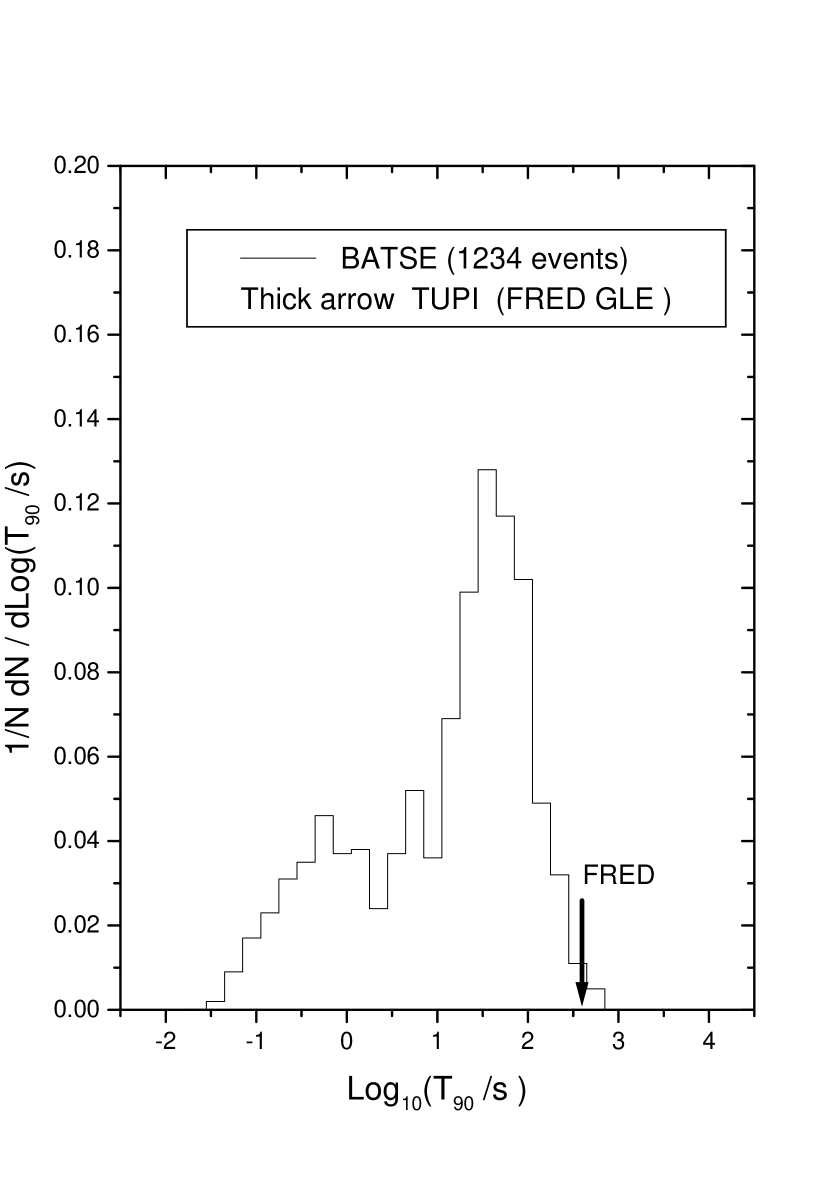
On the other hand, there is evidence for two classes of bursts when they are classified according to their duration. The result comes from BATSE catalog (Paciesas et al., 1999) as shown in Fig.8. We can see that the duration distribution of 1234 BATSE bursts is bimodal. The first is centered around the a small value of seconds and the second is centered around the a large value seconds, where is the duration for 90% of the bursts to occur. The arrow in Fig.8 shows the duration of the FRED GLE. We can see that its duration (416 seconds) is still inside that of the BATSE distribution.
5 Local effects
The counting rate of scintillator detectors at ground level is subject to several sources of modulation. The main ones are due to atmospheric pressure variation, solar activity and the 24 hours sidereal anisotropy. However, the temporal scales of these modulation phenomena are much larger than the GLEs duration.
In the case of a tracking telescope like the TUPI it is necessary to take into account the geomagnetic effect responsible for the muon flux dependence on azimuth angle (see section 3). Again the temporal scale to observe this effect is much larger than the GLEs duration.
In order to take into account possible anomalous pressure variations as being responsible of the GLEs, we have monitored the barometric pressure and included this in our data acquisition system. Every 10 seconds the counting rate and the atmospheric pressure are registered. Under normal conditions, the daily (24 h) variations of the atmospheric pressure present a maximum value and a minimum value. This tendency has been found during the raster scan where GLEs have been found. Fig.9 summarizes the situation where the pressure time series on 2003/12/02 is shown in the upper panel and its corresponding fast Fourier transformation (FFT) is shown in the lower panel. The arrow in the upper figure indicates the beginning of the GLE. The absence of peaks in the power spectrum means that there are no scintillation phenomena as indications of anomalies. The power spectrum gives an estimate of the mean square fluctuations at frequency f and, consequently, of the variations over a time scale of order . For the pressure case, the spectral density varies as and this quite steep spectral density is close to a correlated Brownian noise with , over many decades, or in other words, over all the 12 hours of the raster scan.
Consequently, pressure variation could not be a cause of the origin of the first GLE. A similar situation has been found for the second GLE.
6 Is there an enhancement of muons at sea level from GRBs?
There are several reports of ground level observations, of solar flares, especially those of high intensity (Bieber et al., 2002; Falcone Ryan, 1999; Swinson Shea, 1990), as well as the enhancement of muons at ground level from solar flares of large scale has been reported (Poirier D’Andrea, 2002; Munakata et al., 2001). However, the enhancement of muons at ground from GRBs remains open, at least they have not been observed with high confidence level. The Milagrito experiment, a predecessor of the (water Cherenkov) Milagro experiment, has reported evidence for the TeV counterpart of a BATSE GRB (970417) (Atkins et al., 2000). The GRAND project (muon detectors array at ground level) has reported some evidence of GRB detections in coincidence with one BATSE GRB (971110) (Poirier et al., 2003), even if with a low significance.
Besides the experimental evidence, several models for the origin of GRBs predict a TeV component (Totani, 1996; Dermer et al., 2000; Pilla et al., 1998). A plausible explanation for the extremely low rate of events observed in the TeV region is to invoke the attenuation of TeV photons by interaction with the intergalactic infrared radiation. This process would be responsible for a cut off for TeV GRBs whose sources are at distances larger than . However, for GRBs with GeV, the cut off can be shifted to . Consequently, in order to increase the GRBs rate detected at ground level a search for GRBs in a energy region above GeV has to be undertaken.
A primary photon converts to an pair after 1 radiation length (on average), in the atmosphere. In a subsequent radiation length the electromagnetic particles further lose energy by bremsstrahlung . The processes are repeated forming an electromagnetic air shower. All shower gamma rays (including the primary) above the photo-production cross section can contribute to the muon content in the shower. Despite the fact that gamma-rays in the energy band of 30 GeV to several TeV have only a 0.5% to 3% chance of undergoing interactions in the atmosphere yielding pions, the photons are more efficient at producing energetic, forward directed pions. The result comes from the Feynman-x distribution of charged pions obtained by using the FLUKA Monte Carlo simulation (Fassò Poirier, 2000). The interaction has a large fraction on high-x secondaries (pions) than interaction. The FLUKA results also show that the distribution of height above sea level at which the detected muons are produced has a peak at for proton showers (Batistone et al., 1998) and for photon showers (Poirier et al., 2001). In addition the distribution of the generation number of the grandparent of the sea level muon in gamma showers is a very narrow distribution and is peaked at generation one for energies below a few hundred where the parent is mainly produced in a photo-production process of the primary photon. This means that ”photo-muons” have a good chance of reaching ground level.
In order to estimate the number of muons reaching detection level which are initiated by primary gamma ray interactions in the atmosphere, we have used the muon kinetic energy spectrum within of a radial distance , from the shower center, on the basis of the FLUKA Monte Carlo program (Fassò Poirier, 2000). For simplicity only vertical incidence of primary gamma rays is taken into account. The spectrum per incident photon can by parameterized as
| (1) |
with all energies in GeV units. The parameters are , and is close to zero (integral flat distribution) in the muon energy band from 0.3 GeV to GeV and . A very small fraction of these muons are detected by the TUPI telescope with a acceptance, , which increases as the photon energy increases, and is given by
| (2) |
where and , is the fraction of muons that hit the telescope when the core of the photon shower is at a distance r from the telescope center. is calculated using the lateral muon distribution function. According to the FLUKA results (Poirier et al., 2001), and for photon primary energies between 3 GeV to GeV, the lateral muon function distribution extend to more than 10 km, whereas the sea level distribution have a relatively flat shape up to km. This means that up to km.
The biggest uncertainty of a GeV to TeV GRB is the shape of the primary photon spectrum. We assume a GRB as constituted by photons per , arriving at the top of the atmosphere inside the field of view of the TUPI telescope and with an energy spectrum of
| (3) |
extending from ( GeV) up to (several TeVs) and with a duration . The highest energy GRB observed by EGRET (Hurley et al., 1994) suggests fluxes around and spectrum index around , for energies near GeV,. These values are used in the calculation.
Under these conditions, the number of muons (GeV muons) reaching the TUPI telescope can be expressed as
| (4) |
where is the effective area, is the aperture and is the angular window of the TUPI telescope.
The signal in the detector, , must be compared with the square root of noise, , given by
| (5) |
where is the background muon intensity due to cosmic ray induced atmospheric showers. The value of necessary to consider an excess signal as a positive detection is above 4. The sensitivity of TUPI muons for gamma bursts is shown in Fig.10, for several spectral indices in the power law energy spectrum and for a duration of the the burst of . The observation of the bursts at ground level is strongly limited by the spectral index value, as well as by the highest photon energies of the spectrum. Bursts of very long duration, very high photon maximum energy and with energy spectra not quite so steep can be observed at ground level by using telescopes with a small muon energy threshold ().
The analysis on the basis of FLUKA’s results shows a real possibility of observing under certain conditions a GRB by the TUPI telescope. A more accurate analysis, given the complexity of the processes, requires a full Monte Carlo study including the detector response and geomagnetic effects on the charged muons.
7 Conclusions
We have reported a description and an analysis of two GLEs observed on December 2003 during a search for enhancements from the galactic center with muons at sea level and detected by using the TUPI telescope, after an upgrade of the data acquisition system. The main conclusions are summarized as follows:
(a)The TUPI telescope can detect muons at sea level with energies greater than the GeV required to penetrate the two flagstones or walls surrounding the telescope. The concrete reduces the noise due to other non-muon particles, for example, it is opaque to electrons. The telescope is sensitive to the conventional atmospheric muon flux. The muon flux obtained during a raster scan of 12 hours presents the well known West-East effect. In addition the geomagnetic effects distort the zenith angle distribution of sub-GeV to GeV muons
(b)The two GLEs analyzed here have been unambiguously detected, because in both cases the GLE signals survives even when a large amplitude discrimination is used, while the background is eliminated. This means that the chance of then being a fluctuation of the background is close to zero. In both cases, the GLEs are observed with a high significance level above (see Table2).
(c)The observation of the two GLEs is not restricted to a simple excess. It is possible to see their temporal structures, such as the light curves. The first GLE has a strong correlation with the two last solar flares on 2003/12/02. While, the second GLE (the FRED GLE) has an unknown origin, because there is no satellite report of solar flares, nor of prompt X-ray emission, nor an excess of nuclei during the raster scan where the GLE was observed. We estimate the probability of the origin of the FRED GLE be a solar flare connected to the back of the Sun as less than 4%.
(d)The muon flux is subject to several sources of modulation, such as the atmospheric pressure variation, solar activity and West-East effect, among others. However, the temporal scale of these modulation phenomena are much larger than the GLEs duration. In addition, no anomalous changes in the atmospheric pressure have been observed, during the raster scan where the two GLEs were found.
(e)We have found GRB satellite notification 52 minutes before the beginning of the FRED GLE (see Table2) and despite the FRED GLE duration being large (416 seconds), it is still inside the BATSE T90 duration distribution. As well as this, the long duration of the FRED GLE indicates that it is not the remains of showers produced by conventional cosmic rays. However, we don’t have other evidence which indicates a correlation with the GRBs detected by the GCN satellites.
(f) Finally, we show, by using the FLUKA Monte Carlo results, that there is a window for observed GRBs constituted by photons with energies above 10 GeV via ”photo-muon” production with energies at ground above GeV. The enhancement of muons at sea level from primary gamma rays (for energies below 100 GeV) it is a consequence of the lateral distribution function of muons at sea level in photo-showers being close to a flat distribution. The fraction of muons that hit the telescope when the core of the photon shower is at a distance from the telescope center is the same for up to km. In addition, for GRBs with flatter spectra, large duration and a high maximum photon energy the possibility of observation is enhanced (see Fig.10).
We are waiting for the next round of satellites with large area telescopes such as the GLAST (Atwood et al., 1994), they will be able to detect GRBs up to 300 GeV. The GLAST will be able to confirm the estimates mentioned above. Until then, we conclude that the FRED GLE analyzed here is only a potential candidate for sub-TeV GRBs.
References
- Augusto et al. (2003) Augusto, C. R. A. et al. 2003, Nucl. Ins. and Meth., NIMA, 503, 554
- Hayakawa (1969) Hayakawa, S., 1969, Cosmic Ray Physics, Nuclear and Astrophysical aspects (Wiley-Interscience a division of John Wiley Sons, New York)
- Tokiwa et al. (2003) Tokiwa, M. et al., 2003, in 28th ICRC, Tsukuba, 2709
- Boezio et al. (200) Boezio, M. et al. 2000, Phys Rev. D62, 032007
- Kremer et al. (1999) Kremer, J. et al. 1999, Phys. Rev. Lett. 83. 21, 4241
- Tanizaki et al. (2003) Tanizaki, K. et al. 2003, in 28th ICRC, Tsukuba, 1163
- Green et al. (1979) Green, P. J. et al. 1979, Phys Rev. D20, 1598
- Combs (2003) Combs, L. 2003 NOAA
- Smart and ref. in there (1996) Smart. D. F. 1996, Il Nuovo Ciment, 19C, 765
- Kocharov et al. (1995) Kocharov, L. G. et al. 1995, in 24th ICRC, Rome, 4, 163
- Shofield (2003) Shofield, J. 2003 ACE EPAM
- Duldig (2001) Duldig, M. L., 2001, in 27th ICRC, Hamburg, 3363
- Barthelmy (2001) Barthelmy, S. 2001 GCN NASA
- Smith (2001) Smith, A. J., 2001, in 27th ICRC, Hamburg, 2731
- Paciesas et al. (1999) Paciesas, W. S. et al. 1999, ApJS, 122, 465
- Bieber et al. (2002) Bieber, J. et al. 2002, ApJ, 622
- Falcone Ryan (1999) Falcone, A., Ryan, J. 1999, Astr. Part., 283
- Swinson Shea (1990) Swinson, D. B., Shea, M. A. 1990, Geophys. Research Lett. 8, 1073
- Poirier D’Andrea (2002) Poirier, J., D’Andrea, C. 2002, preprint(astro-ph/0211490)
- Munakata et al. (2001) Munakata, K. et al. 2001, in 27th ICRC, Hamburg, 3494
- Atkins et al. (2000) Atkins, R., et al. 2000, ApJ, 533, L119
- Poirier et al. (2003) Poirier, J. et al. 2004, preprint(astro-ph/0004379 v4)
- Totani (1996) Totani, T. 1999, ApJ, 11, 451
- Dermer et al. (2000) Dermer, et al. 2000, ApJ, 537, 785
- Pilla et al. (1998) Pilla., et al. ApJ, 494, L167
- Fassò Poirier (2000) Fassò, A. Poirier, J., 2001, Phys Rev. D63, 036002; preprint(astro-ph/0006196)
- Batistone et al. (1998) Batistone. G. et al., 1998, Astropart. Phys. 9, 277
- Poirier et al. (2001) Poirier, J., Roesler, S.,Fasso. A, preprint(astro-ph/0103030)
- Hurley et al. (1994) Hurley. H., et al. 1994, NATURE, 372, 652
- Atwood et al. (1994) Atwood, W. B. et al. 1994, Nucl. Inst. and Meth. NIM A, 342, 302


| Experiment | Azimuth | Zenith | R. cutoff (GV) | Energy (GeV) | W-E Asymmetry |
|---|---|---|---|---|---|
| TUPI aaIn raster scan regime | South East-South West | 9.8 | |||
| TUPI | East-West | 9.8 | |||
| Okayama | East-West | 12 |
| Data | Stard UT(h) | Significance level aaAt the peak | RA(deg)bbWith reference to the telescope axis | Dec(deg)bbWith reference to the telescope axis | Satellite Notification | RA(deg) | Dec(deg) |
|---|---|---|---|---|---|---|---|
| 2003/12/02 | 22:31 | 295.5 | 29 | 21:09(GOES12)Flare | Sun(247.9) | Sun(-22) | |
| 2003/12/16 | 20:26 | 303.0 | 29 | 19:34:22(HETE-2974)GRB | 94.32 | 9.24 |