Heated Intracluster Gas and Radio Connections: the Singular case of MKW 3s
Abstract
Similarly to other cluster of galaxies previously classified as cooling flow systems, the Chandra observation of MKW 3s reveals that this object has a complex X-ray structure hosting both a X-ray cavity and a X-ray filament. Unlike the other clusters, however, the temperature map of the core of MKW 3s shows the presence of extended regions of gas heated above the radially averaged gas temperature at any radius. As the cluster does not show evidences for ongoing major mergers Mazzotta et al. suggest a connection between the heated gas and the activity of the central AGN. Nevertheless, due to the lack of high quality radio maps, this interpretation was controversial. In this paper we present the results of two new radio observations of MKW 3s at 1.28 GHz and 604 MHz obtained at the GMRT. Together with the Chandra observation and a separate VLA observation at 327 MHz from Young, we show unequivocal evidences for a close connection between the heated gas region and the AGN activity and we briefly summarize possible implications.
I Introduction
Although cooling flows (see Fabian 1994 for a review) is expected to be the natural state of cluster cores XMM and Chandra observations show that little of the gas cools below 1 keV (see e.g. Peterson et al. 2001, Kaastra et al. 2001, Tamura et al. 2001). To explain the observed disagreement with “simple” cooling flow expectations, a number of authors propose different physical mechanisms able to provide enough heating to the gas to compensate the radiative losses (see e.g. Fabian et al. 2001). One of such mechanism is heating by an active galactic nucleus (AGN; e.g. Binney & Tabor 1995). Although many Chandra observations clearly show that AGN may efficiently inflate bubbles in the hot gas, to date it is not clear if they may provide enough heat to quench colling flows (see e.g. Birzan et al. 2004). In some cases it has been even raised the question if bubbles inflated by radio jet can even heat the gas at all. Earlier X-ray observations, in fact, did not show any strong indication of heated gas in proximity of the expanding bubbles (e.g. Allen et al. 2001), contrary to what expected in jet-feed radio lobes models that predict possible formations of shocks waves. In some cases, as in Perseus, the data show that the coolest gas in the core lies immediately around the radio lobes (Fabian et al. 2000). Nevertheless, evidences for the presence of weak shock has began to emerge recently with notably examples in Perseus (Fabian et al. 2003), Virgo (Forman et al. 2003), and Hydra A (Nulsen et al. 2004).
Before those, evidences for gas heating possibly connected with the activity of the central AGN were reported in MKW 3s by Mazzotta et al. (2002). Despite of the large extent of the heated gas region, its connection with the central AGN activity was a bit controversial due to the lack of high quality radio observations. In this paper we present the results of the analysis of two new radio observations of MKW 3s at 1.28 GHz and 604 MHz obtained at the Giant Metrewave Radio Telescope (GMRT, Pune, India). By comparing them with the Chandra results of Mazzotta et al. 2002 and making use of a 327 MHz radio map from Young (2004) obtained at the Very Large Array (VLA, Socorro, New Mexico, USA) we show clear evidences of a close connection between the AGN activity and the heated gas region in this cluster.
We use km s-1 kpc-1, which implies a linear scale of 0.87 kpc per arcsec at the distance of MKW3s ().
II X-ray Observation
MKW 3s was observed on April 2000 in ACIS-I with an exposure of ksec. A first analysis of these data done by Mazzotta et al. (2002) revealed that the center of this cluster is quite complex. Here we highlight only the most interesting features and we refer to Mazzotta et al. (2002) for details.
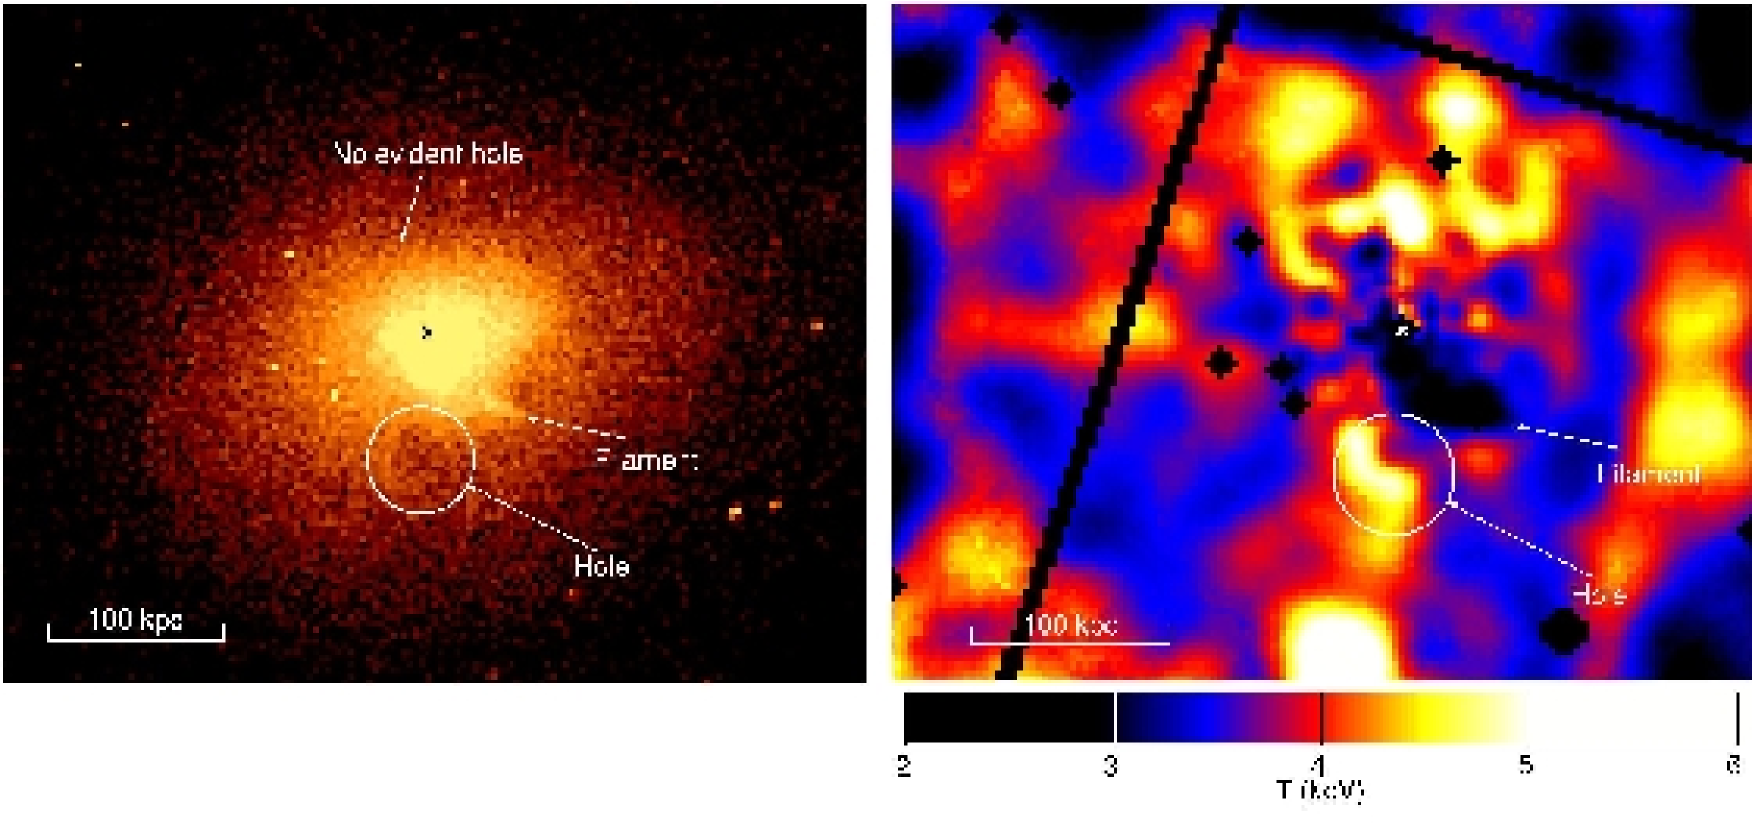
In the left panel of Figure 1 we report the keV, background subtracted, vignetting corrected Chandra image of MKW 3s from Mazzotta et al. (2002). The most interesting features are: i) a surface brightness filament extending from the cluster center to the south-west; ii) a circular-like depression to the south of the X-ray peak.
In the right panel of Figure 1 we report the temperature map from Mazzotta et al. (2002). This image reveals that the temperature structure of the core of MKW 3s is even more complex than its X-ray surface brightness. Mazzotta et al. (2002) focused on the nature of the extended hot regions keV. The most interesting aspect of these regions is that their temperature is significantly higher than the radially averaged gas temperature at any radius (see Figure 3 and Figure 4 of Mazzotta et al. 2002). As both the X-ray surface brightness structure at larger radii and the galaxy velocity distribution do not indicate any significant ongoing major merger event (see e.g. Buote & Tsai 1996, Giradi et al. 1997), Mazzotta et al. 2002 argue that there should be a strong connection between the heated gas and the activity of the central AGN.
III Radio Observations
MKW 3s was observed in August 2003 with the Giant Metrewave Radio Telescope (GMRT, Pune, India) at 1.28 GHz, 604 and 235 MHz. The 235 MHz observations suffered from major interference, and could not be used. The source was observed in snapshot mode for a total of 1 hour at 1.28 GHz and 1.5 hours at 604 MHz, in spectral line mode (128 frequency channels) with a total bandwidth of 32 MHz and 16 MHz respectively. The data reduction was carried out with the NRAO Astronomical Image Package Software (AIPS). We produced a set of images with resolutions ranging from to at both frequencies, in order to highlight both the small scale features and to image the large scale low surface brightness emission. The rms in our images is in the range 0.05 mJy/beam to 0.3 mJy/beam.
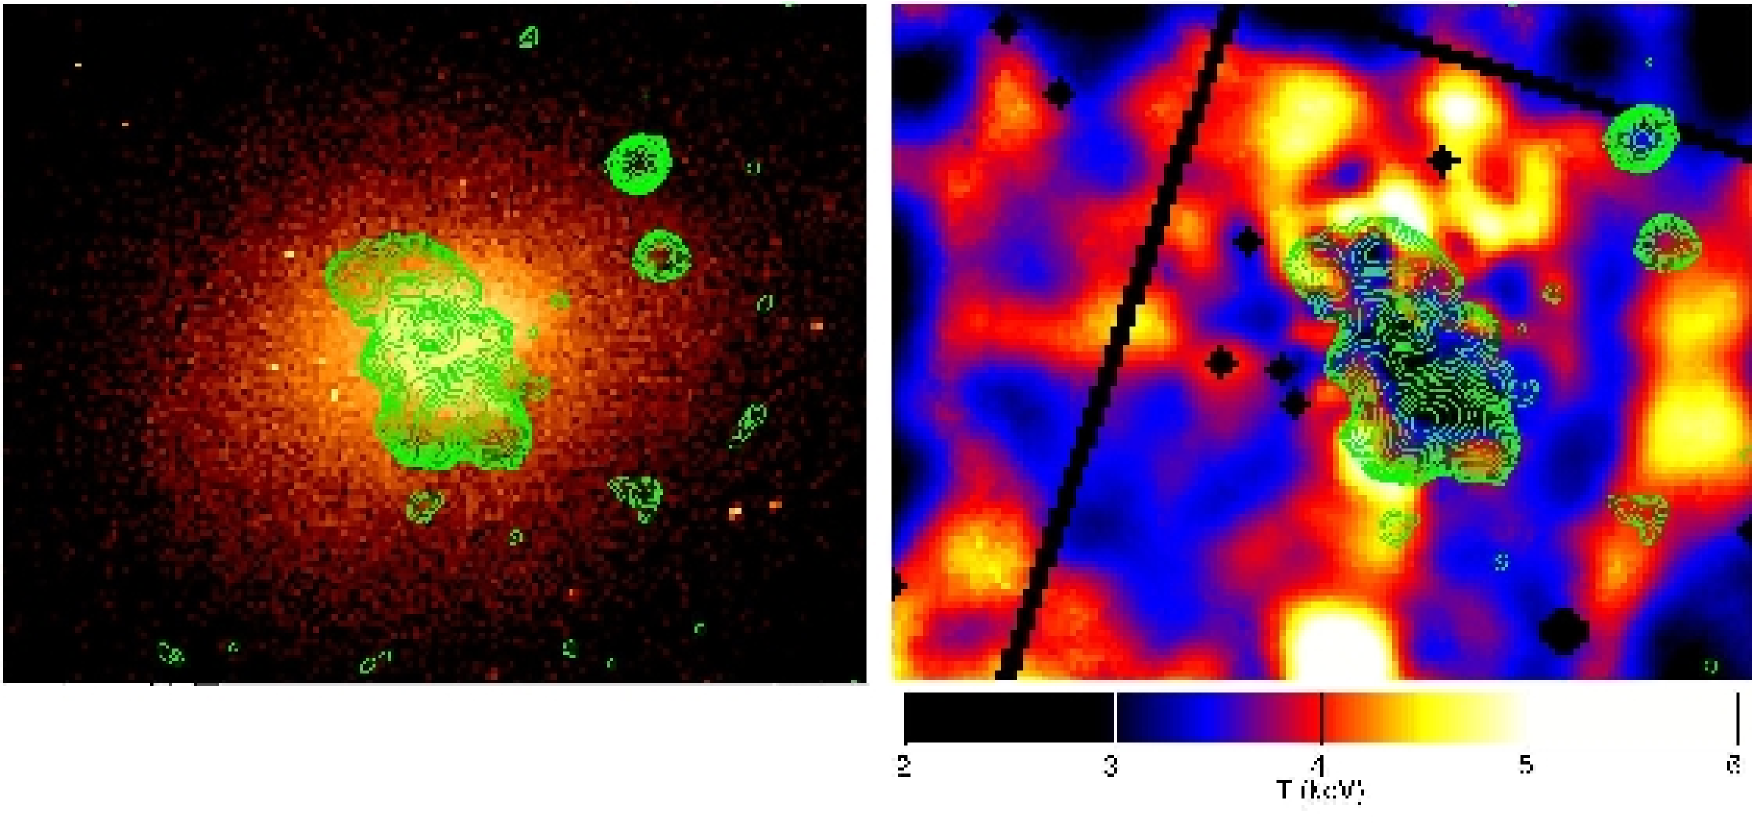
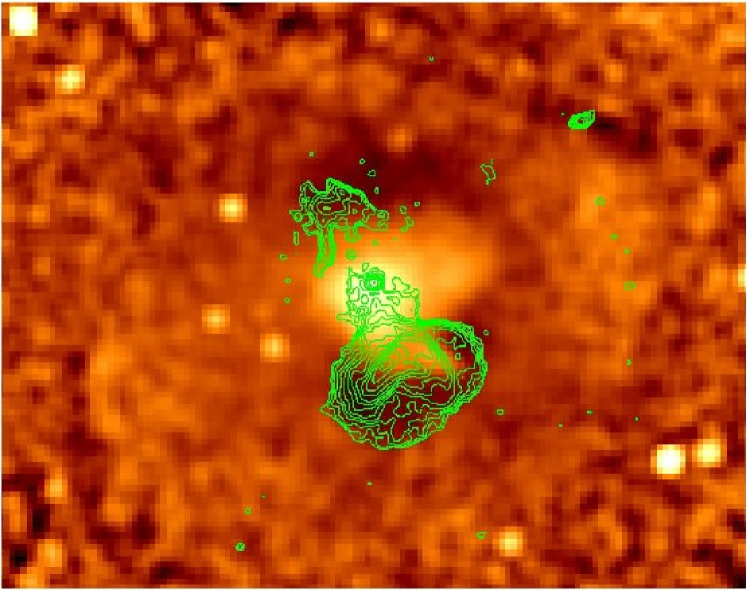
The left and right panels of Figure 2 show the radio contours at 1.28 GHz overlaid to the Chandra image and temperature map of MKW3s. The resolution of this radio map is . The radio emission from the center of MKW 3s consists of three distinct components, i.e. a point source associated with the nucleus of the dominant cD galaxy NGC5920, which contains only a tiny fraction of the total flux in the source, an extended region located south of the point source (southern lobe), and a very low surface brightness region located north–east of the compact region (northern lobe).
We notice that: i) that the southern radio lobe fills the Souther X-ray hole; ii) both radio lobes seem to be contained (confined) by (or interacting with) the extended hot regions close to the cluster center.
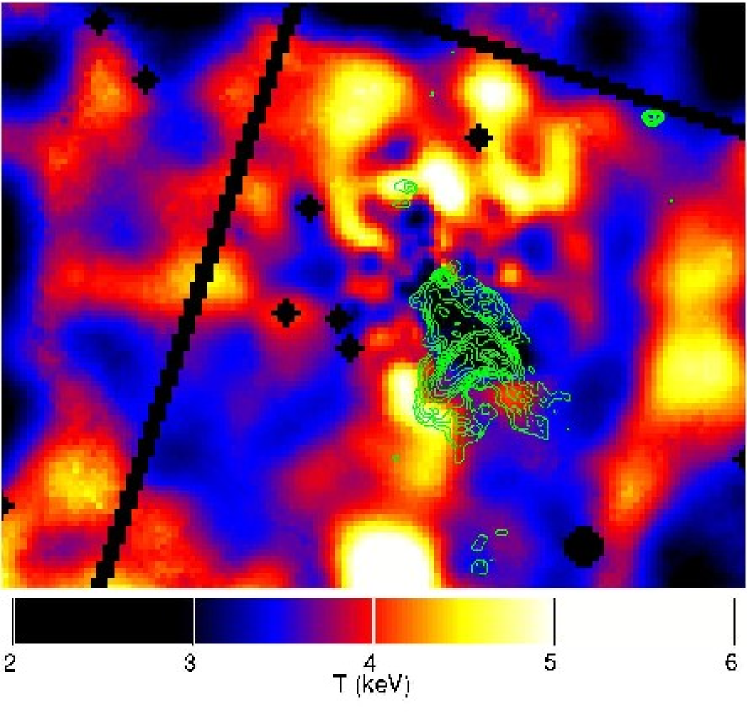
In Figure 3 we show the radio contours at 604 MHz overlaid to the temperature map of MKW3s. Unfortunatelly, due to the presence of residual errors in the data, in this observation the northern lobe is not properly imaged.
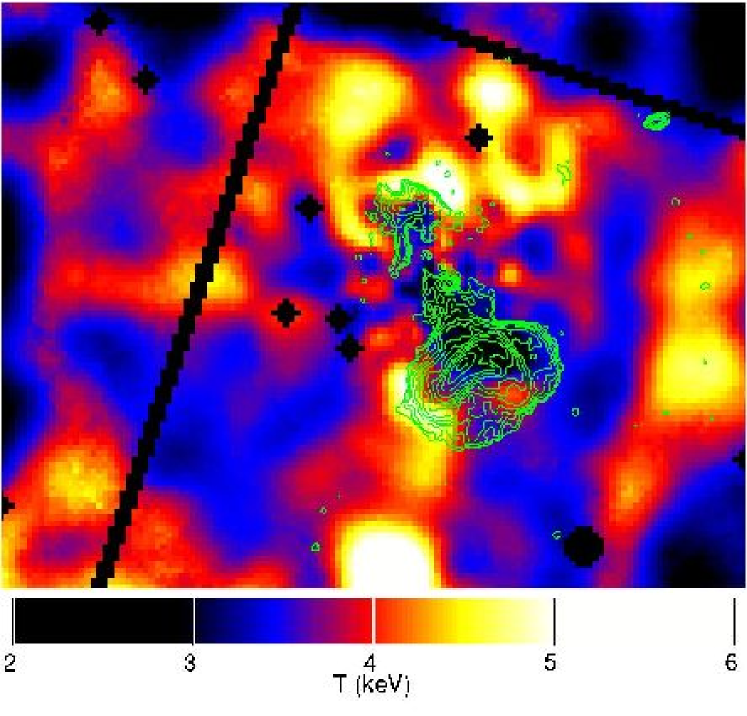
Finally in Figure 4 we show the VLA (Very Large Array, Socorro, New Mexico, USA), A configuration 327 MHz radio contours from Young (2004) overlaid to the temperature map. The resolution of this radio map is .
Unlike the 604 MHz, in this lower frequency observation the northern lobe is well imaged. Similarly to the 1.28 GHz observation, it shows that both radio lobes may be interacting with the extended hot regions.
We conclude this section by noticing that the southern lobe is the dominant feature at all frequencies, and it is characterized by a filamentary structure, with a ridge of emission containing most of its flux density. Each component in the source has a very steep spectrum, in agreement with the reported ultra–steep spectrum (De Breuck et al. 2000), including the compact component, coincident with the optical galaxy, whose spectral index is .
IV Spectrum and Age of The radio Lobes
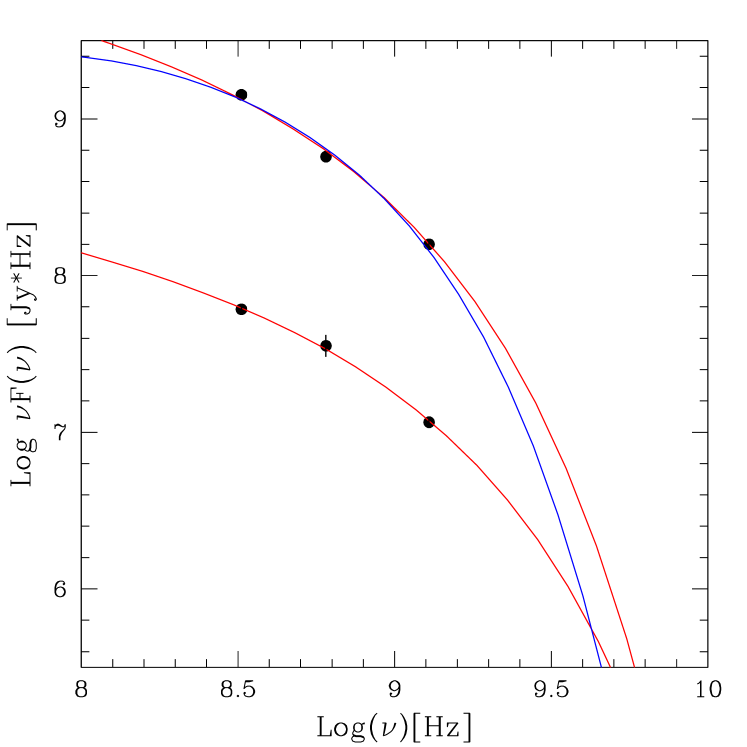
We use the radio spectral informtion to estimate the radiative age of the radio lobes as shown in Figure 5. The spectrum of both lobes is very steep. The spectral index of the southern and northern lobe between 327–604 MHz is 2.5 and 1.9, respectively. The 1.28 GHz points obtained by the GMRT observations reveal a steepening at higher frequencies of both components.
Assuming an injection spectrum of the relativistic electrons with , a continuous injection model (e.g., Kardashev 1962), in which electrons are continuously injected in a region of constant magnetic field, is not able to reproduce the data due to the very steep spectrum. At the same time, due to the combination of a steep spectrum and of a only moderate curvature, also a JP model (Jaffe & Perola 1973), in which a coheve population of relativistic electrons simply age in a region of constant magnetic field, is not a good model for the data.
One alternative is to use a model of the emitting plasma in which electrons have been continuously injected in the past and are now simply aging due to the radiative losses (Figure 5). In this case, if the value of the magnetic field in the two components is in the range G (which is also barely consistent with the equipartition value) then the age of the radio lobes should be in the range Gyrs and the process of continuous injection should have been stopped about yrs ago.
A second possibility is that the two extended radio lobes are buoyant bubbles injected by the central source about yrs ago which are in the process of being mixed with the ICM. In this case magnetized filaments are produced by the development of plasma instabilities in the radio volume and the total synchrotron emission results from the convolution of different spectra produced by relativistic electrons emitting in regions with different values of the magnetic field strength (e.g., Tregillis, Jones, Ryu 2004). It is well known that the resulting convolution of the synchrotron Kernel with magnetic field intensity and geometry yields a total spectrum which is stretched and thus not straightforwardly related to the spectrum of the emitting electrons (e.g., Eilek & Arendt 1996; Katz–Stone & Rudnick 1999) and which depends also on the power spectrum of the magnetic field fluctuations.
Future observations at higher frequency are required in order to better test different modelings.
V Discussion and Conclusions
In this paper we compare the Chandra X-ray observation of MKW 3s with some radio observations obtained with the GMRT and VLA. The radio emission in the cluster center is consistent with been produced by AGN. Figures 2, 3, and 4 clearly show that at any frequency there is a good match between the hot temperature structures in the ICM and the shapes of the radio lobes. In particular it looks like that the hot gas structure some how interacts and/or confines the radio emission.
It is important to say that, as reported by Mazzotta et al. (2002), the X-ray image of MKW 3s shows the presence of only one X-ray cavity coincident with the souther radio lobe (see left panels of Figure 1 and Figure 2) and there are no clear evidences for other cavities opposite to it with respect to the X-ray peak. Nevertheless, with these new radio data in hand, we tried to push the limit of the imaging analysis and we manipulated the original image to produce an unsharp-masked image. To do that we first smoothed the original image with a Gaussian filter with and (image and , respectively) and we calculated the unsharp-masked image as . In Figure 6 we report the unsharp-masked image of MKW3s overlaid to the 327 MHz VLA radio contours as shown in Figure 4. It is interesting to note that this map indicates the presence of a second X-ray hole opposite to the southern one which seems to be well correlated with the northern radio lobe.
All the above considerations represent a pretty good evidence that there should be a strong connection between the shape of the radio lobes and the thermal structure. The implications of this connection will be discussed in details in forthcoming paper. Here we limit ourself to a very short summary.
In particular we say that one possibility to explain the data is that the radio lobes expand in the ICM and heat the gas. This would represent the first evidence of significant amount of gas heated by the AGN. Nevertheless, it is not clear which is the physical mechanism responsible for the heating. Shock heating, in fact, can be partially excluded as, in correspondences of the hot regions, there are no strong evidences of gas density jumps consistent with shock wave propagation.
ACKNOWLEDGEMENTS We are gratefully to L.Rudnick for providing us with the 327 MHz VLA radio map of MKW3s. This work is supported by CXC grants GO3-4163X and by European contract MERG-CT-2004-510143.
REFERENCES
Allen, S. W., et al. 2001, MNRAS, 324, 842
Binney, J. & Tabor, G. 1995, MNRAS, 276, 663
Buote, D. A. & Tsai, J. C. 1996, ApJ, 458, 27
De Breuck, C., van Breugel, W., Röttgering, H. J. A., & Miley, G. 2000, A&AS, 143, 303
Eilek, J. & Arendt, P.N. 1996, ApJ 457, 150;
Fabian, A. C. 1994, ARA&A, 32, 277
Fabian, A. C., et al. 2000, MNRAS, 318, L65
Fabian, A. C., Mushotzky, R. F., Nulsen, P. E. J., & Peterson, J. R. 2001, MNRAS, 321, L20
Fabian, A. C., Sanders, J. S., Allen, S. W., Crawford, C. S., Iwasawa, K., Johnstone, R. M., Schmidt, R. W., & Taylor, G. B. 2003, MNRAS, 344, L43
Forman, W., et al. 2003, ArXiv Astrophysics e-prints, astro-ph/0312576
Girardi, M., Escalera, E., Fadda, D., Giuricin, G., Mardirossian, F., & Mezzetti, M. 1997, ApJ, 482, 41
Jaffe, W. J. & Perola, G.C. 1973, A&A 26, 423
Kaastra, J. S., Ferrigno, C., Tamura, T., Paerels, F. B. S., Peterson, J. R., & Mittaz, J. P. D. 2001, A&A, 365, L99
Kardashev, N. S. 1962, Soviet Astronomy 6, 317
Katz-Stone, D. M., Rudnick, L., Butenhoff, C., & O’Donoghue, A. A. 1999, ApJ, 516, 716
Mazzotta, P., Kaastra, J. S., Paerels, F. B., Ferrigno, C., Colafrancesco, S., Mewe, R., & Forman, W. R. 2002, ApJ, 567, L37
Nulsen, P. E. J., McNamara, B. R., Wise, M. W., & David, L. P. 2004, ArXiv Astrophysics e-prints, astro-ph/0408315
Peterson, J. R., et al. 2001, A&A, 365, L104
Tamura, T., et al. 2001, A&A, 365, L87
Tregillis, I. L., Jones, T. W., & Ryu, D. 2004, ApJ, 601, 778
Young, A. 2004, Ph.D. Thesis, Univ. of Minnesota.