GMRT study of extremely faint dwarf irregular galaxies
Abstract
We present results of deep, high velocity resolution (1.6 kms-1) Giant Meterwave Radio Telescope (GMRT) HI 21 cm-line observations of a sample of extremely faint (M12.5) dwarf irregular galaxies. Unlike previous studies, we find large scale velocity gradients in even the faintest galaxies of our sample i.e. their velocity fields are not “chaotic”. For some of our sample galaxies, where the velocity fields are in fact completely consistent with ordered rotation, we derive rotation curves and determine the structure of the dark matter halos of the galaxies from mass modeling, using the “asymmetric drift” corrected rotation velocities. Finally, we compile from literature a sample of galaxies with known dark matter distribution, estimated from HI synthesis observations, and discuss the results and their implications for hierarchical galaxy formation models.
keywords:
galaxies: dwarf – galaxies: kinematics and dynamics – galaxies: individual: Camelopardalis B galaxies: individual: DDO2101 Introduction
In hierarchical galaxy formation models, based on the cold dark matter (CDM) paradigm, very small dwarf galaxies are excellent candidates for earliest formed galaxies. Numerical simulations based on these models make definitive predictions about the average density and shape of the dark matter distribution in such galaxies. These dwarf systems are typically dark matter dominated, even in the innermost regions, unlike bright galaxies where the stellar population is dynamically important. Dwarf galaxies could hence provide an unique opportunity to compare observations with the CDM simulations.
According to the numerical simulations, mass-density distribution in the inner parts of the simulated dark matter halos could be well described by a cusp i.e. r-1 power law. This cusp in the density distribution manifests itself as a steeply rising rotation curve in the inner regions of galaxies. However, this prediction from CDM simulations is found to disagree with the observed rotation curves of several dwarf galaxies (e.g. deBlok & Bosma 2002); the data indicate a constant density core dark matter distribution. Apart from the shape of the dark matter halos, numerical simulations also predict an anti-correlation between the characteristic density and the virial mass of the dark matter halos. In hierarchical scenarios, the low mass halos form at the earlier times, when the background was higher, hence dwarf galaxies should have larger dark matter densities.
All these predictions of the numerical simulations were however untested in the faintest dwarf galaxies, as it was widely believed that very faint dwarf irregular galaxies do not show any systematic rotational motions. From a systematic study of the kinematics of a sample of dwarfs, Côté, Carignan & Freeman (2000) found that normal rotation is seen only in galaxies brighter than -14 mag, while fainter dwarfs have disturbed kinematics. This result is consistent with the earlier findings of Lo, Sargent & Young (1993), who from a study of a sample of dwarfs (with M to M) found that very faint dwarf irregulars have chaotic velocity fields. However, most of the previous studies were done with a coarser velocity resolution and modest sensitivities.
Inorder to study the kinematics of very faint dwarf irregular galaxies, we obtained high velocity resolution and high sensitivity GMRT HI 21 cm-line observations of a sample of galaxies with M12.5. The GMRT has a hybrid configuration which simultaneously provides both high angular resolution ( 2′′ if one uses baselines between the arm antennas) as well as sensitivity to extended emission (from baselines between the antennas in the central square). This unique hybrid configuration of the GMRT makes it an excellent facility to study such galaxies. The velocity resolution used for our observations was kms-1 and the typical integration time on each source was 18 hrs, which gave a typical rms of 1.0 mJy/Beam per channel. The galaxies in our sample have typical HI masses 10 6-8 M⊙.
We present here the results obtained from our GMRT observations.
2 Results of The GMRT Observations
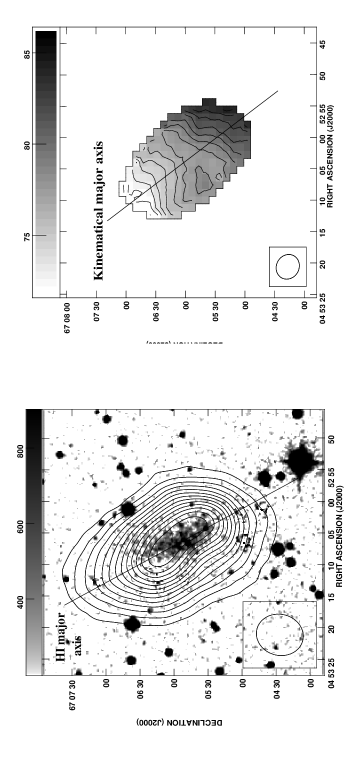
Figs.1[B],3[B] show the velocity fields for some of the galaxies in our sample. Our GMRT observations clearly show that the earlier conclusions about the kinematics of faintest galaxies were a consequence of observational bias. Since most of the earlier studies of faint dwarf galaxies were done with coarser velocity resolutions ( kms-1) and modest sensitivities, hence, such observations could not detect systematic gradients, which are typically kms-1, in the velocity fields of such faint dwarfs. On the other hand, our high velocity resolution and high sensitivity observations found large scale systematic velocity gradients in even the faintest galaxy in our sample i.e. DDO210. The velocity field for DDO210, differs significantly from the velocity field derived earlier by Lo et al.(1993). The pattern seen in the GMRT velocity field of DDO210 (fig. 1[B]) is, to zeroth order, consistent with that expected from rotation, on the other hand, the velocity field derived by Lo et al.(1993) based on a coarser velocity resolution of 6 kms-1, is indeed “chaotic”. This difference in the observed kinematics suggests that high velocity resolution and high sensitivity is crucial in determining the systematic gradients in the velocity fields of faint galaxies. For some of the galaxies in our sample this large scale systematic gradients could be modeled as systematic rotation, hence allowing us to derive the rotation curve for those galaxies and to determine the structure of their dark matter halos through mass modelling. The rest of this paper discusses the results obtained from the detailed mass modelling of two of our sample galaxies viz. Camelopardalis B (Cam B;M10.9) and DDO210 (M10.6).
2.1 Camelopardalis B
Fig. 1[A] shows the integrated HI column density image of Cam B at 40 resolution overlayed on the optical DSS image. The HI mass obtained from the integrated profile (taking the distance to the galaxy to be 2.2 Mpc) is 5.30.5 M⊙ and the MHI/LB ratio is found to be 1.4 in solar units.
The velocity field derived from the moment analysis of 24 resolution data is shown in the Fig. 1[B]. The velocity field is regular and the isovelocity contours are approximately parallel, this is a signature of rigid body rotation. The kinematical major axis of the galaxy has a position angle 215∘, i.e. it is well aligned with the major axis of both the HI distribution and the optical emission.

The rotation curve for Cam B was derived from the velocity fields at 40, 24 and 16 resolution using the tilted ring method (see Begum, Chengalur and Hopp 2003 for details). The derived hybrid rotation curve is shown as a dashed curve in Fig. 2[A]. We find that the peak inclination corrected rotational velocity for Cam B ( 7.0 kms-1) is comparable to the observed HI dispersion i.e. V. This implies that the random motions provide significant dynamical support to the system. In other words, the observed rotational velocities underestimate the total dynamical mass in the galaxy due to a significant pressure support of the HI gas. Hence, the observed rotation velocities were corrected for this pressure support, using the usual “asymmetric drift” correction, before constructing mass models (see Begum et al (2003) for details). The dot-dashed curve in Fig. 2[A] shows the “asymmetric drift” corrected rotation curve.
Using the “asymmetric drift” corrected curve, mass models for Cam B were derived. The best fit mass model using a modified isothermal halo is shown in Fig. 2[B]. Also shown in the figure is the best fit total rotation curve for an NFW type halo. As can be seen, the kinematics of Cam B is well fit with a modified isothermal halo while an NFW halo provides a poor fit to the data.
The “asymmetric drift” corrected rotation curve for Cam B is rising till the last measured point (Fig. 2[B]), hence the core radius of the isothermal halo could not be constrained from the data. The best fit model for a constant density halo gives central halo density () of 12.0 pc-3. The derived is relatively insensitive to the assumed mass-to-light ratio of the stellar disk (). We found that by changing from a value of 0 (minimum disk fit) to a value of 2.0 (maximum disk fit), changes by 20%. From the last measured point of the observed rotation curve, a total dynamical mass of 1.1 is derived, i.e. at the last measured point more than 90% of the mass of Cam B is dark. Futher, the dominance of the dark matter halo together with the linear shape of the rotation curve (after correction for “asymmetric drift”) means that one cannot obtain a good fit to the rotation curve using an NFW halo regardless of the assumed .

2.2 DDO210
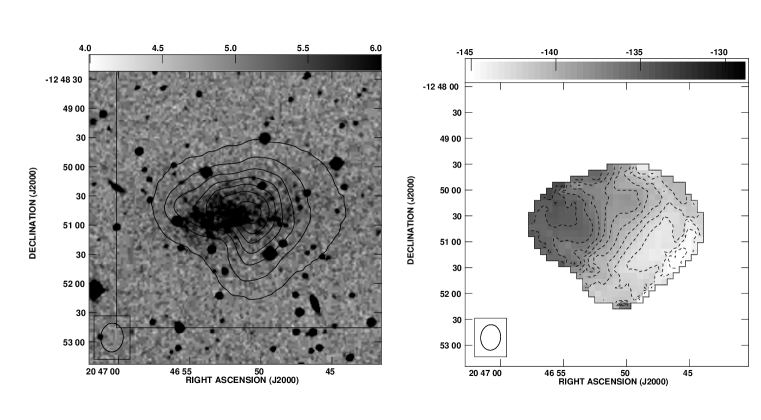
DDO210 is the faintest known gas rich dwarf galaxy in our local group. Karachentsev et al.(2002), based on the HST observations of the I magnitude of the tip of the red giant branch, estimated the distance to this galaxy to be 95050 kpc. Fig. 3[A] shows the integrated HI column density image of DDO210 at 44 resolution overlayed on the optical DSS image. The HI isodensity contours are elongated in eastern and southern half of the galaxy, indicating a density enhancement in these directions.The HI mass obtained from the integrated profile (taking the distance to the galaxy to be 1.0 Mpc) is 2.80.3 M⊙ and the MHI/LB ratio is found to be 1.0 in solar units.
The velocity field of DDO210 derived from the moment analysis of 29 resolution data cube is shown in Fig. 3[B]. The velocity field is regular and a systematic velocity gradient is seen across the galaxy.
Fig. 4[A] shows the derived rotation curve for DDO210 and the “asymmetric drift” corrected rotation curve. We find that the “asymmetric drift” corrected rotation curve of DDO210 can be well fit with a modified isothermal halo (with a central density pc-3). In the case of the NFW halo, we find that there are a range of parameters which provide acceptable fits e.g. (v 20 kms-1, c 10) to (v 500 kms-1, c 0.001); the halo parameters could not be uniquely determined from the fit. However, the best fit value of the concentration parameter c, at any given v200 was found to be consistently smaller than the value predicted by numerical simulations for the CDM universe (Bullock et al. 2001). Fig. 4[B] shows the best fit mass models for DDO210 (see Begum & Chengalur 2004 for details).

3 Discussion
Fig. 5 shows the core density of isothermal halo against circular velocity and absolute blue magnitude for a sample of galaxies, spanning a range of magnitudes from M mag to M mag. Cam B and DDO210 are also shown in the figure, lying at the low luminosity end of the sample. As can be seen in the figure, there is a trend of increasing halo density with a decrease in circular velocity and absolute magnitude, shown by a best fit line to the data (solid line), although the correlation is very weak and noisy. Further, as a guide to an eye, we have also binned the data and plotted the median value (solid points). Binned data also shows a similar trend. Such a tread is expected in hierarchical structure formations scenario (e.g. Navarro, Frenk & White 1997).
References
- [1] Begum, A., Chengalur, J. N. & Hopp, U. 2003, New Astronomy, 8, 267.
- [2] Begum, A. & Chengalur, J. N. 2004, Astron. Astrophys, 413, 525.
- [3] Broeils, A. 1992, Ph.D. thesis, Rijksuniversiteit Groningen
- [4] Bullock, J. S. et al. 2001 MNRAS, 321, 559.
- [5] Côté, S., Carignan, C. & Freeman, K. C. 2000, Astron. J., 120, 3027.
- [6] deBlok, W. J. G. & Bosma, A. 2002, Astron. Astrophys, 385, 816.
- [7] Karachentsev, I. D. et al. 2002, Astron. Astrophys, 389, 812.
- [8] Lo, K. Y., Sargent, W. L. W. & Young, K. 1993, Astrophys. J., 106, 507.
- [9] Swaters, R. 1999, Ph.D. thesis, Rijksuniversiteit Groningen
- [10] Verheijen, M.A.W. 1997, PhD thesis, Rijkuniversiteit Groningen