The Opacity of Spiral Galaxy Disks IV:
Radial Extinction Profiles from Counts of Distant Galaxies seen through Foreground Disks.
Abstract
Dust extinction can be determined from the number of distant field galaxies seen through a spiral disk. To calibrate this number for the crowding and confusion introduced by the foreground image, González et al. (1998) and Holwerda et al. (2005a) developed the “Synthetic Field Method” (SFM), which analyses synthetic fields constructed by adding various deep exposures of unobstructed background fields to the candidate foreground galaxy field.
The advantage of the SFM is that it gives the average opacity for area of galaxy disk without assumptions about either the distribution of absorbers or of the disk starlight. However it is limited by low statistics of the surviving field galaxies, hence the need to combine a larger sample of fields. This paper presents the first results for a sample of 32 deep HST/WFPC2 archival fields of 29 spirals.
The radial profiles of average dust extinction in spiral galaxies based on calibrated counts of distant field galaxies is presented here, both for individual galaxies as well as for composites from our sample. The effects of inclination, spiral arms and Hubble type on the radial extinction profile are discussed.
The dust opacity of the disk apparently arises from two distinct components; an optically thicker () but radially dependent component associated with the spiral arms and a relatively constant optically thinner disk (). These results are completely in agreement with earlier work on occulted galaxies. The early type spiral disks in our sample show less extinction than the later types. LSB galaxies and possibly Sd’s appear effectively transparent. The average color of the field galaxies seen through foreground disks does not appear to change with radius or opacity. This grey behaviour is most likely due to the patchy nature of opaque clouds. The average extinction of a radial annulus and its average surface brightness seem to correlate for the brighter regions. This leads to the conclusion that the brighter parts of the spiral disk, such as spiral arms, are also the ones with the most extinction associated with them.
1 Introduction
The optical depth of spiral disks has been the topic of many and varied studies since the claim by Holmberg (1958) that they are transparent. The subject became controversial when Disney et al. (1989) and Valentijn (1990) argued that disks were virtually opaque. At the Cardiff meeting (Davies and Burstein, 1995) many possible methods to attack the problem were proposed. The dust disks of spirals may obscure objects in the high redshift universe (Alton et al., 2001; Ostriker and Heisler, 1984) or conceal mass in their disks (Valentijn, 1990; Cuillandre et al., 2001). An excellent review of the current state of knowledge on the opacity of spiral disks is given by Calzetti (2001).
Early approaches to this subject were presented in Davies and Burstein (1995) and more recent developments are:
(1) disks are more opaque in the blue (Tully et al., 1998; Masters et al., 2003),
(2) they are practically transparent in the near infrared (Peletier and Willner, 1992; Graham, 2001), making these bands the best mass-to-luminosity estimator (de Jong, 1996),
(3) disks are practically transparent in the outer parts but show
significant absorption in the inner regions (Valentijn, 1994; Giovanelli et al., 1994),
(4) the extinction correlates with galaxy luminosity (Giovanelli et al., 1995; Tully et al., 1998; Masters et al., 2003), and
(5) spiral arms are more opaque than the disk (Beckman et al., 1996; White et al., 2000)
The majority of these studies are based on either inclination effects on the light distribution of a large
sample of disks or a dust and light model to fit the observed profiles.
While there is some agreement on the view that spiral disks are substantially optically thick in their central regions and become optically thin in their outer parts, the exact radial extinction profile remains uncertain. Most measurements to date use the disk light itself to measure the extinction, and consequently require an assumption on the relative distribution of dust and light in a spiral disk.
The extinction in a disk can be derived from far infrared and sub-mm emission arising from the cold dust in disks. However, these methods make the assumption that the emission characterises the dust in the disk. But the far infrared and sub-mm emission is likely to be dominated by the warmest component of the dust, which tends to be the smaller grains on the outside of molecular clouds facing an energy source (Dale and Helou, 2002; Helou et al., 2000). In this case the far-infrared and sub-mm emission will underestimate the average opacity. Mayya and Rengarajan (1997) mention this in their estimate of gas-to-dust ratio in spiral disks based on IRAS observations.
To obtain a better characterisation of the absorption in a spiral disk without knowledge of the distribution of stars and dust in the disk, a known background source is needed. White and Keel (1992) proposed to use an occulted galaxy for this purpose, assuming it has a symmetric light distribution (Domingue et al., 1999; White et al., 2000; Domingue et al., 2000; Keel and White, 2001a, b). González et al. (1998) and the companion paper of this work (Holwerda et al., 2005a) use the number of distant galaxies in the field as their background source, calibrating this number with simulations following their “Synthetic Field Method” (SFM). In Holwerda et al. (2005a), we describe the details of this method 111For the remainder of the paper field galaxies mean the distant background objects we count and foreground galaxy refers to the galaxy disk through which these distant galaxies are seen..
Both the “Occulting Galaxy Method” and the SFM have the benefit of not using the disk’s own light to measure the extinction. The drawbacks of the Keel and White method are the assumption of symmetry of both galaxies and the few suitable pairs available. The SFM is more universally applicable but limited by the poor statistics. It does however not need to assume any distribution of either the disk’s light or the absorbers in it. The SFM does require high-resolution images from HST and remains limited to the arms and disk of spiral galaxies due to crowding.
In this paper we report radial extinction profiles for spiral disks of different Hubble types based on 32 Hubble Space Telescope, Wide Field Planetary Camera 2 (HST/WFPC2) fields in 29 galaxies of Hubble types Sab and later. In section 2 we describe the sample and its selection in detail. The SFM is briefly outlined in section 3; a more complete description of the method and the recent improvements we have made to it is given in the companion paper (Holwerda et al., 2005a). In section 4 we discuss the radial profile of average opacity for individual galaxies and, in section 5, the composite average radial extinction profile for our entire sample. The effects of inclination, spiral arm prominence, and Hubble type on the profiles are discussed as well. Section 6 discusses the average (V-I) color of the field galaxies we found and section 7, the tentative relation between average surface brightness and opacity. We discuss some of the implications of our results, and end with the conclusions on disk opacity from the numbers and colors of field galaxies seen through them.
2 HST Archive Sample
Our sample of HST/WFPC2 fields was selected from the MAST archive at STSCI, based on criteria for both the target galaxy and the HST data. The total exposure times and original proposal ID and reference are listed in Table 1, the basic data on the galaxies in Table 2. The total solid angle of this sample is 146 arcmin2.
The foreground galaxy should be a spiral, ideally face-on, spanning enough sky to cover a significant number of field galaxies. This solid angle constraint limits the maximum distance for application of the SFM to approximately 30 Mpc. HST starts to resolve the disk population of spirals at close distances, making the field too crowded for field galaxy identification (see González et al. (2003)). This imposes a minimum distance of a few Mpc. The galaxies are type Sab and later, plotted in Figure 1, according to the RC3 (de Vaucouleurs et al., 1991). No limit on inclination was imposed as long as spiral arms could be discerned.
The majority of this sample is from the Distance Scale Key project. The project’s observing strategy (Freedman et al., 1994, 2001) was geared towards maximizing the number of Cepheid variables detected. This resulted in the selection of fields in the optical disk of face-on later-type spirals with a prominent arm visible. These selection criteria are to be considered when interpreting the opacity measurements of these fields.
The sample of spiral disks has multi-epoch imaging in 2 photometric band available, as the original science driver for many of these data sets was to sample the Cepheid light curves. The reacquisition resulted in a slight shift in the pointing at each epoch. The unintentional ’dither’ allowed us to drizzle the combined images to a pixel scale of 0.″05. The data reduction is described in detail by Holwerda et al. (2005a). González et al. (2003) predicted that improved resolution would mainly benefit the statistics of distant galaxy counts in the Local Group. However, as the sample spans a range of distances and the statistics are likely to be poor, the maximum possible sampling was selected. The PC chip was not used for analysis because it often lies on the most crowded region, its noise characteristics are different from the WF chips, and there are fewer reference fields available for the SFM.
This sample of HST pointings was selected as it is reasonably uniform, which allows similar processing using Hubble Deep Field (HDF) background fields. The HST/WFPC2 pointing should neither be on the center of the galaxy where crowding is too much of a problem, nor be outside the disk of the target galaxy where the expected opacity is likely too low to be measured with the SFM. We selected pointings with the F814W (I) and F555W (V) filters as the identification of objects is based on several parameters characterising structure and on the V-I color. A minimum exposure time of about 2000 seconds in both filters was adopted. The choice of filters and exposure time was based on our earlier experiences with spiral and irregular galaxies (González et al., 1998; Holwerda et al., 2002). and to maximize the number of suitable fields.
3 SFM: Calibrating the field galaxy numbers.
Holwerda et al. (2005a) describe in detail the data-reduction and the automated SFM, so we will give only a short summary here. To calibrate the numbers of field galaxies found in the science fields, simulated or “synthetic” fields are made. These are the original science fields with an extincted Hubble Deep Field added. The numbers of simulated field galaxies found suffer from the same confusion and crowding as the number from the science field and therefore depend solely on the dimming applied. A series of simulations give us the relation between field galaxy numbers and applied dimming. The following relation is fitted to the simulated numbers:
| (1) |
is the dimming in magnitudes, the number of field galaxies in a simulation, and are the normalization and slope of the fit (i.e. the number of field galaxies expected with no extinction and how this number diminishes with increasing extinction). The slope C characterises the effects of crowding and confusion on the relation between opacity and galaxy numbers. It is usually slightly over unity but the unique character of each field led us to characterise C using the simulations in each field or combination of fields. The intersection between this relation and the real number of field galaxies gives us the average extinction () typical for the solid angle where these field galaxies were found. The field galaxies are identified in the science fields, using automated selection, based on structural parameters and (V-I) color, together with a visual verification. In the synthetic fields, the visual check of objects was substituted by anti-correlating the automatically selected objects with the automatic selection in the science field, removing both the real distant galaxies as well as contaminants and leaving only added objects.
The uncertainty in the number of field galaxies from the science field is a combination of the Poisson uncertainty and the uncertainty due to field galaxy clustering. The uncertainty in the simulated numbers is Poisson only as they come from a known background, the Hubble Deep Fields. The uncertainty in average opacity is derived from the uncertainties in field galaxy numbers based on the Poisson uncertainty as expressed by Gehrels (1986), and the clustering uncertainty based on the 2-p correlation function found by Cabanac et al. (2000) and equation 1. The crowding and confusion bias is calibrated with the simulations. For a detailed error discussion of the SFM see Holwerda et al. (2005a), §4.3.
3.1 Galactic Extinction
A difference in dust extinction from our own Galaxy between the reference fields (HDF-N/S) and the pointing at the foreground galaxy will introduce a bias in the extinction measurement of the specific disk. González et al. (1999) used galaxy counts to measure the extinction towards GRB 970228. and found excellent agreement with other measurements of Galactic extinction (Burstein and Heiles, 1978; Schlegel et al., 1998). Schlegel et al. (1998) produced an all-sky map of Galactic extinction based on COBE and IRAS maps and we use their values for Galactic extinction (Table 2). Most galaxies in the sample do not show a significant difference in Galactic extinction compared to the average of the Galactic extinction towards the HDF-N/S ( = 0.039 mag). However, the numbers of galaxies from each science field were nevertheless corrected for the difference in Galactic extinction using equation 1.
4 Radial opacity measurements in individual WFPC2 fields
González et al. (1998) presented results based on the SFM for individual Wide Field chips, characterised as “arm” or “disk” regions based on predominance in the chip. Holwerda et al. (2005a) segmented the WFPC2 mosaics based on morphological component (arm, inter-arm, disk) or projected radius from the center. However, the statistics from individual WFPC2 fields barely allow any meaningful opacity measurements for solid angles smaller than a single WF field. In Table 3 we present opacity values for the projected radial annuli in each foreground galaxy in our sample. The radii are expressed in , half the from RC3 catalog (de Vaucouleurs et al., 1991). The error-bars are computed from the uncertainties in the numbers of real and simulated field galaxies from counting and clustering (Holwerda et al., 2005a). For the galaxies for which we have two WFPC2 pointings (NGC5194, NGC3621 and NGC4414), the radial extinction from the combined counts is also shown.
5 Average Radial Opacity Plots
Estimates of extinction in a galaxy disk based on a single WFPC2 chip suffer from poor statistics (González et al., 1998; Holwerda et al., 2005a), which make a radial dependence hard to establish (See Table 3 and Holwerda et al. (2005a)). This led us to apply the SFM to a large sample of foreground galaxies in order to estimate the general extinction properties of galaxy disks from the combined numbers of field galaxies seen through these disks. We caution against averaging the values in Table 3 to derive average profiles. Figure 2 shows the radial opacity plot from all our fields combined. The numbers of field galaxies from both the science fields and the simulations from all fields were combined based on their projected radial distance from the respective galaxy’s centers,222The values used to deproject the distances on the sky to radial distance to the galaxy’s center are presented in Table 2. expressed in . The top panel in Figure 2 shows the total combined solid angle for each radial bin for which the average opacity was determined. The middle panel shows the number of field galaxies from the science field and the average number found in the simulations without any dimming (A=0). The bottom panel shows the opacity for each bin derived from the intersection of equation 1 fitted to the simulations and the real number of galaxies.
The solid angle or the number of simulated galaxies without any dimming is a good indicator for the reliability of our opacity estimate, as reflected by the error bars in the bottom panel of Figure 2. The estimates are limited at small radii by the high surface brightness and crowding of the foreground galaxy center, effectively masking some of the solid angle available at those radii. At higher radii the uncertainty comes from a lack of solid angle covered (See Figure 2, top panel). This is a selection effect of our sample, as most of the WFPC2 fields were pointed at the optical disk of the galaxy.
In order to determine the effects on average radial opacity of disk inclination, prominence of spiral arms or Hubble type, radial opacity plots of subsets of our sample were constructed. The solid angle used is then some fraction of those in the top panel in Figure 2, which consequently increases the uncertainty in the opacity measurement. To counter this, instead of the radial bins of 0.1 (Figure 2), radial binning of 0.2 was applied.
5.1 Inclination effects
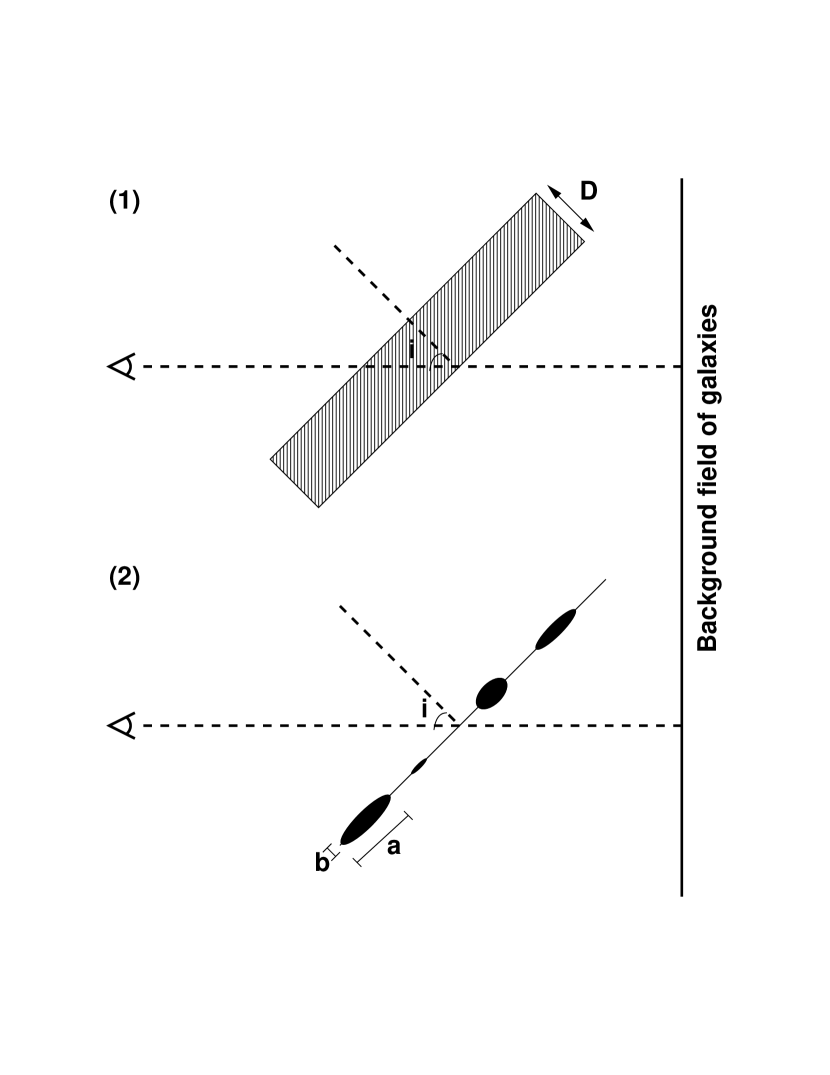
The inclination of the foreground disks affects the measured opacity, but the amount of this effect depends on the dust geometry. In the case of a uniform thick screen, the path length attenuating the field galaxies is increased. However in the case of a screen of dark clouds in the disk, the effect is on the apparent filling factor of clouds. Because the correction depends on which dust geometry is assumed, we present the radial results (Figure 2) without any correction and explore corrections using several different models, illustrated in Figure 3. The homogeneous screen results in a multiplicative factor cos(i) to be applied to the opacity value (A) or in a correction to the number of field galaxies found in the science field, as follows:
| (2) |
The other models consider a screen with fully opaque clouds or patches. Depending on the thickness of these clouds, the apparent filling factor depends differently on inclination. In these models, the clouds have an average oblateness () with major axis a and minor axis b of the clouds. Following the geometry of Figure 3, the relation between the number of field galaxies, seen through the foreground disk face-on (), at an inclination i (), and the average number of field galaxies in the field behind the foreground galaxy () can then be expressed as:
| (3) |
where the extreme cases for are spherical clouds () and flat patches (). The oblateness parameterises the ratio between the scale height of the dust and its extent in the plane of the disk. In images of edge-on disks, the visible dust lanes are confined to a thinner disk than the stars. It is therefore likely that is not 0. For purposes of illustration we use a value of 0.5 in Figure 8.
Figure 4 shows the radial profile from Figure 2 corrected for both extreme cases and uniform screens in all galaxies. The contributions from each galaxy to the composite radial profile were corrected according to equation 2 and equation 3 before addition. Figure 5 shows the total uncorrected radial profile for four subdivisions of our sample based on inclination. From Figure 5 it seems clear that other effects are much more important than the inclination of the foreground disk. For this reason we ignoring the effects of inclination on our measurements. As the effects of inclination are debatable on the basis of preferred dust geometry, we present further results without inclination corrections except where noted.
5.2 The effect of spiral arms
Another effect on the average radial opacity profile in Figure 2 is due to the presence of spiral arms. As our sample is predominantly from the Cepheid Distance Project, the WFPC2 images all feature spiral arms. If these are more opaque than the disk proper (Beckman et al., 1996; White et al., 2000), then the radial profile presented in Figure 2 could be biased towards higher opacities. Separate radial plots for the arm, the inter-arm part of the disk and outside any spiral arm part of the disk are shown in Figure 7 based on the counts from the typical regions in the entire sample, with the exception of the LSB galaxies UGC 2302 and UGC 6614. They were left out, as not much spiral structure can be discerned; they appear completely transparent (See Figure 8).
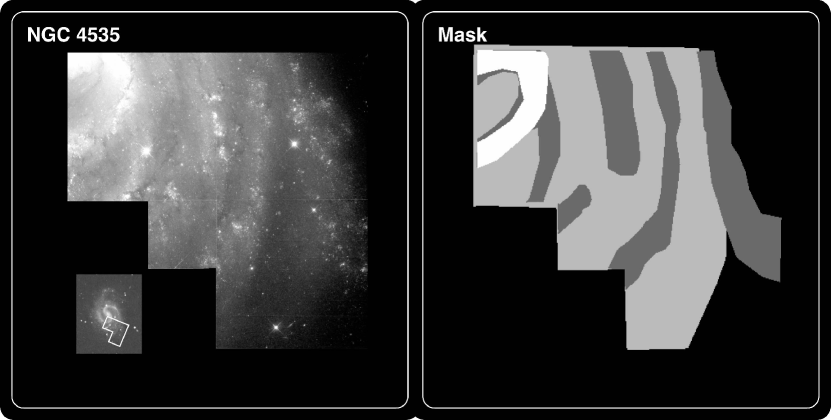
5.2.1 Segmenting images
In order to differentiate between the effects of spiral arms and disks in the opacity plots, the images were segmented into crowded, arm, disk (inter-arm) and disk (outside arm). These regions were flagged in the mosaiced WFPC2 fields using the GIPSY (Groningen Image Processing System) function blot, in the same way as NGC1365 in Holwerda et al. (2005a). The choice of typical regions was made in order to compare the arm and inter-arm results of White et al. (2000) and Domingue et al. (2000). A typical mask is presented in Figure 6 and masks for all galaxies in the sample are presented in Holwerda (2005). It should be noted that this segmentation into typical regions is subjective, and based on those sections of the foreground galaxies covered by the WFPC2 observations we use.
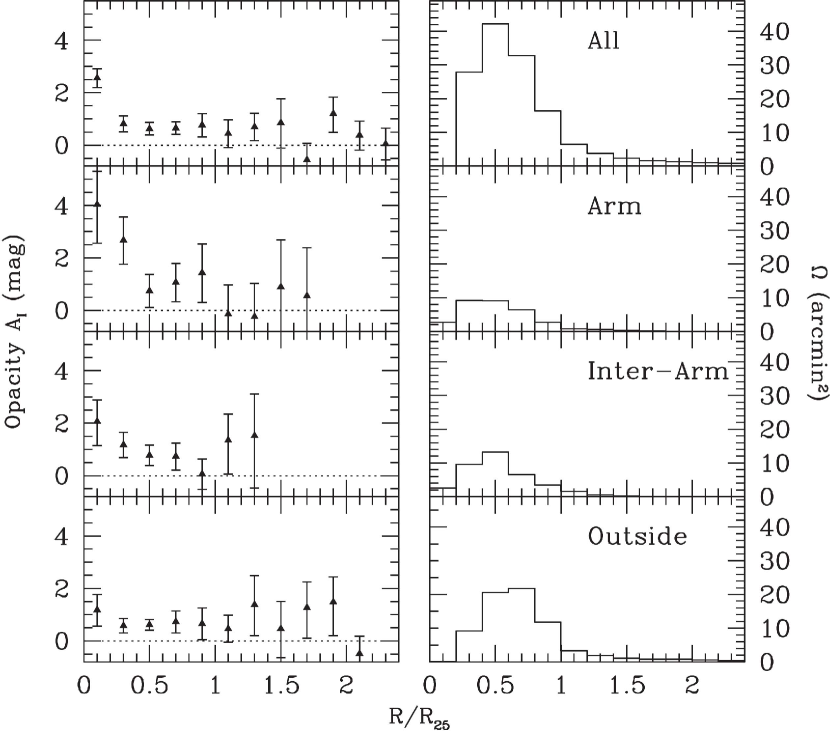
5.2.2 Radial extinction for typical disk regions
Radial extinction profiles of the typical regions are presented in Figure 7. The arm regions show much more opacity and a much more pronounced radial dependence of that opacity. There is a radial dependence as well for the inter-arm parts of the disk, although not as steep. The outside parts of the disk of the spiral galaxy, however, show little or no relation between opacity and radius. The opaque components of a spiral disk appear to be the spiral arms while the disk itself is more transparent but much more extended. Figure 7 also shows the total solid angle of the radial annuli over which the opacities are determined. From these we can conclude that the regions deemed ‘arm’ are not dominating the whole of the fields. The radial effect of the arms only becomes visible in the total radial opacity plot (Figure 2 and top left panel Figure 7), at the lower radii where the arms and the inter-arm region dominate. In Figure 8 we present the profiles corrected for inclination assuming an of 0.5. The general trends remain but now for somewhat lower opacity values.
5.2.3 Comparing to the “Occulting Galaxy Method”
White et al. (2000) and Domingue et al. (2000) presented their extinction values from occulting galaxy pairs as a function of the radius, scaled with . White et al. (2000) compared ground-based photometry, and Domingue et al. (2000) used spectroscopic measurements of the occulted galaxy light. These extinction points are plotted in figure 9 for arm and inter-arm regions. The extinction curves from Figure 7 and the inclination corrected one from Figure 8 are plotted as well. Both the arm and the inter-arm extinction values as a function of radius agree well with the values obtained from the occulting galaxy technique. It is remarkable how well the results compare, considering they were obtained from completely different samples of spiral galaxies and using different techniques. The values from the occulting galaxy technique are slightly lower than ours. There are several possible reasons for this. The spectroscopic results from Domingue et al. (2000) (triangles in Figure 9) possibly favour the more transparent regions in a disk (Domingue 2004, private communication). But more importantly, the sample of occulting foreground galaxies consists of a different makeup of spiral galaxy subtypes than that of this paper. It should be noted that there are no galaxies common to both our sample and that of the occulting galaxy technique. single galaxy in both our sample and the occulting galaxy method’s. Domingue et al. (2000) noted that their later types (Sbc) seem more opaque, as do we (Figure 11). Figure 10 compares the results for the most prevalent Hubble subtypes in the occulting galaxy method (Sb and Sbc) with our results for those. The arm values seem to match up but there is a difference in the inter-arm results. It is unclear to us whether this points to a structural effect in either technique. A likely explanation is that the definition of “inter-arm” applies to slightly different regions in the spiral disks for White et al. (2000); Domingue et al. (2000), and his paper. This paper’s definition of typical regions is based on the high-resolution mosaic, whereas the White et al. (2000) is on their ground-based imaging. There is therefore the possibility that we include sections in the interarm regions which the occulting techniques would not resolve as “inter-arm”, raising our values of opacity for those regions with respect to the occulting galaxy technique.
The SFM provides an independent verification of the occulting galaxy technique using a fundamentally different approach. In addition, a component was added to the distinction between arm and inter-arm parts of the disk, the “outside”, meaning not directly enclosed by spiral arms. The fact that this component is not fully transparent raises the possibility of a dust disk extending beyond the spiral arms (Figure 8).
5.3 Hubble Type
With the effect of spiral arms on the opacity profile, the Hubble type is likely to be of influence on the profile. Figure 10 shows the extinction profiles averaged per Hubble type. Hubble types Sab through Sd are presented, as well as the average opacity profile of the two LSB galaxies in our sample. Hubble types Sab through Scd in our sample show disk extinction up to the . The Sab result is tentative, owing to the poor statistics from only 2 WFPC2 fields. The Sd and LSB galaxies however appear effectively transparent. LSB galaxies were in fact assumed to be transparent by O’Neil et al. (2000) when discussing the morphology of field galaxies seen though them. However both profiles, Sd and LSB, are based on only two WFPC2 fields, accounting for the higher uncertainties. Comparing early type galaxies with later types, it appears that the later type galaxies (Sbc-Sc) show more extinction and at larger radii. The Sb galaxies show a bump which appears to be associated with higher extinction from the more tightly wound spiral arms.
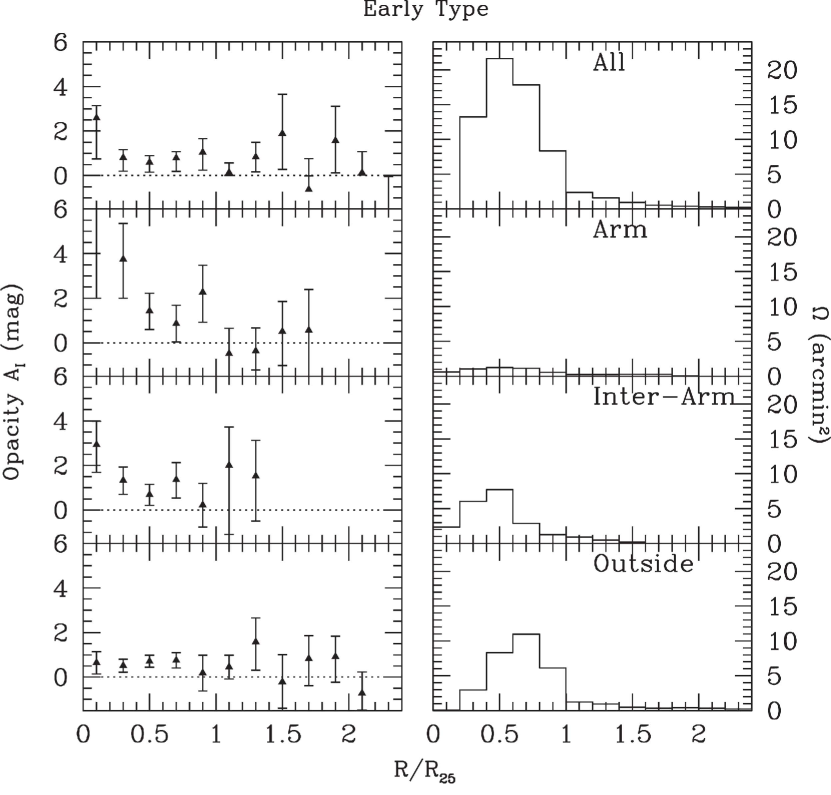
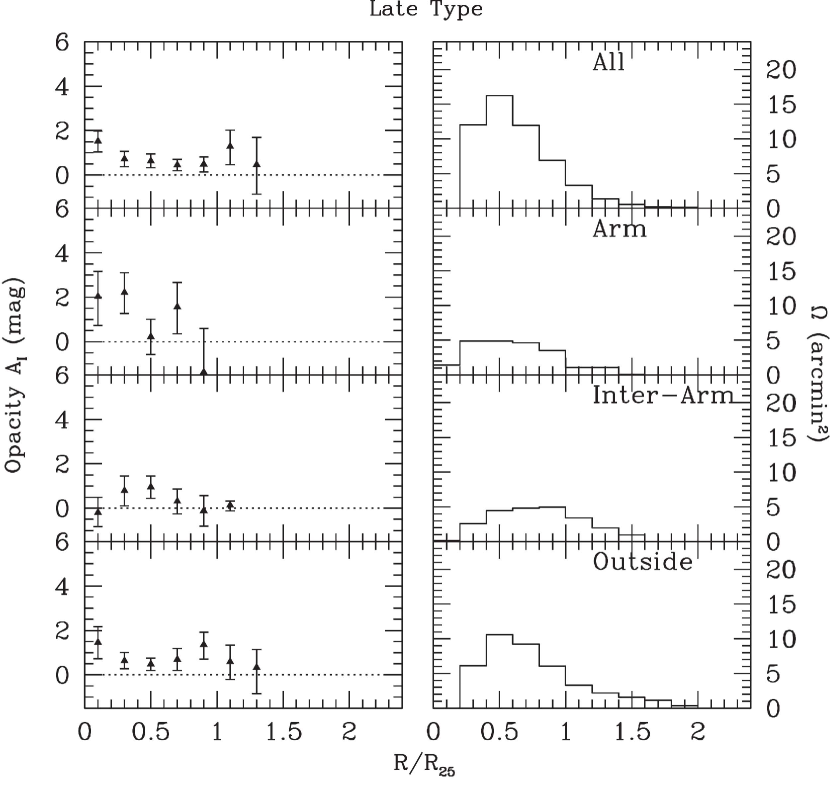
Figures 12 and 13 show the radial profiles for arm and disk -both inter-arm and outside regions- for our sample divided into early and late spirals. A finer separation in Hubble type would have resulted in even higher uncertainties, due to lack of solid angle and hence statistics. The solid angle of each radial annulus is also plotted. Purely arm regions do not dominate the opacity profiles. However, the interarm regions are similar in behaviour (Figures 7 and 8). The inner parts of the profile are therefore more arm-like, while the remainder is disk dominated.
The radial dependence of arm and inter-arm regions is more pronounced in the case of earlier galaxies than for later types. The opacity in the spiral arms is substantially higher then in the disk, for both early and late types. The total profiles show bumps at 0.9 and 1.1 for the early and late types, respectively. In the case of the early types this seems due to the spiral arm contribution at that radius. The bump for the late types is not as significant, but might be related to the general position of spiral arms as well.
6 Average color of the field galaxies
The average color of the field galaxies found in the science fields can, in principle, tell us something about the actual dust geometry responsible for the drop in numbers. If there is a correlation between the average reddening of the field galaxies and the average opacity of the foreground spiral, then the dust extinction responsible for the drop in number of field galaxies is, at least in part, in the form of a diffuse screen, reddening the visible galaxies. If, however, the average color of the field galaxies does not change with opacity, then the drop in their number is likely due to fully opaque clouds with transparent sections between them to allow for the detection of the unreddened surviving field galaxies.
Our method influences the average color of the detected field galaxies in several ways. The V band (F555W) for the synthetic field background was constructed from the original HDF images in the F606W and F450W filters. However, González et al. (1998) estimated that this introduces a negligible error. Crowding introduces blended objects in the synthetic fields. The synthetic counts are corrected for this effect but it will influence the average color. The simulated dust extinction we used was grey, so no preferred reddening was introduced in the synthetic fields. However, our automated selection procedure for field galaxy candidates selects against very blue objects, introducing a preference for red galaxies. A similar selection effect may take place in the visual check of the science fields, as blue objects are treated as suspected foreground objects. Overall, these selection biases will cause the average color of the field galaxies in the science and synthetic fields to be redder than the average for an unobstructed field of distant galaxies. The effects of blended objects on the average colors of science and synthetic fields are not identical, as not all blends have been removed from the synthetic counts. Nonetheless, we can compare the trends of both these average colors with radius.
The average (V-I) color of the field galaxies found in the science fields, the simulation without extinction (A = 0), and the opacity derived from the galaxy numbers are plotted as a function of radius in Figure 14. The average (V-I) color of the field galaxies in the science fields does not change with radius and hence average opacity. The average color of the synthetic field objects appears to become bluer with radius. However, beyond 1.4 the number of objects is very small and the averages should be treated with caution. Comparing the average color of distant galaxies from science and synthetic fields for the inner part of the disk, the average of the science field objects is redder than the synthetic field average. This difference in average color is likely the result of blends with blue foreground objects being inadvertently included in the the selection of synthetic field objects. The number of objects from the synthetic fields was corrected for this effect (see also Holwerda04a but the average color was not. The science field objects do not suffer from this as they were checked visually for blended objects. The field galaxies seen in the science fields are likely visible in parts of the disk which are nearly transparent or, alternatively, the dust screen in the disk behaves according to the “grey” extinction law. This is remarkable, considering the bias towards redder objects throughout our method.
Figure 15 shows the average color-extinction measurements for the field galaxies in the science fields. The Galactic extinction law is shown for comparison. Each point has been determined in a radial annulus, for all the fields combined (Figure 2) and for the typical regions (Figure 7, but with the finer radial sampling of Figure 2.). Without distinction between regions, no trend with opacity can be discerned for the average color.
The average color in the arm regions does not seem to rise much with opacity. The arm extinction is decidedly grey, something also found by González et al. (1998). For the disk regions, no distinct trend can be seen, and they do not seem to follow the Galactic law very well. González et al. (1998) found the disk region of NGC4536 to be more Galactic in its reddening law. There is an average reddening with respect to the average (V-I) color of the HDF objects identified as galaxies by our algorithm without a foreground disk. This reddening is likely to be the result of the effects of the visual check and contamination of the color measurement by stray disk light.
These color-extinction relations for both arms and disk seem to be greyer than the Galactic extinction slope, favouring the possibility that at least part of the extinction is in opaque clouds. Uncertainties are such, however, that even for our increased statistics no good relation between opacity and color can be found.
7 Surface brightness and opacity
The counts of distant galaxies were added per radial annulus, expressed in . Additionally, the flux and solid angle from each field can be added for each radial annulus. The averaged surface brightness () and the average opacity (A) from each radial bin in Figure 2, are plotted in Figure 16. These values for the radial bins per typical region in Figure 7 are plotted as well, but with finer sampling. There is a hint of a relationship between luminosity and extinction. This is consistent with the relation found by Giovanelli et al. (1995) and Masters et al. (2003) between overall disk opacity and the galaxy’s total luminosity. The solid angles over which the surface brightness and opacity were averaged were selected by radius and not luminosity. Areas with different surface brightnesses are therefore combined at each radius, smoothing out any relation between opacity and surface brightness. Hence, most of the points in Figure 15 are around the same opacity and the range of surface brightness values is small. Nevertheless, the values of high extinction and brightness () do show some relationship between surface brightness and opacity, with arm regions displaying more extinction at the same surface brightness levels than the inter-arm disk. The disk values appear to show no correlation, but these values are per definition not for high surface brightness levels. And yet, together with the higher values of opacity found for the spiral arms, the points are not inconsistent with a relation between the opacity and luminosity. Opacity measurements in partitions of the WFPC2 images based on average surface brightness instead of radius should reveal any relation more clearly. This comparison between extinction and emission will be presented, in more detail, in a later paper.
8 Discussion
From the number of field galaxies found through the disks of spiral galaxies, a quantative picture of extinction as a function of radius can be found. The SFM is too limited by statistics to obtain a good result for individual fields. However a meaningful measurement can be derived from a combination of several galaxies. The effect of spiral arms on the radial extinction is quite distinct and dependent on Hubble type. From these radial plots it becomes clear that the dust in the disk is not one smooth layer sandwiched between the disk’s stars but two separate components: radially dependent spiral arms and a more transparent but also extended disk. In addition, there is a highly opaque central bulge component.
Whether the average opacity is a result of dust clouds or a smooth screen of grey dust, is difficult to determine from the numbers, colors and luminosities of the field galaxies found through the disks of our sample. However, the relative independence on inclination of the average opacity measured from numbers of spiral galaxies and the grey relation between opacity and average field galaxy color, both point towards a patchy distribution of the absorbing dust in the disk.
Assuming that the optical depth of the disk can be expressed as , where f is the area filling factor, the average opacity of would require a filling factor of 40% of the disk, a figure that rises to 85 % in the spiral arms. While the visible dust lanes can account for at least a part of these clouds, other dust clouds are likely embedded in the disks and arms. This patchy coverage explains the occasional distant galaxy seen through a spiral disk (Roennback and Shaver, 1997; Jablonka et al., 1998), which has sometimes been used as anecdotal evidence for transparent disks. The disk is in fact relatively transparent where background galaxies are seen. However, by calibrating the number of the distant galaxies found, a very different picture emerges.
While this result is consistent with earlier findings, these values are likely upper limits, not lower ones. Any inclination correction will lower the face-on value for extinction. However, the patchy nature of dust extinction is likely responsible for a high variety of extinction values in the disk. Integrated measurements such as light profiles, however, will be affected according to the presented opacity values. A possible relation between extinction and brightness would also cast doubt on the fixed mass-to-light ratios generally assumed when modelling the kinematics of a spiral disk.
9 Conclusions
The effects of dust extinction on the number of field galaxies found in our fields lead us to the
following conclusions:
(1) The SFM gives an unbiased but uncertain measure of opacity for single WFPC2 fields (Table 3).
(2) On average, the disk of a spiral galaxy has an opacity in of 1 magnitude (Figure 2).
(3) The extinction measured from the number of field galaxies seems to be independent of
the inclination of the foreground disk over the range in covered by our sample
() (Figure 5). This is consistent with fully opaque flattened clouds
covering a fraction of the area as the cause of the observed average opacity.
(4) The absorption profile for typical regions in the disk is strongly influenced by the spiral
arms. Spiral arm regions are the most opaque and display a radial dependence. The disk
regions enclosed by a spiral arm are also more opaque than other disk regions and display
a similar radial dependence (Figure 7).
(5) The radial extinction curves derived from numbers of background galaxies and those
reported by the occulting galaxy technique agree reasonably well (Figure 9 and 10), although
a systematic effect in either (or both) technique seems to be present in the interarm results (Figure 10).
(6) Sc galaxies show much more opacity in their central regions than other types (Figure 11).
(7) All Hubble types earlier than Scd in our sample show substantial disk extinction in up
to (Figure 11).
(8) The numbers from Sd and LSB galaxies are consistent with a transparent disk, but these
measurements are limited by statistics. (Figure 11).
(9) Both early and late type spirals exhibit the extinction profiles of the two distinct components:
a radially dependent one (arm and inter-arm), and a more extended disk (outside arms) (Figures 12 and 13).
(10) The average color of the distant galaxies identified in the science fields does not change
with either radius or the opacity derived from their numbers (Figure 14).
(11) The grey nature of the absorption derived from field galaxy counts and colors holds for all
typical regions (Figure 15). The absence of inclination effects and the grey nature of the absorption
is consistent with strongly absorbing dense clouds masking off the distant galaxies. Their covering
factor in the disk would be around 40%, regardless of cloud sizes (which our technique cannot provide).
(12) The average surface brightness in radial annuli and the corresponding average opacity
derived from distant galaxy counts appear correlated. They are consistent with a rise of opacity
with surface brightness. (Figure 16). Although the range of surface brightness is small and the
uncertainty in opacity rises with higher surface brightness, this is in good agreement with earlier
results for bright galaxies. This would constitute a relation between dust mass and light.
The “Synthetic Field Method” has proven itself to be a useful, model-independent, technique to measure the total opacity of spiral disks. It can be applied to any spiral disk at intermediate distance for which there is high resolution imaging available. We will present further results for opacity as a function of surface brightness in a future paper.
References
- Alton et al. (2001) Alton, P. B., Bianchi, S., and Davies, J.: 2001, Ap&SS 276, 949
- Beckman et al. (1996) Beckman, J. E., Peletier, R. F., Knapen, J. H., Corradi, R. L. M., and Gentet, L. J.: 1996, ApJ 467, 175
- Bovill et al. (2003) Bovill, M. S., Pritzl, B. J., and Knezek, P. M.: 2003, BAAS 203,
- Burstein and Heiles (1978) Burstein, D. and Heiles, C.: 1978, ApJ 225, 40
- Cabanac et al. (2000) Cabanac, R. A., de Lapparent, V., and Hickson, P.: 2000, A&A 364, 349
- Calzetti (2001) Calzetti, D.: 2001, PASP 113, 1449
- Cropper et al. (2004) Cropper, M., Soria, R., Mushotzky, R. F., Wu, K., Markwardt, C. B., and Pakull, M.: 2004, MNRAS 349, 39
- Cuillandre et al. (2001) Cuillandre, J., Lequeux, J., Allen, R. J., Mellier, Y., and Bertin, E.: 2001, ApJ 554, 190
- Dale and Helou (2002) Dale, D. A. and Helou, G.: 2002, ApJ 576, 159
- Davies and Burstein (1995) Davies, J. I. and Burstein, D. (eds.): 1995, The opacity of spiral disks(Dordrecht: Kluwer Academic Publishers)
- de Jong (1996) de Jong, R. S.: 1996, A&A 313, 377
- de Vaucouleurs et al. (1991) de Vaucouleurs, G., de Vaucouleurs, A., Corwin, H. G., Buta, R. J., Paturel, G., and Fouque, P.: 1991, Third Reference Catalogue of Bright Galaxies, Volume 1-3, XII, 2069 pp. 7 figs.. Springer-Verlag Berlin Heidelberg New York
- Disney et al. (1989) Disney, M., Davies, J., and Phillipps, S.: 1989, MNRAS 239, 939
- Domingue et al. (1999) Domingue, D. L., Keel, W. C., Ryder, S. D., and White, R. E.: 1999, AJ 118, 1542
- Domingue et al. (2000) Domingue, D. L., Keel, W. C., and White, R. E.: 2000, ApJ 545, 171
- Ferrarese et al. (1998) Ferrarese, L., Bresolin, F., Kennicutt, R. C., Saha, A., Stetson, P. B., Freedman, W. L., Mould, J. R., Madore, B. F., Sakai, S., Ford, H. C., Gibson, B. K., Graham, J. A., Han, M., Hoessel, J. G., Huchra, J., Hughes, S. M., Illingworth, G. D., Phelps, R., Prosser, C. F., and Silbermann, N. A.: 1998, ApJ 507, 655
- Ferrarese et al. (1996) Ferrarese, L., Freedman, W. L., Hill, R. J., Saha, A., Madore, B. F., Kennicutt, R. C., Stetson, P. B., Ford, H. C., Graham, J. A., Hoessel, J. G., Han, M., Huchra, J., Hughes, S. M., Illingworth, G. D., Kelson, D., Mould, J. R., Phelps, R., Silbermann, N. A., Sakai, S., Turner, A., Harding, P., and Bresolin, F.: 1996, ApJ 464, 568
- Freedman et al. (1994) Freedman, W. L., Hughes, S. M., Madore, B. F., Mould, J. R., Lee, M. G., Stetson, P., Kennicutt, R. C., Turner, A., Ferrarese, L., Ford, H., Graham, J. A., Hill, R., Hoessel, J. G., Huchra, J., and Illingworth, G. D.: 1994, ApJ 427, 628
- Freedman et al. (2001) Freedman, W. L., Madore, B. F., Gibson, B. K., Ferrarese, L., Kelson, D. D., Sakai, S., Mould, J. R., Kennicutt, R. C., Ford, H. C., Graham, J. A., Huchra, J. P., Hughes, S. M. G., Illingworth, G. D., Macri, L. M., and Stetson, P. B.: 2001, ApJ 553, 47
- Gehrels (1986) Gehrels, N.: 1986, ApJ 303, 336
- Gibson et al. (1999) Gibson, B. K., Hughes, S. M. G., Stetson, P. B., Freedman, W. L., Kennicutt, R. C., Mould, J. R., Bresolin, F., Ferrarese, L., Ford, H. C., Graham, J. A., Han, M., Harding, P., Hoessel, J. G., Huchra, J. P., Illingworth, G. D., Kelson, D. D., Macri, L. M., Madore, B. F., Phelps, R. L., Prosser, C. F., Saha, A., Sakai, S., Sebo, K. M., Silbermann, N. A., and Turner, A. M.: 1999, ApJ 512, 48
- Giovanelli et al. (1994) Giovanelli, R., Haynes, M. P., Salzer, J. J., Costa, L. N., and Freudling, W.: 1994, AJ 107, 2036
- Giovanelli et al. (1995) Giovanelli, R., Haynes, M. P., Salzer, J. J., d da Costa, L. N., and Freudling, W.: 1995, AJ 110, 1059
- González et al. (1998) González, R. A., Allen, R. J., Dirsch, B., Ferguson, H. C., Calzetti, D., and Panagia, N.: 1998, ApJ 506, 152
- González et al. (1999) González, R. A., Fruchter, A. S., and Dirsch, B.: 1999, ApJ 515, 69
- González et al. (2003) González, R. A., Loinard, L., Allen, R. J., and Muller, S.: 2003, AJ 125, 1182
- Graham (2001) Graham, A. W.: 2001, MNRAS 326, 543
- Graham et al. (1999) Graham, J. A., Ferrarese, L., Freedman, W. L., Kennicutt, R. C., Mould, J. R., Saha, A., Stetson, P. B., Madore, B. F., Bresolin, F., Ford, H. C., Gibson, B. K., Han, M., Hoessel, J. G., Huchra, J., Hughes, S. M., Illingworth, G. D., Kelson, D. D., Macri, L., Phelps, R., Sakai, S., Silbermann, N. A., and Turner, A.: 1999, ApJ 516, 626
- Graham et al. (1997) Graham, J. A., Phelps, R. L., Freedman, W. L., Saha, A., Ferrarese, L., Stetson, P. B., Madore, B. F., Silbermann, N. A., Sakai, S., Kennicutt, R. C., Harding, P., Bresolin, F., Turner, A., Mould, J. R., Rawson, D. M., Ford, H. C., Hoessel, J. G., Han, M., Huchra, J. P., Macri, L. M., Hughes, S. M., Illingworth, G. D., and Kelson, D. D.: 1997, ApJ 477, 535
- Helou et al. (2000) Helou, G., Lu, N. Y., Werner, M. W., Malhotra, S., and Silbermann, N.: 2000, ApJ 532, L21
- Holmberg (1958) Holmberg, E.: 1958, Meddelanden fran Lunds Astronomiska Observatorium Serie II 136, 1
- Holwerda (2005) Holwerda, B. W.: 2005, Ph.D. Thesis: The Opacity of Spiral Disks(Kapteyn Institute, University of Groningen)
- Holwerda et al. (2002) Holwerda, B. W., Allen, R. J., and van der Kruit, P. C.: 2002, in ASP Conf. Ser. 273: The Dynamics, Structure & History of Galaxies: A Workshop in Honour of Professor Ken Freeman ed. G.S. Da Costa & H. Jerjen. San Francisco, Astronomical Society of the Pacific, pp 337–+
- Holwerda et al. (2005a) Holwerda, B. W., Gonzalez, R. A., Allen, R. J., and van der Kruit, P. C.: 2005a, AJaccepted.
- Hughes et al. (1998) Hughes, S. M. G., Han, M., Hoessel, J., Freedman, W. L., Kennicutt, R. C., Mould, J. R., Saha, A., Stetson, P. B., Madore, B. F., Silbermann, N. A., Harding, P., Ferrarese, L., Ford, H., Gibson, B. K., Graham, J. A., Hill, R., Huchra, J., Illingworth, G. D., Phelps, R., and Sakai, S.: 1998, ApJ 501, 32
- Jablonka et al. (1998) Jablonka, P., Bica, E., Bonatto, C., Bridges, T. J., Langlois, M., and Carter, D.: 1998, A&A 335, 867
- Keel and White (2001a) Keel, W. C. and White, R. E.: 2001a, AJ 121, 1442
- Keel and White (2001b) Keel, W. C. and White, R. E.: 2001b, AJ 122, 1369
- Kelson et al. (1999) Kelson, D. D., Illingworth, G. D., Saha, A., Graham, J. A., Stetson, P. B., Freedman, W. L., Kennicutt, R. C., Mould, J. R., Ferrarese, L., Huchra, J. P., Madore, B. F., Prosser, C. F., Bresolin, F., Ford, H. C., Gibson, B. K., Hoessel, J. G., Hughes, S. M. G., Macri, L. M., Sakai, S., and Silbermann, N. A.: 1999, ApJ 514, 614
- Kim and McGaugh (2002) Kim, J. H. and McGaugh, S. S.: 2002, BAAS 34, 1115
- Larsen (2004) Larsen, S. S.: 2004, A&A 416, 537
- Leonard et al. (2002a) Leonard, D. C., Filippenko, A. V., Gates, E. L., Li, W., Eastman, R. G., Barth, A. J., Bus, S. J., Chornock, R., Coil, A. L., Frink, S., Grady, C. A., Harris, A. W., Malkan, M. A., Matheson, T., Quirrenbach, A., and Treffers, R. R.: 2002a, PASP 114, 35
- Leonard et al. (2002b) Leonard, D. C., Kanbur, S. M., Ngeow, C. C., and Tanvir, N. R.: 2002b, in BAAS 201, #23.03, Vol. 201, pp 0–+
- Liu et al. (2002) Liu, J., Bregman, J. N., and Seitzer, P.: 2002, ApJ 580, L31
- Macri et al. (1999a) Macri, L. M., Huchra, J. P., Stetson, P. B., Silbermann, N. A., Freedman, W. L., Kennicutt, R. C., Mould, J. R., Madore, B. F., Bresolin, F., Ferrarese, L., Ford, H. C., Graham, J. A., Gibson, B. K., Han, M., Harding, P., Hill, R. J., Hoessel, J. G., Hughes, S. M. G., Kelson, D. D., Illingworth, G. D., Phelps, R. L., Prosser, C. F., Rawson, D. M., Saha, A., Sakai, S., and Turner, A.: 1999a, ApJ 521, 155
- Macri et al. (1999b) Macri, L. M., Huchra, J. P., Stetson, P. B., Silbermann, N. A., Freedman, W. L., Kennicutt, R. C., Mould, J. R., Madore, B. F., Bresolin, F., Ferrarese, L., Ford, H. C., Graham, J. A., Gibson, B. K., Han, M., Harding, P., Hill, R. J., Hoessel, J. G., Hughes, S. M. G., Kelson, D. D., Illingworth, G. D., Phelps, R. L., Prosser, C. F., Rawson, D. M., Saha, A., Sakai, S., and Turner, A.: 1999b, ApJ 521, 155
- Macri et al. (2001) Macri, L. M., Stetson, P. B., Bothun, G. D., Freedman, W. L., Garnavich, P. M., Jha, S., Madore, B. F., and Richmond, M. W.: 2001, ApJ 559, 243
- Masters et al. (2003) Masters, K. L., Giovanelli, R., and Haynes, M. P.: 2003, AJ 126, 158
- Mayya and Rengarajan (1997) Mayya, Y. D. and Rengarajan, T. N.: 1997, AJ 114, 946
- Mould et al. (2000) Mould, J. R., Hughes, S. M. G., Stetson, P. B., Gibson, B. K., Huchra, J. P., Freedman, W. L., Kennicutt, R. C., Bresolin, F., Ferrarese, L., Ford, H. C., Graham, J. A., Han, M., Hoessel, J. G., Illingworth, G. D., Kelson, D. D., Macri, L. M., Madore, B. F., Phelps, R. L., Prosser, C. F., Rawson, D., Saha, A., Sakai, S., Sebo, K. M., Silbermann, N. A., and Turner, A. M.: 2000, ApJ 528, 655
- Newman et al. (1999) Newman, J. A., Zepf, S. E., Davis, M., Freedman, W. L., Madore, B. F., Stetson, P. B., Silbermann, N., and Phelps, R.: 1999, ApJ 523, 506
- O’Neil et al. (2000) O’Neil, K., Bothun, G. D., and Impey, C. D.: 2000, ApJS 128, 99
- Ostriker and Heisler (1984) Ostriker, J. P. and Heisler, J.: 1984, ApJ 278, 1
- Peletier and Willner (1992) Peletier, R. F. and Willner, S. P.: 1992, AJ 103, 1761
- Pierce et al. (1994) Pierce, M. J., Welch, D. L., McClure, R. D., van den Bergh, S., Racine, R., and Stetson, P. B.: 1994, Nature 371, 385
- Rawson et al. (1997) Rawson, D. M., Macri, L. M., Mould, J. R., Huchra, J. P., Freedman, W. L., Kennicutt, R. C., Ferrarese, L., Ford, H. C., Graham, J. A., Harding, P., Han, M., Hill, R. J., Hoessel, J. G., Hughes, S. M. G., Illingworth, G. D., Madore, B. F., Phelps, R. L., Saha, A., Sakai, S., Silbermann, N. A., and Stetson, P. B.: 1997, ApJ 490, 517
- Roennback and Shaver (1997) Roennback, J. and Shaver, P. A.: 1997, A&A 322, 38
- Saha et al. (1996a) Saha, A., Sandage, A., Labhardt, L., Tammann, G. A., Macchetto, F. D., and Panagia, N.: 1996a, ApJ 466, 55
- Saha et al. (1996b) Saha, A., Sandage, A., Labhardt, L., Tammann, G. A., Macchetto, F. D., and Panagia, N.: 1996b, ApJS 107, 693
- Saha et al. (1999) Saha, A., Sandage, A., Tammann, G. A., Labhardt, L., Macchetto, F. D., and Panagia, N.: 1999, ApJ 522, 802
- Saha et al. (2001) Saha, A., Sandage, A., Thim, F., Labhardt, L., Tammann, G. A., Christensen, J., Panagia, N., and Macchetto, F. D.: 2001, ApJ 551, 973
- Sakai et al. (1999) Sakai, S., Ferrarese, L., Kennicutt, R. C., Graham, J. A., Silbermann, N. A., Mould, J. R., Freedman, W. L., Bresolin, F., Ford, H. C., Gibson, B. K., Han, M., Harding, P., Hoessel, J. G., Huchra, J. P., Hughes, S. M., Illingworth, G. D., Kelson, D., Macri, L., Madore, B. F., Phelps, R. L., Saha, A., Sebo, K. M., Stetson, P. B., and Turner, A.: 1999, ApJ 523, 540
- Sakai et al. (2004) Sakai, S., Ferrarese, L., Kennicutt, R. C., and Saha, A.: 2004, ApJ 608, 42
- Sandage et al. (1996) Sandage, A., Saha, A., Tammann, G. A., Labhardt, L., Panagia, N., and Macchetto, F. D.: 1996, ApJ 460, L15+
- Schlegel et al. (1998) Schlegel, D. J., Finkbeiner, D. P., and Davis, M.: 1998, ApJ 500, 525
- Silbermann et al. (1999) Silbermann, N. A., Harding, P., Ferrarese, L., Stetson, P. B., Madore, B. F., Kennicutt, R. C., Freedman, W. L., Mould, J. R., Bresolin, F., Ford, H., Gibson, B. K., Graham, J. A., Han, M., Hoessel, J. G., Hill, R. J., Huchra, J., Hughes, S. M. G., Illingworth, G. D., Kelson, D., Macri, L., Phelps, R., Rawson, D., Sakai, S., and Turner, A.: 1999, ApJ 515, 1
- Silbermann et al. (1996) Silbermann, N. A., Harding, P., Madore, B. F., Kennicutt, R. C., Saha, A., Stetson, P. B., Freedman, W. L., Mould, J. R., Graham, J. A., Hill, R. J., Turner, A., Bresolin, F., Ferrarese, L., Ford, H., Hoessel, J. G., Han, M., Huchra, J., Hughes, S. M. G., Illingworth, G. D., Phelps, R., and Sakai, S.: 1996, ApJ 470, 1
- Tully et al. (1998) Tully, R. B., Pierce, M. J., Huang, J., Saunders, W., Verheijen, M. A. W., and Witchalls, P. L.: 1998, AJ 115, 2264
- Turner et al. (1998) Turner, A., Ferrarese, L., Saha, A., Bresolin, F., Kennicutt, R. C., Stetson, P. B., Mould, J. R., Freedman, W. L., Gibson, B. K., Graham, J. A., Ford, H., Han, M., Harding, P., Hoessel, J. G., Huchra, J. P., Hughes, S. M. G., Illingworth, G. D., Kelson, D. D., Macri, L., Madore, B. F., Phelps, R., Rawson, D., Sakai, S., and Silbermann, N. A.: 1998, ApJ 505, 207
- Valentijn (1990) Valentijn, E. A.: 1990, Nature 346, 153
- Valentijn (1994) Valentijn, E. A.: 1994, MNRAS 266, 614
- White and Keel (1992) White, R. E. and Keel, W. C.: 1992, Nature 359, 129
- White et al. (2000) White, R. E., Keel, W. C., and Conselice, C. J.: 2000, ApJ 542, 761
| Name | Exp Time | Prop. ID. | Reference | ||
|---|---|---|---|---|---|
| NGC 925 | 26400.0 | 9000.0 | 5397 | Silbermann et al. (1996) | |
| NGC 1365 | 66560.0 | 16060.0 | 5972 | Silbermann et al. (1999) | |
| NGC 1425 | 58800.0 | 29700.0 | 5972/6431 | Mould et al. (2000) | |
| NGC 1637 | 26400.0 | 13200.0 | 9155 | Leonard et al. (2002b, a) | |
| NGC 2541 | 28760.0 | 12760.0 | 5972 | Ferrarese et al. (1998) | |
| NGC 2841 | 26400.0 | 11000.0 | 8322 | Macri et al. (2001) | |
| NGC 3031 (M81) | 2000.0 | 2000.0 | 9073 | Liu et al. (2002) | |
| NGC 3198 | 27760.0 | 12560.0 | 5972 | Kelson et al. (1999) | |
| NGC 3319 | 26400.0 | 10400.0 | 6431 | Sakai et al. (1999) | |
| NGC 3351 (M95) | 31900.0 | 9830.0 | 5397 | Graham et al. (1997) | |
| NGC 3621-1 | 5200.0 | 7800.0 | 8584 | Sakai et al. (2004) | |
| NGC 3621-2 | 20759.0 | 7380.0 | 5397 | Rawson et al. (1997) | |
| NGC 3627 (M66) | 58800.0 | 25000.0 | 6549 | Saha et al. (1999) | |
| NGC 4321 (M100) | 32750.0 | 17150.0 | 5397 | Ferrarese et al. (1996) | |
| NGC 4414-1 | 1600.0 | 1600.0 | 8400 | Hubble Heritage | |
| NGC 4414-2 | 32430.0 | 10230.0 | 5397 | Turner et al. (1998) | |
| NGC 4496A | 68000.0 | 16000.0 | 5427 | Saha et al. (1996b) | |
| NGC 4527 | 60000.0 | 25000.0 | 7504 | Saha et al. (2001) | |
| NGC 4535 | 48800.0 | 31200.0 | 5397/6431 | Macri et al. (1999a) | |
| NGC 4536 | 68000.0 | 20000.0 | 5427 | Saha et al. (1996a) | |
| NGC 4548 (M98) | 48500.0 | 30900.0 | 6431 | Graham et al. (1999) | |
| NGC 4559 | 2000.0 | 2000.0 | 9073 | Cropper et al. (2004) | |
| NGC 4571 | 10400.0 | 26400.0 | 6833 | Macri et al. (1999b); Pierce et al. (1994) | |
| NGC 4603 | 58800.0 | 14800.0 | 6439 | Newman et al. (1999) | |
| NGC 4639 | 58800.0 | 13000.0 | 5981 | Sandage et al. (1996) | |
| NGC 4725 | 32430.0 | 10230.0 | 5397 | Gibson et al. (1999) | |
| NGC 6946 | 2000.0 | 2000.0 | 9073 | Larsen (2004) | |
| NGC 7331 | 40660.0 | 9860.0 | 5397 | Hughes et al. (1998) | |
| UGC 2302 | 15000.0 | 15600.0 | 8255 | Bovill et al. (2003) | |
| UGC 6614 | 10100.0 | 10100.0 | 8213 | Kim and McGaugh (2002) | |
| NGC 5194-1 (M51) | 2000.0 | 2000.0 | 9073 | Larsen (2004) | |
| NGC 5194-2 (M51) | 2000.0 | 2000.0 | 9073 | Larsen (2004) |
| Galaxy | Type | RA | Dec | PA | Incl. | Distance. | Galactic | Remarks | |
|---|---|---|---|---|---|---|---|---|---|
| (A) | Extinction | ||||||||
| (deg) | (deg) | (deg) | (deg) | (arcmin) | (Mpc) | (mag) | |||
| NGC 925 | SAbd | 36.820469 | 33.578880 | -70 | 62.48 | 11.22 | 9.16 | 0.147 | |
| NGC 1365 | SBb | 53.401909 | -36.140659 | 49 | 34.41 | 10.47 | 17.95 | 0.039 | |
| NGC 1425 | SBb | 55.548061 | -29.893511 | -51 | 57.32 | 5.75 | 21.88 | 0.025 | |
| NGC 1637 | SAB(rs)c | 70.367622 | -2.858040 | 27 | 30.68 | 3.98 | 8.2 | 0.078 | (1) |
| NGC 2541 | SAcd | 123.666969 | 49.061440 | -7 | 56.63 | 6.31 | 11.22 | 0.097 | |
| NGC 2841 | SAb | 140.511063 | 50.976479 | -30 | 60.33 | 8.13 | 14.1 | 0.030 | (2) |
| NGC 3031 (M81) | SA(s)ab | 148.88826 | 69.06526 | -38.5 | 58.87 | 3.63 | 0.155 | ||
| NGC 3198 | SBc | 154.979126 | 45.549690 | 37 | 61.77 | 8.51 | 13.80 | 0.024 | |
| NGC 3319 | SB(rs)cd | 159.789719 | 41.686871 | 39 | 69.51 | 6.17 | 13.30 | 0.028 | |
| NGC 3351 (M95) | SBb | 160.990555 | 11.703610 | -2 | 14.53 | 7.41 | 10.00 | 0.054 | |
| NGC 3621 | SAc | 169.567917 | -32.812599 | -16 | 58.13 | 12.3 | 6.64 | 0.156 | |
| NGC 3627 (M66) | SAB(s)b | 170.062607 | 12.991290 | 1 | 57.38 | 9.12 | 10.05 | 0.063 | |
| NGC 4321 (M100) | SABbc | 185.728745 | 15.822380 | -57 | 39.65 | 7.41 | 15.21 | 0.051 | |
| NGC 4414 | SAc | 186.612869 | 31.223545 | -20 | 48.70 | 3.63 | 17.70 | 0.038 | |
| NGC 4496A | SBm | 187.913361 | 3.939467 | 65 | 58.67 | 3.98 | 14.86 | 0.048 | |
| NGC 4527 | SAB(s)bc | 188.535400 | 2.653810 | 67 | 70.73 | 6.17 | 14.1 | 0.043 | (3) |
| NGC 4535 | SABc | 188.584625 | 8.197760 | 27 | 28.36 | 7.08 | 15.78 | 0.038 | |
| NGC 4536 | SAB(rs)bc | 188.613037 | 2.187880 | -70 | 62.61 | 7.08 | 14.93 | 0.035 | |
| NGC 4548 (M98) | SBb | 188.860123 | 14.496320 | -60 | 22.48 | 5.37 | 16.22 | 0.074 | |
| NGC 4559 | SAB(rs)cd | 188.990372 | 27.959761 | -37 | 61.77 | 10.72 | 10.88 | 0.034 | |
| NGC 4571 | SA(r)d | 189.234879 | 14.217357 | 75 | 23.07 | 3.63 | 14.9 | 0.091 | (4) |
| NGC 4603 | SA(rs)bc | 190.229980 | -40.976402 | 30 | 50.21 | 3.39 | 33.3 | 0.325 | (5) |
| NGC 4639 | SABbc | 190.718140 | 13.257536 | -25 | 43.95 | 2.75 | 21.98 | 0.050 | |
| NGC 4725 | SABab | 192.610886 | 25.500759 | 47 | 45.25 | 10.72 | 12.36 | 0.023 | |
| NGC 5194 (M51) | SA(s)bc | 202.46957 | 47.19526 | 45.0 | 25.58 | 11.22 | 8.4 | 0.067 | |
| NGC 6946 | SAB(rs)cd | 308.718048 | 60.153679 | 70 | 39.65 | 11.48 | 11.48 | 0.663 | |
| NGC 7331 | SAb | 339.267090 | 34.415920 | -12 | 57.38 | 10.47 | 14.72 | 0.176 | |
| UGC 2302 | SB(rs)m | 42.285831 | 2.127265 | 60.0 | 1.0 | 4.79 | 14.7 | 0.156 | (6) |
| UGC 6614 | SA(r)a | 174.811844 | 17.143578 | -65 | 40.54 | 1.66 | 84.68 | 0.055 | (7) |
| Galaxy | 0-0.25 | 0.25-0.5 | 0.5-0.75 | 0.75-1.0 | 1.0-1.25 | 1.25-1.5 | 1.5-1.75 | 1.75-2.0 | 2.0-2.25 | 2.25-2.5 | 2.5-2.75 |
|---|---|---|---|---|---|---|---|---|---|---|---|
| NGC 925 | |||||||||||
| NGC 1365 | |||||||||||
| NGC 1425 | |||||||||||
| NGC 1637 | |||||||||||
| NGC 2541 | |||||||||||
| NGC 2841 | |||||||||||
| NGC 3031 | |||||||||||
| NGC 3198 | |||||||||||
| NGC 3319 | |||||||||||
| NGC 3351 | |||||||||||
| NGC 3621 | |||||||||||
| NGC 3621-1 | |||||||||||
| NGC 3621-2 | |||||||||||
| NGC 3627 | |||||||||||
| NGC 4321 | |||||||||||
| NGC 4414 | |||||||||||
| NGC 4414-1 | |||||||||||
| NGC 4414-2 | |||||||||||
| NGC 4496A | |||||||||||
| NGC 4527 | |||||||||||
| NGC 4535 | |||||||||||
| NGC 4536 | |||||||||||
| NGC 4548 (M98) | |||||||||||
| NGC 4559 | |||||||||||
| NGC 4571 | |||||||||||
| NGC 4603 | |||||||||||
| NGC 4639 | |||||||||||
| NGC 4725 | |||||||||||
| NGC 5194 | |||||||||||
| NGC 5194-1 | |||||||||||
| NGC 5194-2 | |||||||||||
| NGC 6946 | |||||||||||
| NGC 7331 | |||||||||||
| UGC 2302 | |||||||||||
| UGC 6614 |
Note. — The individual radial extinction measurements of the galaxies in our sample based on the field galaxy counts. Note that the intrinsic uncertainty in the background field of galaxies keeps the error in these measurements high. The counts have been corrected for the difference in Galactic Extinction between the target foreground galaxy and the average of the HDF fields. These values are not corrected for incliination in any way. UGC6614 has the largest radial coverage due to its extreme distance; in addition to the values shown, UGC6614 has an extinction measurement for the radial interval between 2.75 and 3 of . The averages presented in the rest of the paper are the result of combining the numbers of background galaxies and we caution against averaging these values to get a profile for a subset of the sample.