Spectral structure of -shaped radio sources
Abstract
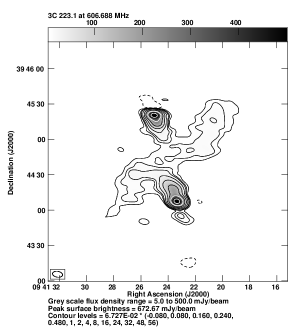
Analysis of Giant Metrewave Radio Telescope low frequency data for an -shaped source, 3C 223.1 has revealed an unusual result as discussed earlier by Lal & Rao (2004). The radio morphologies of it at 240 and 610 MHz show a well-defined -shaped structure with a pair of active jets along the north-south axis and a pair of wings along the east-west axis, that pass symmetrically through the undetected radio core. The wings (or low surface brightness jet) seem to have flatter spectral index with respect to the high surface brightness jet. This clearly shows the value of mapping the sample of -shaped sources at low frequencies. Here we present our preliminary results for two more such sources.
keywords:
galaxies: active – galaxies: individual: B1059169 – galaxies: individual: 3C 136.1 – galaxies: individual: 3C 223.1 – galaxies: formation – radio continuum: galaxies1 Introduction
A class of radio sources, “winged” or “-shaped” are characterised by two low surface brightness lobes (the ‘wings’) oriented at an angle to the ‘active’, or high surface brightness radio lobes, giving the total source an ‘’ shape; both sets of lobes pass symmetrically through the centre of the associated elliptical galaxy. Many authors have attempted to explain the unusual structure in -shaped sources. First attempt was made by Rees (1978), who suggested that the jet direction precesses due to a realignment caused by the accretion of gas with respect to the central black hole (BH) axis. Currently, there are several models that provide different explanations for the origin of -shaped sources. Following Dennett-Thorpe et al. (2002), these models can roughly be grouped into the following four formation scenarios: () Backflow from the active lobes into the wings, () slow, conical precession of the jet axis, () reorientation of the jet axis during which the flow continues and () as model , but with the jet turned off or at greatly reduced power during the change of direction. Another suggested model is that of Merritt & Ekers (2002), who identify the winged or -shaped radio sources to be the candidates where supermassive BHs are produced by galactic mergers. The BHs from the two galaxies fall to the centre of the merged system and form a bound pair and the two BHs will eventually coalesce and would lead to reorientation of a BH spin and hence a sudden flip in the direction of any associated jet. A small variant of Merritt & Ekers (2002) model was suggested by Gopal-Krishna et al. (2003), where these sources evolve along a - morphological sequence. Dennett-Thorpe et al. (2002) have argued that the wings seen in 3C 223.1 and 3C 403 cannot be produced by deflected backflow, and that, due to the observed brightness of these features, buoyant expansion cannot play a large role in their formation. A conical precession model is excluded on morphological grounds. Their interpretation, based on the lack of pronounced spectral gradients out to 32 GHz, even in the wings, favours that the jet axis underwent a major reorientation in both sources, which occurred on time-scales of no more than a few Myr. Nevertheless, keeping in mind the pros and cons of each of these models, most of the observational results seem to prefer possibilities () and () of Dennett-Thorpe et al. (2002) based on the extension of the wings and the source statistics, and/or Merritt & Ekers (2002). Our recent result for 3C 223.1 (Lal & Rao 2004, also see Fig. 1), i.e. the low surface brightness lobes (or the wings) have flatter spectra as compared to high surface brightness active radio lobes, not only does not support other less favoured models, it also does not support these most favoured models. Thus, presently it is not clear as to which model should dominate in any given source; and more importantly, it is also not clear if we understand the formation scenario of these -shaped radio sources.
Sources B1059169 (Abell 1145; redshift = 0.069) and 3C 136.1 ( = 0.064) are two of the eleven known -shaped sources (Merritt & Ekers 2002). Source 3C 136.1 does not reside in a rich cluster, instead it probably resides in similar environments to other ‘classical’ Fanaroff-Riley type II sources (FR II, Fanaroff & Riley 1974), but B1059169 resides in a cluster. Both sources are of similar radio power as that of ‘classical’ FR IIs. Also the host galaxy of B1059169 seems to be an undisturbed elliptical, but the host galaxy of 3C 136.1 either has a double nucleus or is a merger remnant (Merritt & Ekers 2002).
We have started a project to study the sample of -shaped radio sources at 240 and 610 MHz using the Giant Metrewave Radio Telescope (GMRT). We have recently submitted our results for 3C 223.1 (Lal & Rao 2004, also see Fig. 1). Here we present preliminary results for B1059169 and 3C 136.1 and describe the morphological and spectral properties. We use the data to study the behaviour of the low frequency spectra at several locations (north and south wings and east and west lobes) across the source and compare it with the existing models. Our subsequent papers would discuss the radio morphologies and statistical results that we have obtained from radio observations using GMRT.
2 Observations
The 240 and 610 MHz feeds of GMRT (Ananthakrishnan & Rao 2002) are coaxial feeds and therefore, simultaneous multi-frequency observations at these two frequencies are possible. We made full-synthesis observations of B1059169 and 3C 136.1 at 240 and 610 MHz, in the dual-frequency mode, using the GMRT on 8 Feb 2004 and 9 Jan 2003 respectively, in the standard spectral line mode with a spectral resolution of 125 kHz. The visibility data were converted to FITS and analyzed using standard AIPS. The flux density calibrator 3C 147 was observed in the end for each source as an amplitude calibrator and also to estimate and correct for the bandpass shape. We used the flux density scale which is an extension of the Baars et al. (1977) scale to low frequencies, using the coefficients in AIPS task ‘SETJY’. Sources B1021219 and B0521166 were used as the phase calibrator for B1059169 and 3C 136.1 respectively, and were observed once every 35 min. The error in the estimated flux density, both due to calibration and systematic, is 5 %. The data suffered from scintillations and intermittent radio frequency interference (RFI). In addition to normal editing of the data, the scintillation-affected data and channels affected due to RFI were identified and edited, after which the central channels were averaged using AIPS task ‘SPLAT’. To avoid bandwidth smearing, for B1059169 source, 6.75 MHz of clean band at 240 MHz was reduced to 6 channels of 1.125 MHz each; and at 610 MHz where there was little RFI, 13.5 MHz of clean band was averaged to give 3 channels of 4.5 MHz each. Similarly, for 3C 136.1 source, 6.75 MHz of clean band was averaged to give 6 channels of 1.125 MHz each at 240 MHz; and 6.75 MHz of clean band was averaged to give 2 channels of 3.375 MHz each at 610 MHz.
While imaging, 49 facets, spread across 2 field were used at 240 MHz and 9 facets covering slightly less than 0. field, were used at 610 MHz to map each of the two fields using AIPS task ‘IMAGR’. We used ‘uniform’ weighting and the 3D option for W term correction throughout our analysis. The presence of a large number of point sources in the field allowed us to do phase self-calibration to improve the image. After 2-3 rounds of phase self-calibration, a final self-calibration of both amplitude and phase was made to get the final image. At each round of self-calibration, the image and the visibilities were compared to check for the improvement in the source model. The final maps were combined using AIPS task ‘FLATN’ and corrected for the primary beam of the GMRT antennas.
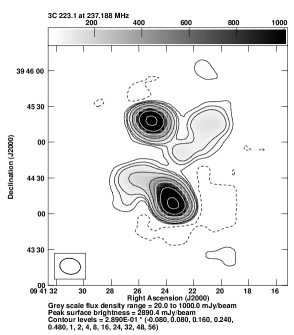
The full synthesis radio images shown in Figs. 2 and 3 have nearly complete UV coverage, an angular resolution 15′′ and 6′′ and the rms noise in the maps are 2.0 and 0.2 mJy beam-1 at 240 and 610 MHz respectively. The dynamic ranges in the two maps are 200 and 600 in case of B1059169 and 600 and 500 in case of 3C 136.1 respectively at 240 and 610 MHz. The GMRT has a hybrid configuration (Swarup et al. 1991; Ananthakrishnan & Rao 2002) with 14 of its 30 antennas located in a central compact array with size 1.1 km and the remaining antennas distributed in a roughly ‘Y’ shaped configuration, giving a maximum baseline length of 25 km. The hybrid configuration gives reasonably good sensitivity for both compact and extended sources.
 |
 |
 |
 |
 |
 |
 |
 |
 |
 |
 |
 |
3 Radio morphology
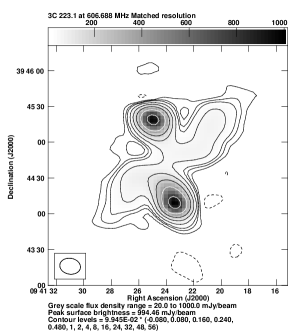
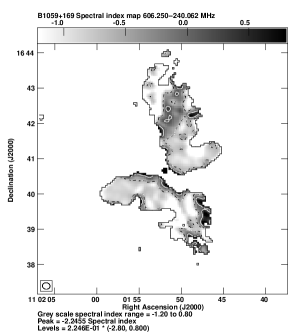
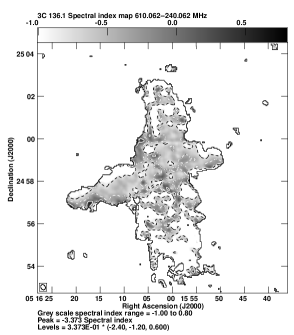
The first high angular resolution, high sensitivity images of 3C 223.1, B1059169 and 3C 136.1 at the lowest frequencies of 240 MHz (upper right panel) and 610 MHz (upper left panel) are shown in Figs. 1, 2 and 3 respectively.
In all three cases, our estimates at both frequencies, 240 and 610 MHz agree well with that of measurements with other instruments. Also, the sources are small (roughly 4–8 arcmin across) and are much smaller than the primary beam. Furthermore, we have simulated the source at one frequency using UV coverage corresponding to the other frequency and vice versa; the maps show similar morphologies and flux densities. We therefore believe that we have not lost any flux density in our interferometric observations at the two different frequencies.
4 Low frequency radio spectra
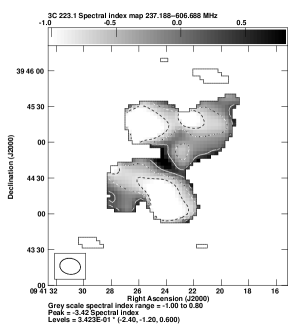
The observations and morphology described above allow us to investigate in detail the spectral index distributions of B1059169 and 3C 136.1. The final calibrated UV data at 610 MHz was first mapped using UV taper 0–22 k, which is similar to that of 240 MHz data and then restored using the restoring beam corresponding to the 240 MHz map. These restored and matched maps, were used further for the spectral analysis. We looked at the spatially ‘filtered’ images (Wright et al. 1999) and ‘spectral tomography’ images (Rudnick 2002) to enhance weak features seen in the maps. We do not find evidence for a new feature emerging in the filtered or tomographic images, which could have been missed in the single frequency maps. While, it could also be due to sensitivity limits of our maps, this is possibly due to the fact that these techniques are effective in separating overlapping large-scale and small-scale features with different spectral distributions. Hence, these techniques are found to be useful for objects such as radio galaxies and supernova remnants (Rudnick 2002). We determine the spectral index distribution using standard, direct method of determining the spectral index between maps and at two frequencies and . This is given by
We deduce the flux densities at 240 and 610 MHz using images shown in Figs. 2 and 3, which are matched to the same resolution. The flux densities for the active lobes and the wings are integrated over the region, which is at least 4-5 times the beam size and above their 3 contour to reduce statistical errors. Also, analysis of the spectrum in different regions of the source shows remarkable variation across the source (see Figs. 2 and 3, lower right panels).
3C 223.1 The low frequency (240–610 MHz) fitted spectra have 0.37 1.08 for all regions across the source. The source also shows evidence for steeper spectra in the active lobes than in the wings. The east and west wings have low frequency (240–610 MHz) spectral indices of 0.37 0.03 and 0.62 0.02 respectively, whereas the north and south active lobes have values of 1.08 0.01 and 1.08 0.01 respectively. These results at low frequencies are consistent with those obtained at high frequency (Dennett-Thorpe et al. 2002); i.e. the high frequency (1.4–32 GHz) spectral indices were respectively 0.70 0.03 and 0.66 0.03 for east and west wings, and 0.75 0.02 and 0.77 0.02 for north and south active lobes. Or, in other words, low surface brightness lobes have flatter spectra as compared to high surface brightness active radio lobes.
B1059169 Here, The low frequency (240–610 MHz) fitted spectra have 0.22 0.88 for all regions across the source. The source shows evidence for steeper spectra in the active lobes than in the wings, similar to 3C 223.1. The east and west active lobes have low frequency (240–610 MHz) spectral indices of 0.88 0.01 and 0.76 0.01 respectively, whereas the north and south wings have values of 0.22 0.02 and 0.53 0.02 respectively. Or, in other words, low surface brightness lobes have flatter spectra as compared to high surface brightness active radio lobes.
3C 136.1 Here, the low frequency (240–610 MHz) fitted spectra have 0.61 0.76 for all regions across the source. This source does not show evidence for steeper spectra in the active lobes than in the wings. Instead, the east and west active lobes have low frequency (240–610 MHz) spectral indices of 0.61 0.01 and 0.61 0.02 respectively, whereas the north and south wings have values of 0.76 0.01 and 0.71 0.02 respectively. Or, in other words, it is the high surface brightness active lobes that have flatter spectra as compared to low surface brightness (wings) radio lobes.
The errors in spectral index corresponding to errors in the estimated flux density, both due to calibration and systematic, are less than 0.07. Even if we choose more conservative value of 10 % as error in the estimated flux density, the error in spectral index is 0.15. Since, the observed differences in spectral index are much more between the wings and active lobes in 3C 223.1 and B1059169, we believe that the observed spectral index features are real.
5 Results
We have presented the low frequency images of 3C 223.1, B1059169 and 3C 136.1 at 240 and 610 MHz. We find that the low surface brightness lobes (or the wings) for 3C 223.1 and B1059169 have flatter spectra as compared to high surface brightness active radio lobes. In case of 3C 136.1, it is the high surface brightness active radio lobes, which have flatter spectra as compared to the low surface brightness lobes (or the wings).
The important consequence of our observations for -shaped sources is that there is some ambiguity as to the formation of -shaped sources. Low frequency, high resolution radio images for all the sample -shaped sources would be useful in independently establishing the formation models for these sources, which would be discussed in our subsequent papers.
Acknowledgments
We thank the staff of the GMRT who have made these observations possible. GMRT is run by the National Centre for Radio Astrophysics of the Tata Institute of Fundamental Research. We thank the anonymous referee for several useful comments. DVL thanks R. Nityananda for discussions and several useful comments. This research has made use of the NASA/IPAC Extragalactic Database which is operated by the Jet Propulsion Laboratory, Caltech, under contract with NASA, and NASA’s Astrophysics Data System.
References
- [1] Ananthakrishnan, S., Rao, A.P., 2002, Multi Colour Universe, eds B. Paul & R. Manchanda, TIFR, India, p. 233
- [2] Baars, J.W.M., Genzel, R., Pauliny-Toth, I.I.K., Witzel, A., 1977, A&A, 61, 99
- [3] Dennett-Thorpe, J., Scheuer, P.A.G., Laing, R.A., Bridle, A.H., Pooley, G.G., Reich, W., 2002, MNRAS, 330, 609
- [4] Fanaroff, B.L., Riley J.M., 1974, MNRAS, 167, 31P
- [5] Gopal-Krishna, Biermann, P.L., Wiita, P.J., 2003, ApJL, 594, 103
- [6] Lal, D.V., Rao, A.P, 2004, MNRAS, submitted
- [7] Merritt, D, Ekers, R.D., 2002, Science, 297, 1310
- [8] Rees, M.J., 1978, Nature, 275, 516
- [9] Rudnick, L., 2002, PASP, 114, 427
- [10] Swarup, G., Ananthakrishnan, S., Kapahi, V.K., Rao, A.P., Subrahmanya, C.R., Kulkarni, V.K., 1991, Current Science, 60, 95
- [11] Wright, M., Dickel, J., Koralesky, B., Rudnick, L., 1999, ApJ, 518, 284