FUSE Observations of Nebular O VI Emission from NGC 6543111Based on observations made with the NASA-CNES-CSA Far Ultraviolet Spectroscopic Explorer. FUSE is operated for NASA by the Johns Hopkins University under NASA contract NAS 5-32985.
Abstract
NGC 6543 is one of the few planetary nebulae (PNe) whose X-ray emission has been shown to be extended and originate from hot interior gas. Using FUSE observations we have now detected nebular O VI emission from NGC 6543. Its central star, with an effective temperature of 50,000 K, is too cool to photoionize O V, so the O VI ions must have been produced by thermal collisions at the interface between the hot interior gas and the cool nebular shell. We modeled the O VI emission incorporating thermal conduction, but find that simplistic assumptions for the AGB and fast wind mass loss rates overproduce X-ray emission and O VI emission. We have therefore adopted the pressure of the interior hot gas for the interface layer and find that expected O VI emission to be comparable to the observations.
Subject headings:
conduction — planetary nebulae: individual (NGC 6543) — ultraviolet: ISM1. Introduction
Planetary nebulae (PNe) are formed through dynamic interactions between the current fast stellar wind and previous asymptotic giant branch (AGB) wind (Kwok, 1983; Frank et al., 1990); thus, the interior of a PN is filled with shocked fast wind. This hot interior gas and the cool nebular shell form a contact discontinuity where heat conduction (Spitzer, 1962) is expected to occur. The resulting mass evaporation from the dense nebular shell into the hot interior lowers the temperature and raises the density of the hot gas (Weaver et al., 1977), significantly increasing the X-ray emissivity. Hydrodynamic models of PNe with heat conduction predict X-ray emission that should be easily detectable with modern X-ray observatories (Zhekov & Perinotto, 1996).
Chandra and XMM-Newton have indeed detected diffuse X-ray emission from PNe, with plasma temperatures of K and X-ray luminosities of erg s-1 (Guerrero et al., 2004). The limb-brightened X-ray morphology and the low plasma temperatures are qualitatively consistent with the predictions of models with heat conduction; however, the observed are generally too low. For example, the observed of NGC 6543, ergs s-1 (Chu et al., 2001), is an order of magnitude lower than that modeled by Zhekov & Perinotto (1998). Similar discrepancies between observed and modeled have been seen in Wolf-Rayet bubbles (e.g., NGC 6888, García-Segura et al., 1996) and superbubbles (e.g., M17, Dunne et al., 2003), suggesting that this problem may be associated with thermal conduction per se.
Thermal conduction has been assumed in theoretical models but not constrained empirically through observation because interfaces at a few K require difficult UV observations. Traditionally interfaces have been studied using spectral lines of C IV, N V, and O VI; however, these species can be photoionized by hot stars (especially PN central stars with effective temperatures 100,000 K) and the detection of these narrow absorption lines can be hampered by the stellar P Cygni profile and confused by interstellar absorption lines.
We have chosen to study the interface layer in the PN NGC 6543 using O VI emission because the physical properties of its interior hot gas have been established by Chandra observations (Chu et al., 2001) and its central star is too cool to produce O VI by photoionization ( K, Zweigle et al., 1997). Far Ultraviolet Spectroscopic Explorer (FUSE) observations of NGC 6543 have been made and O VI emission is indeed detected. In this paper we describe the observations and data processing in §2, present the results in §3, and discuss their implications in §4.
2. FUSE Observations and Reduction
We have observed NGC 6543 with FUSE to search for nebular O VI emission. The FUSE observatory has four spectrographs operating simultaneously to cover the 905–1187 Å wavelength range with high resolution, 20,000. Details of the design and performance of the FUSE spectrographs are described by Moos et al. (2000) and Sahnow et al. (2000).
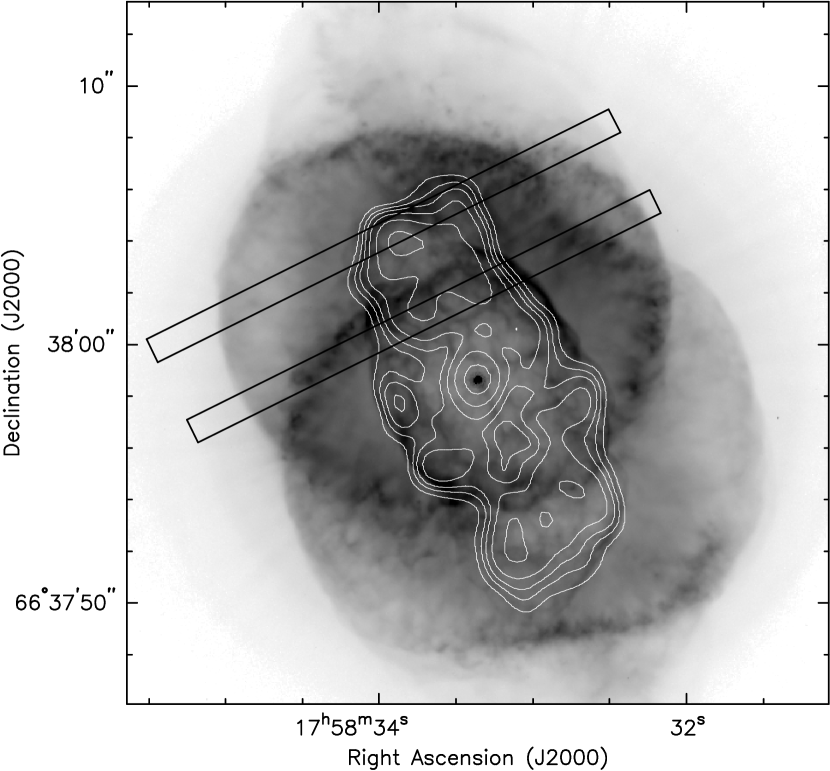
Three observations of NGC 6543 were obtained in the time-tag mode using the HIRS aperture (12520″): “N-Cav” samples the northern edge of the central cavity, “N-Ext” the northern extension of the cavity, and “OFF” a region outside the nebula at 150″ north of the central star (see Fig. 1 for their locations). Additional observations of the central star, available in the archive and referred to as CS, used the MDRS aperture (4″20″) and were acquired in the histogram mode.
Due to flexure of the instrument, only the LiF1 detector segment remains fixed with respect to a position on the sky throughout an orbit. Thus, we only analyzed observations obtained with the LiF1a detector segment. The individual exposures were reprocessed using the FUSE calibration pipeline software, CALFUSE (version 2.4.0), to extract a 1-dimensional spectrum for each exposure. The observations of the central star obtained in histogram mode were also processed using the CALFUSE pipeline with its default settings.
The diagnostics produced by the CALFUSE pipeline were examined to ensure that the spectral extraction window was properly centered, and to exclude burst/flare events and periods when the central star drifted into the HIRS aperture. Spectral drift between exposures was removed by cross-correlating the individual exposures relative to the longest exposure. The typical offset found was generally less than 1 pixel (0.0067Å) and never more than 5 pixels. The individual exposures for each position were then weighted by their exposure times and combined. The coadded spectra for the N-Cav, N-Ext, OFF, and CS positions had total effective exposure times of 14.4, 13.7, 37.3, and 2.3 ks, respectively.
3. Results
The four FUSE spectra of NGC 6543 are presented in Figure 2. The CS spectrum shows very broad P Cygni profile of the stellar O VI lines with numerous interstellar absorption lines of H2 and low ionization ions. The OFF position shows only airglow lines of Ly and O I. In contrast, the spectra at the N-Cav and N-Ext show prominent narrow emission lines of C II 1036,1037, broad emission lines of O VI 1032,1038, and a broad unidentified emission line at 1034.432 Å, superposed on continuum emission that has a spectral shape similar to that of the CS.

The continuum emission in the nebular spectra is most likely stellar emission scattered by dust in the nebular gas. To remove this contamination, we have scaled the stellar spectrum by factors of 0.018 and 0.0075 and subtracted it from the nebular spectra of N-Cav and N-Ext, respectively. An expanded view of the O VI lines in Figure 3 shows that the continuum contamination is effectively removed and the weaker O VI 1038 line becomes more prominent. We determine the centroid velocity and FWHM of each line by fitting a Gaussian profile, but measure the line intensity by direct summation. The O VI 1038 line flux and shape should be regarded with some skepticism because the emission line is close to a strong C II absorption line and is in a spectral region where the P Cygni profile from the central star may be oversubtracted. The results of these measurements are summarized in Table 1.
| Intrinsic | ||||
|---|---|---|---|---|
| Obs. | Line | Centroid | FWHM | Intensity |
| [km s-1]aaAll velocities are in the heliocentric frame and assume rest wavelength for the O VI transitions of 1031.9261 and 1037.6167 Å (Morton, 2003). | [km s-1] | [erg cm-2 s-1] | ||
| N-Cav | 1032 | 83.1 | 56.0 | 2.310-13 |
| 1038 | 79.9 | 45.9 | 1.210-13 | |
| N-Ext | 1032 | 88.9 | 67.1 | 1.110-13 |
| 1038 | 88.6 | 51.4 | 6.710-14 |
To convert from the observed to the intrinsic intensity of the O VI emission from NGC 6543, we adopt Å, or determined from the parameterized far-UV extinction curve of Sasseen et al. (2002). The optical extinction of NGC 6543 has been determined by Wesson & Liu (2004) using the Balmer decrement as determined from HST WFPC2 images in the H and H lines. It is shown that the extinction is fairly uniform across NGC 6543 and the average logarithmic extinction at H is = 0.1. As , the extinction at 1034Å is = 0.900.33, where the uncertainty is based on the observational scatter seen in far-UV extinction measurements (Sasseen et al., 2002). The intrinsic O VI line intensity is therefore 2.3 times the observed intensity.
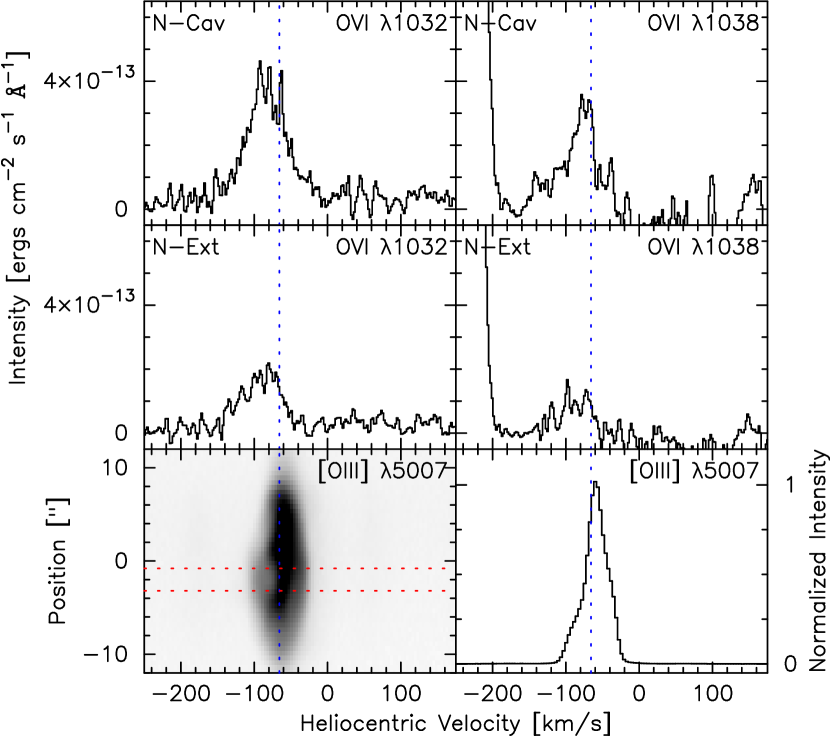
In Figure 3 we further compare the velocity profile of the O VI lines to that of the [O III]5007 line from an east-west oriented long-slit echelle spectroscopic observation taken at a position 45 north of the central star. The brightest emission component in the [O III] line image has low velocities and corresponds to the dense envelope of the nebular shell, and the faint expanding “blister” near the center of the line image corresponds to the northern extension of the central cavity. The heliocentric velocity of the O VI emission is similar to that of the expanding blister in the [O III] line indicating that they are physically associated.
4. Discussion
FUSE observations of NGC 6543 and NGC 7009 (Iping, Sonneborn, & Chu, 2002) detect, for the first time, O VI emission from PNe. Since the central star of NGC 6543 is too cool to photoionize O V, the O VI ions must be produced by thermal collisions in gas at temperatures of a few K at the interface layer between the cool nebular shell and the hot gas in the PN interior. Therefore the intensity of O VI in NGC 6543 can be used to investigate the physical processes at the interface.
Are the FUSE observations of O VI from NGC 6543 consistent with that expected from thermal conduction in such an interface layer? To model the expected O VI emission, we assume that the PN shell is a pressure-driven bubble and the radiative losses of the hot interior gas have a negligible effect on the dynamics. We further assume a constant AGB mass loss, resulting in a radial density profile for the circumstellar medium. The dynamics of such a bubble can be solved analytically (e.g., García-Segura & Mac Low, 1995) and is characterized by a pressure and age which can be expressed in terms of observed quantities such as the fast stellar wind terminal velocity and mass loss rate, and the nebular shell size and expansion velocity. To calculate the temperature and density structure at the interface layer, radiative losses and thermal conduction are considered by numerically solving the continuity and energy equations (i.e., Equations (42) and (43) of Weaver et al., 1977) which rely directly upon the pressure and age found from the analytic solution.
The central star of NGC 6543 has a fast wind terminal velocity of 1750 km s-1 and a mass loss rate of 4.010-8 M⊙ yr-1 (Perinotto et al., 1989). Adopting a distance of 1.00.3 kpc (Reed et al., 1999), the radii of N-Cav and N-Ext are 0.02 and 0.04 pc, respectively. The expansion velocity of NGC 6543’s nebular shell near the nebular minor axis is 20 km s-1 (Miranda & Solf, 1992), which is appropriate for the N-Cav position. The [O III] emission associated with the N-Ext shows a velocity offset of 30 km s-1 from the systemic velocity of NGC 6543 (see Fig. 3); for an inclination angle of 35∘ (Miranda & Solf, 1992) the expansion velocity will be 40 km s-1.
Use of these observational parameters results in an analytic solution with a nebular age of 1000 yrs and a pressure in the central cavity of 310-7 dyne cm-2. If we compare these values with independent estimates we find that the age is reasonable for NGC 6543 (e.g., Reed et al., 1999) but the pressure is roughly a factor of 10 higher than indicated by observations of both the cool nebular shell and the hot gas interior. Consequently this simple model would over-produce as did the models of Zhekov & Perinotto (1998). Likewise, using the method outlined later, we find the expected O VI emission to be 10 times higher than observed. Both of these discrepencies arise from the incorrect model prediction of pressure within the central cavity, and are likely caused by incorrect assumptions about the fast and AGB wind mass loss rates.
To obtain an alternative estimate of the O VI emission we consider the observed pressure in the nebular shell and hot interior. In the nebular shell Zhang et al. (2004) find an electron density of 6300 cm-3 and temperature of 6800 K, and Robertson-Tessi & Garnett (2004) find 10000 cm-3 and 8000 K, indicating a pressure of 1.2–2.210-8 dyne cm-2. For the interior hot gas Chu et al. (2001) find that the X-ray emitting gas has a plasma temperature of 1.6106 K and electron density of 50, where is the filling factor. For 0.5, the pressure in the central cavity is 310-8 dyne cm-2, similar to the pressure in the nebular shell. We adopt the pressure obtained for the hot gas in the continuity and energy equations to determine the temperature and density structure of the interface layer. The resulting temperature and density profile applicable to the N-Cav observations are plotted as a function of distance from the inner wall of the nebular shell in Figure 4.

The O VI density can be determined from the temperature and density profile by assuming ionization equilibrium and adopting a nebular oxygen abundance relative to hydrogen of 5.610-4 (Aller & Czyzak, 1983; Bernard-Salas, et al., 2003). The O VI 1032,1038 line intensity, , in ergs s-1 cm-2 can be derived from equations 4.4 and 4.11 of Spitzer (1978) and expressed as:
| (1) |
where and are respectively the number densities of electrons and O VI ions in units of cm-3, is the average photon energy in ergs, is the temperature in Kelvin, is the Maxwellian-averaged collision strength222 A parameterization for is given as equation (6) of Shull & Slavin (1994)., is the statistical weight of the lower energy state (in this case ), is the excitation energy of the upper energy state (in this case ergs), is the emitting volume in cm3, and is the distance to the object in cm.
The O VI emission per unit volume, , is plotted in Figure 4 and suggests the thickness of the emitting layer would be 51014 cm (0.00016 pc). To simulate the FUSE observations of N-Cav and N-Ext we integrate over a short cylinder corresponding to the volume intersected by the HIRS aperture, i.e., 4″-radius and 125-height). Based on these calculations we would expect 5.210-13 erg cm-2 s-1 and 2.610-13 erg cm-2 s-1 at the N-Cav and N-Ext positions, respectively. While the predicted O VI emission intensity is roughly 1.5 times higher than observed, the two are consistent given the uncertainties in the model parameters.
In summary, we have detected nebular O VI emission from NGC 6543 from hot gas that is most likely at the interface between the nebular shell and the hot, X-ray-emitting gas within the PN interior. We have used the fast wind and nebular properties to model the O VI emission but find large discrepancies similar to those found for . This may result from overly simplistic assumptions for the fast and AGB wind mass loss rates. The observed pressures in the nebular shell and interior hot gas are similar. Adopting the hot gas pressure for the interface layer, we find that the model with thermal conduction predicts O VI emission consistent with the observations.
References
- Aller & Czyzak (1983) Aller, L. H., & Czyzak, S. J. 1983, ApJS, 51, 211
- Bernard-Salas, et al. (2003) Bernard-Salas, J., Pottasch, S. R., Wesselius, P. R., & Feibelman, W. A. 2003, A&A, 406, 165
- Chu et al. (2001) Chu, Y.-H., Guerrero, M. A., Gruendl, R. A., Williams, R. M., & Kaler, J. B. 2001, ApJ, 553, L233
- Dunne et al. (2003) Dunne, B. C., Chu, Y.-H., Chen, C.-H. R., Lowry, J. D., Townsley, L., Gruendl, R. A., Guerrero, M. A., & Rosado, M. 2003, ApJ, 590, 306
- Frank et al. (1990) Frank, A., Balick, B., & Riley, J. 1990, AJ, 100, 1903
- García-Segura et al. (1996) García-Segura, G., Langer, N., & Mac Low, M.-M. 1996, A&A, 316, 133
- García-Segura & Mac Low (1995) García-Segura, G., & Mac Low, M.-M. 1995, ApJ, 455, 145
- Guerrero et al. (2004) Guerrero, M. A., Chu, Y.-H., & Gruendl, R. A. 2004, ASP Conf. Ser. 313: Asymmetrical Planetary Nebulae III: Winds, Structure and the Thunderbird, 259
- Iping, Sonneborn, & Chu (2002) Iping, R. C., Sonneborn, G., & Chu, Y.-H. 2002, BAAS, 34, 1254
- Kwok (1983) Kwok, S. 1983, in IAU Symp. 103, Planetary Nebulae, ed. D. R. Flower (Dordrecht: Reidel), 293
- Miranda & Solf (1992) Miranda, L. F. & Solf, J. 1992, A&A, 260, 397
- Moos et al. (2000) Moos, H. W. et al. 2000, ApJ, 538, 1
- Morton (2003) Morton, D.C., 2003, ApJS, 149, 205
- Perinotto et al. (1989) Perinotto, M., Cerruti-Sola, M., & Lamers, H. J. G. L. M. 1989, ApJ, 337, 382
- Reed et al. (1999) Reed, D. S., et al. 1999, AJ, 118, 2430
- Robertson-Tessi & Garnett (2004) Robertson-Tessi, M. & Garnett, D. R. 2004, in preparation
- Sahnow et al. (2000) Sahnow, D. J. et al. 2000, ApJ, 538, L7
- Sasseen et al. (2002) Sasseen, T. P., Hurwitz, M., Dixon, W. V., & Airieau, S. 2002, ApJ, 566, 267
- Shull & Slavin (1994) Shull, J. M., & Slavin, J. D. 1994, ApJ, 427, 784
- Spitzer (1962) Spitzer, L. 1962, Physics of Fully Ionized Gases, (New York: Interscience)
- Spitzer (1978) Spitzer, L. 1978, Physical Processes in the Interstellar Medium, (New York: John Wiley & Sons)
- Weaver et al. (1977) Weaver, R., McCray, R., Castor, J., Shapiro, P., & Moore, R. 1977, ApJ, 218, 377
- Wesson & Liu (2004) Wesson, R., & Liu, X.-W. 2004, MNRAS, 351, 1026
- Zhang et al. (2004) Zhang, Y., Liu, X.-W., Wesson, R., Storey, P. J., Liu, Y., & Danziger, I. J. 2004, MNRAS, 351, 935
- Zhekov & Perinotto (1996) Zhekov, S. A., & Perinotto, M. 1996, A&A, 309, 648
- Zhekov & Perinotto (1998) Zhekov, S. A., & Perinotto, M. 1998, A&A, 334, 239
- Zweigle et al. (1997) Zweigle, J. et al. 1997, A&A, 321, 891