EGRET upper limits and stacking searches of -ray observations of luminous and ultra-luminous infrared galaxies
Abstract
We present a stacking analysis of EGRET -ray observations at the positions of luminous and ultraluminous infrared galaxies. The latter were selected from the recently presented HCN survey, which is thought to contain the most active star forming regions of the universe. Different sorting criteria are used and, whereas no positive collective detection of -ray emission from these objects we determined both collective and individual upper limits. The upper most excess we find appears in the case of ULIRGs ordered by redshift, at a value of 1.8.
1 Introduction
Luminous infrared galaxies (LIRGs) are the dominant population of extragalactic objects in the local () universe at bolometric luminosities above L⊙. Ultra luminous infrared galaxies (ULIRGs) present L⊙, and are the most luminous local objects (see Sanders & Mirabel 1996 for a review). The most notable feature of LIRGs and ULIRGs is perhaps the large concentration of molecular gas that they have in their centers, at densities orders of magnitude larger than found in Galactic giant molecular clouds (e.g., Downes et al. 1993; Downes & Solomon 1998; Bryant & Scoville 1999). This large molecular material is believed to be the result of a merging process between two or more galaxies, in which much of the gas in the former spiral disks —particularly that located at distances less than 5 kpc from each of the pre-merger nuclei— has fallen together, therein triggering a huge starburst phenomenon (e.g., Sanders et al. 1988; Melnick & Mirabel 1990). LIRGs and ULIRGs thus have large CO luminosities and a high value for the ratio , both being about one order of magnitude greater than for normal spirals. The latter substantiates, based on star formation models, a greater star formation rate per unit mass of gas.
In a recent letter Torres et al. (2004), by computing the -ray flux produced by the interaction between an enhanced cosmic ray population and the molecular material, ultimately leading to neutral pion decay, it was shown that LIRGs and ULIRGs are plausible sources for GLAST and the next generation of Cherenkov telescopes. This result was deepened by a detailed analysis of the -ray emission from Arp 220, the most extensively studied ULIRG, that included the emission of secondaries Torres (2004). The enhanced population of relativistic particles is the result of the large number of supernovae and young stellar objects present in the central environment. The star formation rate in LIRGs is 100–1000 times larger (e.g., Gao & Solomon 2004b; Pasquali et al. 2003) and scales with the amount of dense molecular gas (traced in turn by the HCN line). It is natural to expect that the central regions of LIGs have cosmic ray enhancements comparable to the ratio between their star formation rates (SFRs) and that of the Milky Way. Torres et al. (2004) showed that if this is correct, then many of the LIRGs –particularly those located in the 100 Mpc sphere– are going to appear as individual GLAST sources.
Although detailed predictions for a particular ULIRG (Arp 220, Torres 2004) suggest that these galaxies were below EGRET sensitivity, it was yet open to discussion if they would show up in an stacking search. This search, similar to what was made by Cillis et al. (2004) for radiogalaxies, and by Reimer et al. (2003) for clusters of galaxies, is presented here. We also provide here upper limits from existing EGRET data for the fluxes of LIRGs in different energy bands, which are useful both, for future theoretical modelling and for consistency check with new sets of data.
2 Stacking technique
The general stacking method we have applied follows that outlined by Cillis et al. (2004) when studying radiogalaxies. In order to perform the stacking technique and look for a possible collective detection of the -ray emission from LIRGs, we have extracted rectangular sky maps with the selected target objects located at the center.
We have used EGRET data from April 1991 through September 1995 —as covered by the Third EGRET Catalog (Hartman et al. 1999), in celestial and galactic coordinates. The extracted maps for each particular target were chosen to be in size, in order to have large off fields of views and be consistent the EGRET point spread function (PSF).
Transforming the maps to an equatorial position before co-adding them causes a substantial image distortion, except for those originally near the all-sky map equator. To minimize this distortion we have extracted maps from the all-sky map, celestial or Galactic, which had the target object closer to its equator. This was done for both, count and the exposure maps, and for all targets. We have transformed the coordinates of each map into pseudo-coordinates, with the target object at the center. After doing this, the maps were co-added, producing the stacking.
It was also necessary to extract a diffuse background map for each target object. For this purpose, we have used the diffuse model that is standard in EGRET analysis Hunter et al. (1997). In order to take into account the existence of known EGRET sources, idealized sources with the appropriate fluxes distributed following EGRET’s PSF were added to the diffuse map. This was done only for the sources that were detected significantly during the time interval of the all-sky maps: 3EG sources that were significantly detected only during shorter sub-intervals were not considered for the background model. It was necessary to normalize each one of the extracted diffuse maps () for the different exposures () of the target objects. The extracted diffuse map for each target object was also transformed into pseudo-coordinates. Finally the diffuse maps for the co-added data were obtained as: where are the counts diffuse maps () and .
Stacked maps for the different groups of objects analyzed below were created and results are described in the next section. To find the significance of the detection in a particular “class” we have used the EGRET likelihood ratio Mattox et al. (1996), a formalism that produces a “test statistic” (“TS”) , where and are likelihood values with and without a possible source. is roughly equivalent to the number of standard deviations ().
3 Classes of LIRGS and results
We have stacked galaxies from the HCN survey (Gao & Solomon 2004a; Gao & Solomon 2004b) after sorting them using different criteria. The HCN survey is a systematic observation of 53 IR-bright galaxies, including 20 LIRGs with L⊙, 7 with L⊙, and more than a dozen of the nearest normal spiral galaxies. Essentially, all galaxies with strong CO and IR emission were chosen for survey observations. It also includes a literature compilation of data for another dozen IR-bright objects. This is the largest and most sensitive HCN survey of galaxies, and thus of dense interstellar mass residing there, to date.
We have excluded from our consideration those galaxies that are close to the Galactic Plane (outer Galaxy), and (), because the background around those objects would overwhelm any possible signal.
Table 1 shows all the galaxies in the HCN survey referred above, ordered by indicating their coordinates, redshift, the ratio between line luminosities – and –, and cosmic ray enhancement. In that Table, the column “Galactic Plane” shows whether the galaxy is within (outer Galaxy), and () and thus whether that galaxy was excluded from our tests. Following Torres et al. (2004), to which we refer for details, we have computed the minimum average value of cosmic ray enhancement, dubbed , for which the -ray flux above 100 MeV would be above 2.4 photons cm-2 s-1. The latter is approximately the GLAST satellite sensitivity after 1 yr of all-sky survey. -values of at least a few hundreds are deemed probable, based on enhancements derived in individual supernova remnants. Luminosity distances used were those provided in the HCN survey, assuming a Hubble parameter of =75 km s-1 Mpc-1; although, since redshifts are very small, changes in the cosmological model do not introduce significant changes in distances. We selected the galaxies to perform the stacking technique taking into account the brightest, the nearest, those having the smaller cosmic ray enhancement needed to produce fluxes above GLAST sensitivity, and finally the ratios between the and , and between SFR and . In the case of the latter, those galaxies having are believed to be particular good candidates for detection.
For each class or subclass we have generated stacked maps containing galaxies, with =2, 4, 6, etc. For each stacked map so generated, we have then determined the detection significance using the standard likelihood method. The results of this research are summarized in Table 2. For each sorting criterion we have specified the total number of the objects considered, the maximum detection significance, and the number of objects yielding that maximum. We have found no significant result above , for any class investigated and for any number of objects included. This number was obtained for the case in which all ULIRGs with were considered ordered by redshift.
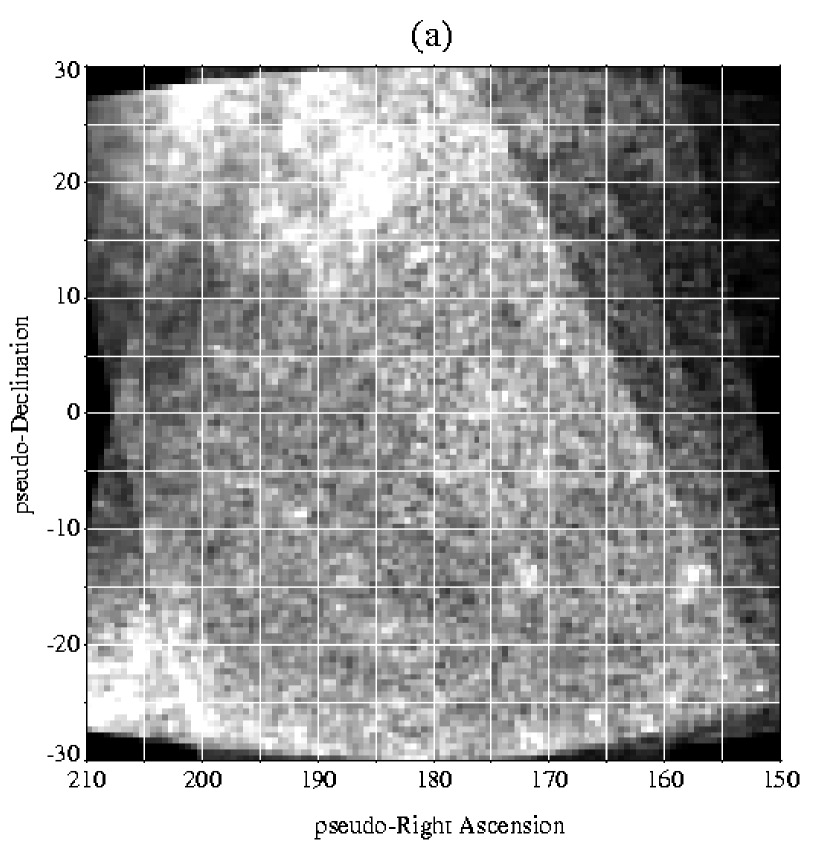
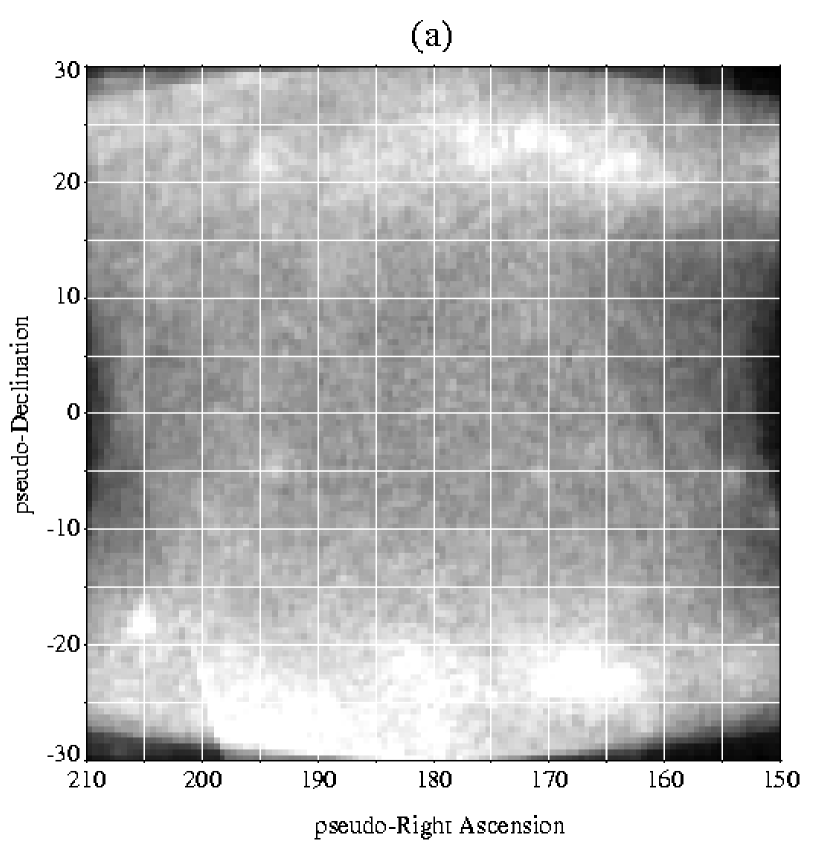
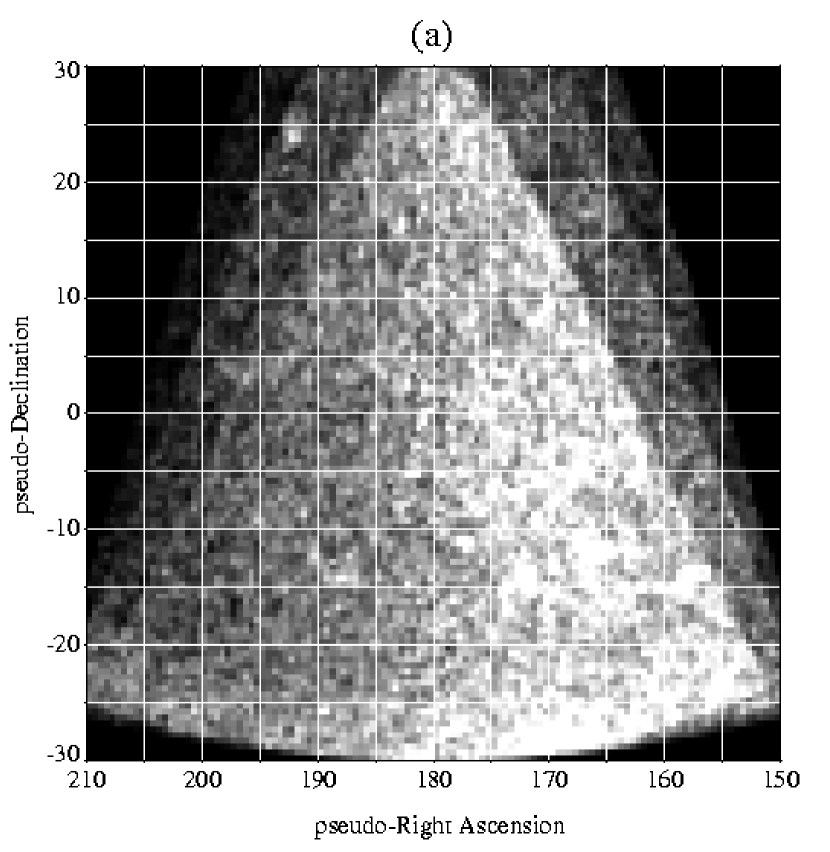
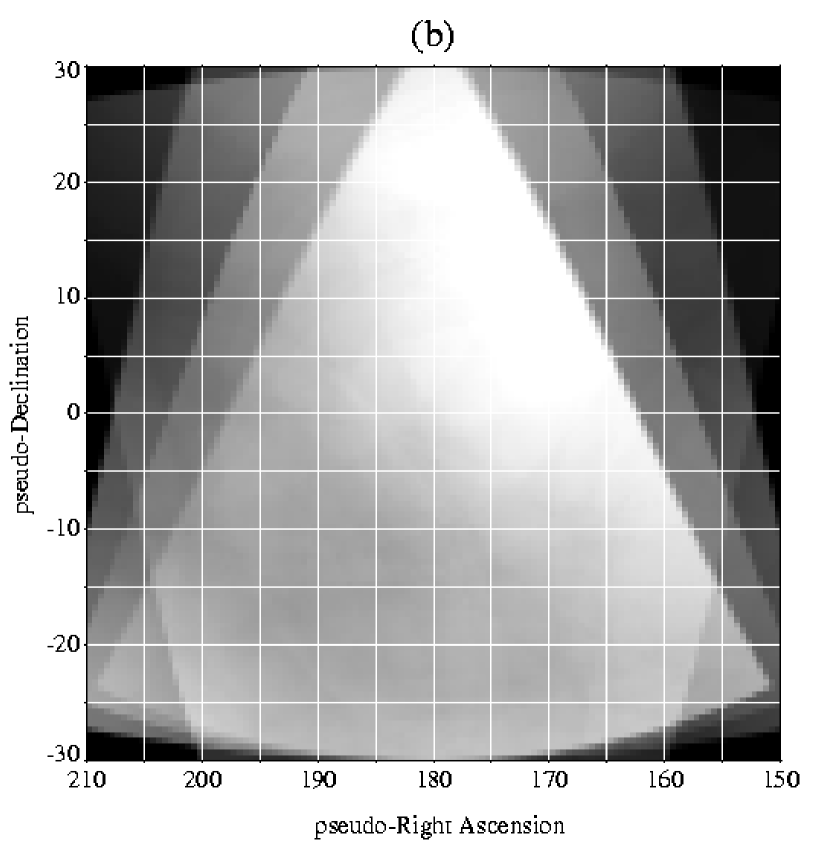
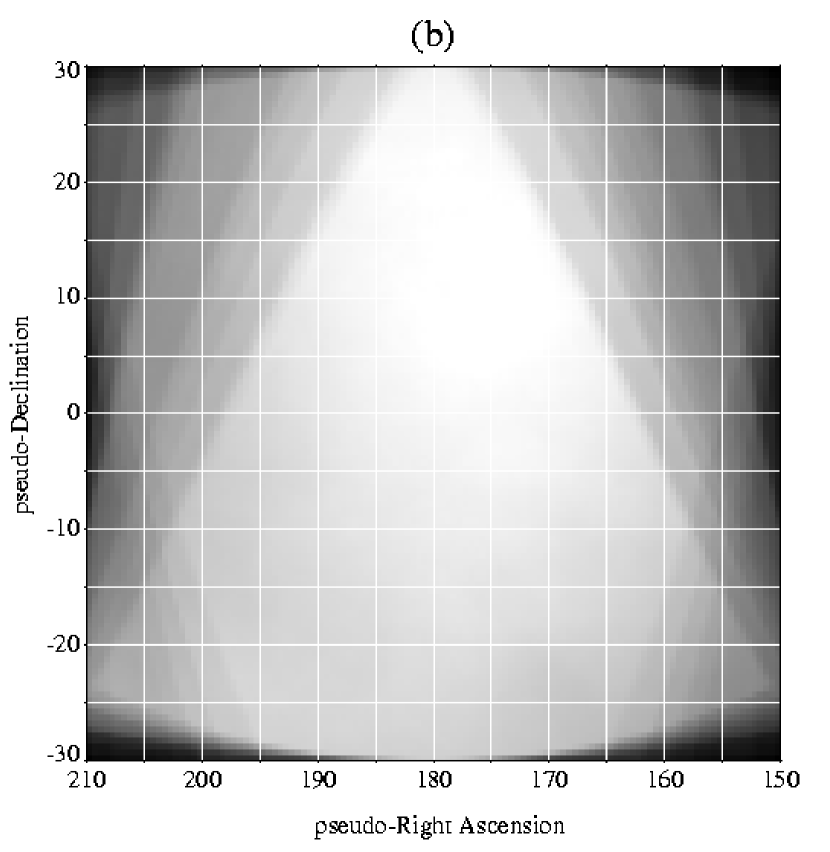
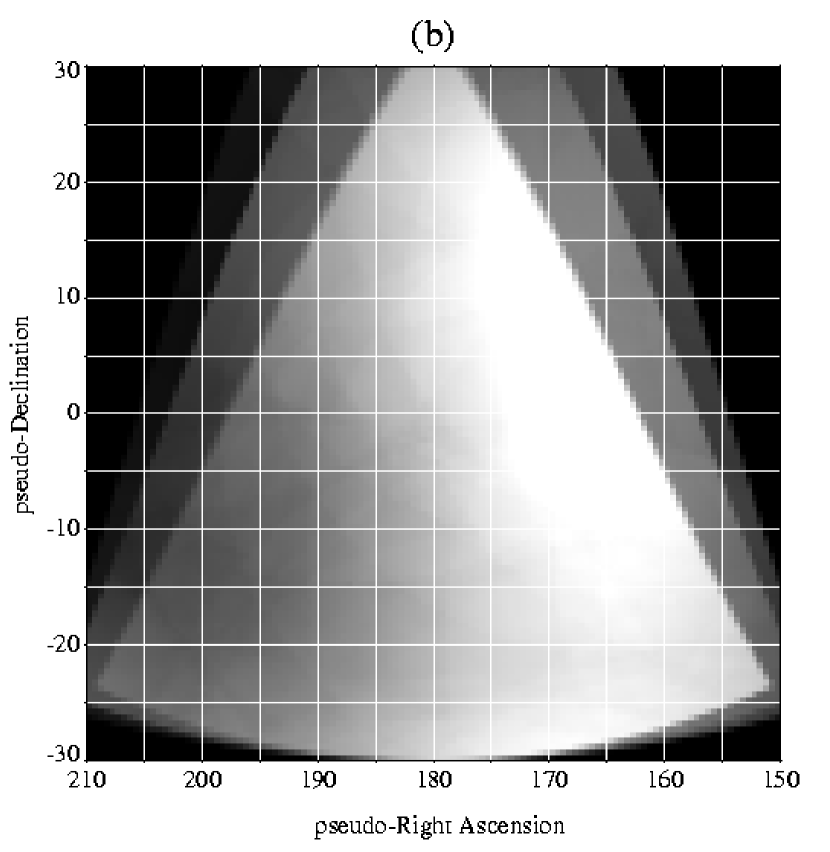
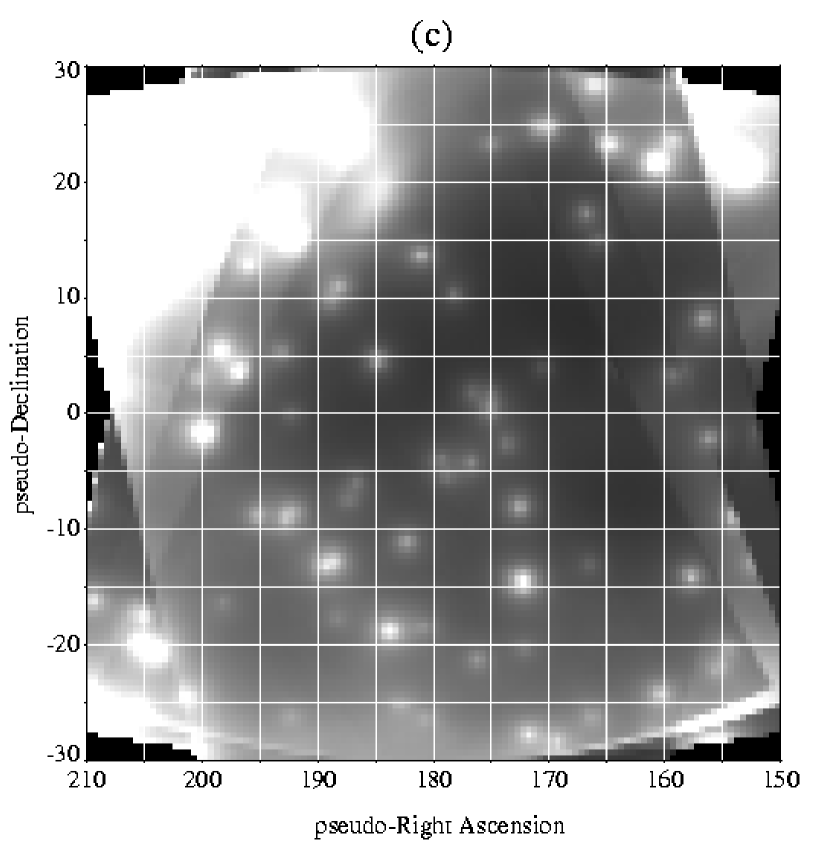
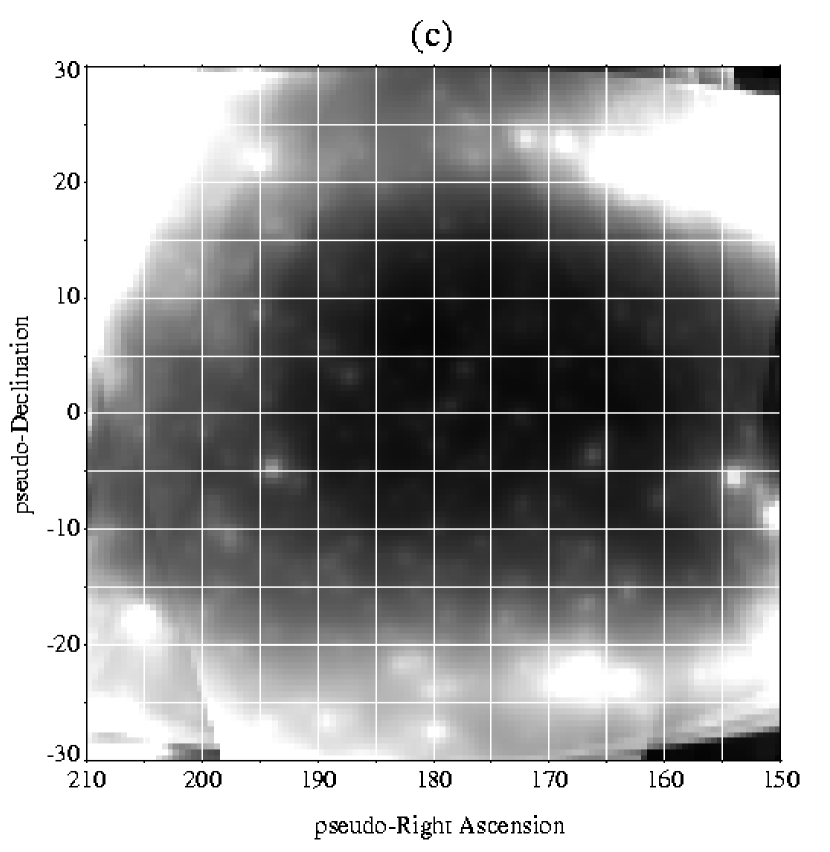
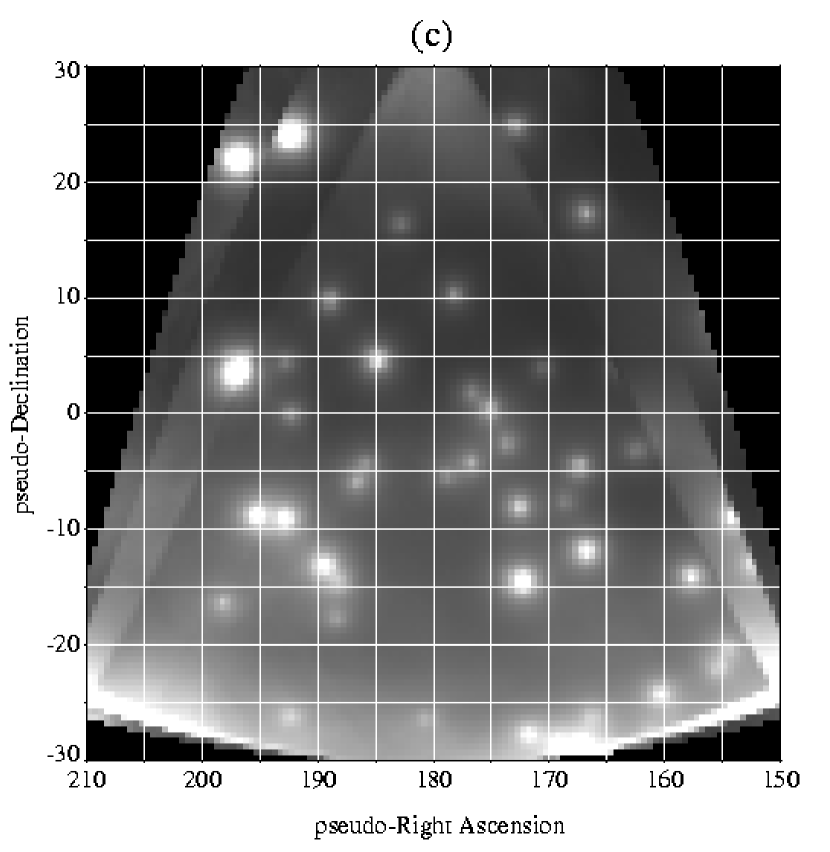
In Figure 1 we show an example of the stacked maps created (maps of counts, exposure and background). The left column corresponds to the case of the highest TS obtained (the case described in the last paragraph). The middle and right column show stacked maps for LIRGs ordered by for 54 stacked galaxies (where the TS obtained was equal to zero), and for the first four LIRGs ordered by (ARP 193, MRK 273, MRK 231, UGC 05101), where the maximum TS for the class was obtained ().
Upper limits for the fluxes for all LIRGs in the HCN survey that are located away from the Galactic plane are given in Table 3, in units of cm-2 s-1. Table 3 presents five of the sixteen energy bins where we have conducted this analysis.111These are 30-50, 50-70, 70-100,100-150, 150-300, 300-500, 500-1000, 1000-2000, 2000-4000, 4000-10000, 30-100, 100-300, 300-1000, , , MeV. None of the LIRGs we investigated have been individually detected, which is, in fact, consistent with the level of flux expected from LIRGs (i.e., fluxes above GLAST sensitivity but below the EGRET one (see, e.g., Torres 2004). The only galaxy for which a flux (not an upper limit) was determined is Arp 55. The flux for this galaxy, in the range 500 MeV–1 GeV was photons cm-2 s-1, with . This might be thought of as suggestive for a detection, although Arp 55 was not significantly detected in consequent energy intervals, and seems not to be special otherwise. Its redshift is larger than the prototypical ULIRG, and more active galaxy, Arp 220, and moreover, its ratio is smaller than that obtained for the former. Lastly, one expects statistical fluctuations when investigating a sample of more than 50 galaxies in 16 different energy bins.
4 Discussion
We have presented an stacking search for -ray emission from LIRGs and ULIRGs using data from the EGRET experiment. Our results show that these galaxies were neither individually nor collectively detected, under a variety of different sub-sampling and ranking ordering. Apart from the obvious arrangement by distance (redshifts) we have essentially explored all possible ordering parameters to investigate the preferable cases for detectability at high energy -rays. They included the ratio between line luminosities of HCN and CO; i.e., the ratio between the dense mass most plausible subject to higher enhancements of cosmic rays and the molecular mass less densely distributed as traced by CO. They also included the value of cosmic ray enhancement —computed under simplifying assumptions– that would make the galaxy detectable by the GLAST-LAT. Also, we considered the ordering using the ratio between the SFR in Milky Way units and the cosmic-ray enhancement, in the understanding that a realistic value for the latter should exceed the SFR. We have also imposed upper limits in different energy bands that can be used as a constraint for future multifrequency modelling. Even if we presently were not able to detect LIRGs and ULIRGs in high energy -rays, a suggestive excess has been found among the most active star forming regions of the sample, especially when ordered by redshift. Summarizing, LIRGs and ULIRGs, whereas not individually detected by EGRET (a result consistent with theoretical expectations) well remain a plausible candidate for GLAST and Cherenkov telescopes detections.
| NAME | l | b | G-Plane | RA | DEC | z | Mag | ||||
|---|---|---|---|---|---|---|---|---|---|---|---|
| *17208-0014 | 22.221135 | 19.353624 | YES | 260.841382 | -0.283436 | 0.04281 | 15.1 | 0.256 | 1041.23077 | 427 | 2.438479555 |
| ARP 193 | 82.928889 | 80.5998083 | NO | 200.1472625 | 34.1394972 | 0.02335 | 14.4 | 0.238 | 263.07692 | 452 | 0.582028584 |
| *MRK 273 | 108.1059064 | 59.6818904 | NO | 206.1754626 | 55.8868475 | 0.03778 | 15.07 | 0.234 | 420.92308 | 746 | 0.564240054 |
| MRK 231 | 121.6108323 | 60.2423486 | NO | 194.0593079 | 56.8736769 | 0.04217 | 14.41 | 0.226 | 515.07692 | 738 | 0.697936206 |
| *UGC 05101 | 152.476413 | 42.896978 | NO | 143.965212 | 61.353137 | 0.03939 | 15.2 | 0.197 | 276.92308 | 1057 | 0.261989669 |
| *23365+3604 | 106.99783 | -24.268484 | NO | 354.755292 | 36.352417 | 0.06448 | 16.3 | 0.176 | 415.38462 | 1743 | 0.238315904 |
| NGC 1068 | 172.1037384 | -51.9337526 | NO | 40.6696292 | -0.0132806 | 0.00379 | 9.61 | 0.174 | 99.96923 | 28 | 3.570329643 |
| *10566+2448 | 212.455124 | 64.688165 | NO | 164.825577 | 24.542855 | 0.0431 | 15.7 | 0.166 | 282.46154 | 1022 | 0.276381155 |
| NGC 6921 | 66.983282 | -7.558412 | YES | 307.12025 | 25.723417 | 0.01429 | 14.4 | 0.16 | 77.81538 | 435 | 0.178885931 |
| NGC 6240 | 20.728994 | 27.291006 | YES | 253.245375 | 2.400944 | 0.02448 | 13.8 | 0.139 | 304.61538 | 255 | 1.194570118 |
| IC 5179 | 6.502243 | -55.927177 | NO | 334.037917 | -36.843722 | 0.01141 | 12.38 | 0.129 | 94.70769 | 169 | 0.560400533 |
| *ARP 220 | 36.627128 | 53.02893 | NO | 233.737985 | 23.503187 | 0.01813 | 13.94 | 0.117 | 254.76923 | 149 | 1.709860604 |
| *05189-2524 | 227.779961 | -30.749102 | NO | 79.743025 | -25.412818 | 0.093 | 171.69231 | 906 | 0.189505861 | ||
| NGC 5135 | 311.747863 | 32.45034 | NO | 201.433583 | -29.833667 | 0.01372 | 12.88 | 0.087 | 75.6 | 179 | 0.422346369 |
| ARP 148 | 174.18998 | 63.98563 | NO | 165.97167 | 40.84917 | 0.03452 | 0.085 | 110.76923 | 914 | 0.121191718 | |
| *VIIZw31 | 133.180207 | 22.614913 | NO | 79.1935 | 79.670167 | 0.05367 | 15.8 | 0.078 | 271.38462 | 835 | 0.325011521 |
| ARP 299 | 141.898935 | 55.407582 | NO | 172.139559 | 58.563144 | 0.01041 | 11.98 | 0.072 | 58.15385 | 133 | 0.437246992 |
| NGC 2146 | 135.653411 | 24.896351 | NO | 94.657125 | 78.357028 | 0.00298 | 11.38 | 0.071 | 26.58462 | 39 | 0.681656923 |
| NGC 7130 | 9.943251 | -50.352306 | NO | 327.08125 | -34.951306 | 0.01615 | 12.98 | 0.071 | 90.55385 | 197 | 0.459664213 |
| NGC 7771 | 104.26359 | -40.573953 | NO | 357.853667 | 20.111833 | 0.01427 | 13.08 | 0.07 | 180 | 84 | 2.142857143 |
| IC 1623 | 145.196075 | -79.665042 | NO | 16.946583 | -17.507028 | 0.02007 | 0.065 | 235.38462 | 107 | 2.199856262 | |
| MRK 331 | 104.461088 | -40.124167 | NO | 357.861677 | 20.586075 | 0.01848 | 14.87 | 0.064 | 92.76923 | 228 | 0.406882588 |
| NGC 253 | 97.369238 | -87.964044 | NO | 11.888002 | -25.28822 | 0.0008 | 8.04 | 0.059 | 7.47692 | 3 | 2.492306667 |
| NGC 7469 | 83.0985253 | -45.4666436 | YES | 345.8150955 | 8.8739973 | 0.01632 | 13 | 0.059 | 60.64615 | 257 | 0.235977237 |
| NGC 3893 | 148.155029 | 65.227411 | NO | 177.159125 | 48.710833 | 0.00323 | 11.16 | 0.056 | 6.36923 | 99 | 0.064335657 |
| NGC 1365 | 237.956197 | -54.598032 | NO | 53.401548 | -36.140402 | 0.00546 | 10.32 | 0.053 | 85.84615 | 15 | 5.723076667 |
| M82 | 141.409718 | 40.566798 | NO | 148.96758 | 69.679704 | 0.00068 | 9.3 | 0.053 | 8.30769 | 4 | 2.0769225 |
| NGC 6946 | 95.718973 | 11.672974 | YES | 308.718068 | 60.153946 | 0.00016 | 9.61 | 0.053 | 13.56923 | 7 | 1.938461429 |
| NGC 5775 | 359.431609 | 52.423009 | NO | 223.489988 | 3.544458 | 0.00561 | 12.24 | 0.052 | 15.78462 | 87 | 0.181432414 |
| NGC 1614 | 204.451101 | -34.381535 | NO | 68.499394 | -8.578883 | 0.01594 | 13.63 | 0.051 | 34.61538 | 341 | 0.101511378 |
| IC 342 | 138.172575 | 10.579954 | YES | 56.702125 | 68.096111 | 0.0001 | 9.1 | 0.05 | 13.01538 | 3 | 4.33846 |
| NGC 5005 | 101.6143082 | 79.2490978 | NO | 197.7342958 | 37.0592056 | 0.00316 | 10.61 | 0.049 | 11.35385 | 50 | 0.227077 |
| NGC 1022 | 179.0179945 | -57.3715587 | NO | 39.6362718 | -6.6774286 | 0.00485 | 12.09 | 0.047 | 5.53846 | 222 | 0.024948018 |
| NGC 4945 | 305.272076 | 13.3398849 | YES | 196.3644897 | -49.4682129 | 0.00187 | 9.3 | 0.047 | 7.47692 | 5 | 1.495384 |
| 18293-3413 | 0.1481729 | -11.3073324 | YES | 278.171375 | -34.1909722 | 0.01818 | 0.047 | 111.6 | 127 | 0.878740157 | |
| NGC 695 | 140.583698 | -38.230978 | NO | 27.809342 | 22.582363 | 0.03247 | 13.84 | 0.046 | 119.07692 | 401 | 0.296949925 |
| NGC 4041 | 132.701938 | 54.047245 | NO | 180.55075 | 62.137278 | 0.00412 | 11.88 | 0.046 | 4.98462 | 174 | 0.028647241 |
| MRK 1027 | 157.758852 | -52.01998 | NO | 33.52329 | 5.173238 | 0.03022 | 0.045 | 52.33846 | 765 | 0.068416288 | |
| NGC 5678 | 100.044725 | 54.504871 | NO | 218.023208 | 57.921444 | 0.00641 | 12.13 | 0.044 | 20.76923 | 94 | 0.220949255 |
| M 83 | 314.583573 | 31.972746 | NO | 204.253833 | -29.86575 | 0.00172 | 8.2 | 0.043 | 9.69231 | 4 | 2.4230775 |
| NGC 3079 | 157.810244 | 48.359895 | NO | 150.490827 | 55.679743 | 0.00375 | 11.54 | 0.042 | 27.69231 | 23 | 1.204013478 |
| NGC 7479 | 86.270769 | -42.841757 | NO | 346.236042 | 12.322889 | 0.00794 | 11.6 | 0.042 | 31.01538 | 97 | 0.319746186 |
| NGC 6701 | 90.396653 | 24.401574 | NO | 280.801917 | 60.653333 | 0.01323 | 13.01 | 0.041 | 38.21538 | 199 | 0.192037085 |
| NGC 7331 | 93.7219374 | -20.7241007 | NO | 339.2670653 | 34.4156372 | 0.00272 | 10.35 | 0.041 | 12.18462 | 44 | 0.276923182 |
| NGC 520 | 138.705785 | -58.060572 | NO | 21.146125 | 3.792417 | 0.00761 | 0.039 | 17.72308 | 124 | 0.142928065 | |
| NGC 2276 | 127.669983 | 27.709215 | NO | 111.809833 | 85.754556 | 0.00804 | 11.93 | 0.039 | 11.07692 | 258 | 0.042933798 |
| NGC 4631 | 142.805542 | 84.223494 | NO | 190.533375 | 32.5415 | 0.00202 | 9.75 | 0.037 | 2.21538 | 60 | 0.036923 |
| NGC 660 | 141.60674 | -47.346341 | NO | 25.759792 | 13.645667 | 0.00283 | 12.02 | 0.036 | 7.2 | 56 | 0.128571429 |
| NGC 2903 | 208.711567 | 44.540153 | NO | 143.042125 | 21.500833 | 0.00186 | 9.68 | 0.036 | 2.49231 | 35 | 0.071208857 |
| NGC 4030 | 277.370075 | 59.214755 | NO | 180.0985 | -1.1 | 0.00487 | 12.01 | 0.036 | 14.95385 | 40 | 0.37384625 |
| NGC 3628 | 240.851695 | 64.780866 | NO | 170.070917 | 13.5895 | 0.00281 | 10.28 | 0.034 | 6.64615 | 17 | 0.39095 |
| NGC 4414 | 174.538951 | 83.181944 | NO | 186.612917 | 31.223528 | 0.00239 | 10.96 | 0.033 | 4.43077 | 39 | 0.113609487 |
| ARP 55 | 176.29697 | 43.9411 | NO | 138.97958 | 44.33194 | 0.0393 | 0.03 | 105.23077 | 443 | 0.237541242 | |
| NGC 4826 | 315.680884 | 84.421337 | NO | 194.182333 | 21.681083 | 0.00136 | 9.36 | 0.03 | 1.10769 | 36 | 0.030769167 |
| NGC 1055 | 171.331191 | -51.749461 | NO | 40.438458 | 0.443167 | 0.00332 | 11.4 | 0.028 | 10.24615 | 34 | 0.301357353 |
| NGC 5713 | 351.023352 | 52.123848 | NO | 220.048042 | -0.289222 | 0.00658 | 12.18 | 0.027 | 6.09231 | 149 | 0.040887987 |
| M 51 | 104.8513511 | 68.5608401 | NO | 202.4696292 | 47.1951722 | 0.00154 | 8.96 | 0.026 | 13.84615 | 10 | 1.384615 |
| NGC 1144 | 175.8754354 | -49.8886843 | NO | 43.8008169 | -0.1835573 | 0.02885 | 13.78 | 0.025 | 73.93846 | 264 | 0.280069924 |
| NGC 891 | 140.383473 | -17.413846 | YES | 35.639224 | 42.349146 | 0.00176 | 10.81 | 0.024 | 6.92308 | 20 | 0.346154 |
| NGC 828 | 139.188076 | -21.183497 | NO | 32.539875 | 39.190361 | 0.01793 | 13.15 | 0.022 | 36 | 203 | 0.177339901 |
| NGC 1530 | 135.22306 | 17.764624 | YES | 65.862917 | 75.295583 | 0.00821 | 12.25 | 0.021 | 13.56923 | 114 | 0.119028333 |
| NGC 3556 | 148.314482 | 56.251842 | NO | 167.879042 | 55.674111 | 0.00233 | 10.69 | 0.02 | 2.49231 | 52 | 0.047929038 |
| NGC 3627 | 241.96111 | 64.418688 | NO | 170.062615 | 12.991549 | 0.00243 | 9.65 | 0.017 | 2.21538 | 27 | 0.082051111 |
| NGC 3147 | 136.2899917 | 39.463239 | NO | 154.2235454 | 73.4007486 | 0.00941 | 11.43 | 0.015 | 24.92308 | 55 | 0.453146909 |
| NGC 5055 | 105.996973 | 74.28768 | NO | 198.955542 | 42.029278 | 0.00168 | 9.31 | 0.012 | 2.76923 | 13 | 0.213017692 |
Note. — The table shows some properties of the galaxies in the HCN Survey. LIGs with are highlighter in boldface and ULIGs with are further indicated by *. The column “G-Plane” indicates if the galaxy is near the Galactic Plane. In that case the galaxy (case “YES”) was excluded from consideration in our analysis.
| Subclass | Sorting Criteria | Max N. aaMaximum number of objects considered. | Max bbMaximum found. | N. Y Max ccNumber of objects yielding the maximum . |
|---|---|---|---|---|
| ALL | Distance (Mpc) | 36 | 0.7 | 18 |
| ALL | 54 | 0.4 | 6 | |
| ALL | 54 | 1.2 | 4 | |
| ALL | k-factor | 26 | 1.1 | 20 |
| ULiGs | red shift | 8 | 1.8 | 6 |
| ULiGs | 8 | 1.3 | 2 | |
| ULiGs | 8 | 0.5 | 4 | |
| 24 | 0.7 | 6 | ||
| 24 | 1.2 | 4 |
| Name | Energy range [MeV] | ||||
|---|---|---|---|---|---|
| 100-300 | 300-1000 | 100 | 300 | 1000 | |
| ARP 193 | 5 | 1 | 4 | 1 | 1 |
| MRK 273 | 4 | 1 | 3 | 1 | 0 |
| MRK 231 | 6 | 1 | 6 | 2 | 1 |
| UGC 05101 | 7 | 1 | 5 | 1 | 0 |
| 23365+3604 | 6 | 2 | 5 | 2 | 1 |
| NGC 1068 | 4 | 1 | 4 | 1 | 1 |
| 10566+2448 | 4 | 1 | 3 | 1 | 0 |
| IC 5179 | 6 | 1 | 5 | 2 | 1 |
| ARP 220 | 6 | 3 | 6 | 3 | 1 |
| 05189-2524 | 8 | 2 | 9 | 3 | 2 |
| NGC 5135 | 4 | 2 | 3 | 2 | 0 |
| ARP 148 | 3 | 1 | 3 | 1 | 0 |
| VIIZw31 | 4 | 1 | 3 | 1 | 1 |
| ARP 299 | 3 | 1 | 2 | 1 | 0 |
| NGC 2146 | 3 | 1 | 3 | 1 | 0 |
| NGC 7130 | 5 | 2 | 5 | 3 | 2 |
| NGC 7771 | 9 | 3 | 8 | 4 | 2 |
| IC 1623 | 5 | 2 | 4 | 2 | 1 |
| MRK 331 | 10 | 2 | 8 | 4 | 2 |
| NGC 253 | 6 | 1 | 8 | 2 | 2 |
| NGC 3893 | 3 | 1 | 3 | 1 | 0 |
| NGC 1365 | 5 | 1 | 5 | 2 | 1 |
| M82 | 3 | 1 | 3 | 1 | 0 |
| NGC 5775 | 9 | 2 | 5 | 2 | 1 |
| NGC 1614 | 6 | 2 | 5 | 1 | 1 |
| NGC 5005 | 5 | 1 | 4 | 1 | 1 |
| NGC 1022 | 4 | 1 | 4 | 2 | 1 |
| NGC 695 | 5 | 1 | 4 | 1 | 1 |
| NGC 4041 | 3 | 1 | 2 | 1 | 1 |
| MRK 1027 | 5 | 1 | 4 | 1 | 1 |
| NGC 5678 | 4 | 1 | 3 | 1 | 1 |
| M83 | 4 | 1 | 3 | 1 | 0 |
| NGC 3079 | 3 | 1 | 3 | 2 | 1 |
| NGC 7479 | 5 | 2 | 4 | 2 | 0 |
| NGC 6701 | 10 | 6 | 12 | 6 | 1 |
| NGC 7331 | 7 | 2 | 8 | 2 | 1 |
| NGC 2276 | 4 | 3 | 5 | 4 | 1 |
| NGC 520 | 7 | 2 | 7 | 2 | 1 |
| NGC 4631 | 3 | 1 | 3 | 1 | 0 |
| NGC 660 | 5 | 1 | 6 | 1 | 1 |
| NGC 2903 | 4 | 1 | 4 | 1 | 1 |
| NGC 4030 | 3 | 1 | 2 | 1 | 1 |
| NGC 3628 | 3 | 2 | 5 | 2 | 0 |
| NGC 4414 | 5 | 2 | 3 | 2 | 1 |
| ARP 55 | 4 | 2 | 4 | 2 | 2 |
| NGC 4826 | 4 | 1 | 4 | 1 | 0 |
| NGC 1055 | 4 | 1 | 4 | 1 | 1 |
| NGC 5713 | 5 | 1 | 4 | 1 | 0 |
| M51 | 8 | 3 | 7 | 3 | 1 |
| NGC 1144 | 4 | 1 | 4 | 2 | 2 |
| NGC 828 | 9 | 1 | 8 | 2 | 1 |
| NGC 3556 | 3 | 1 | 2 | 1 | 0 |
| NGC 3627 | 3 | 2 | 5 | 2 | 0 |
| NGC 3147 | 4 | 1 | 4 | 1 | 0 |
| NGC 5055 | 6 | 1 | 6 | 1 | 1 |
Note. — Energy values are in MeV and fluxes in units of photons cm-2 s-1.
References
- Cillis et al. (2004) Cillis A. N., Hartman R. C. & Bertsch D. L. 2004, ApJ 601, 142
- Bryant & Scoville (1999) Bryant P. M., & Scoville N. Z. 1999, ApJ 117, 2632
- Downes et al. (1993) Downes, D., Solomon, P. M., & , Radford, S. J. E. 1993, ApJ, 414, L13
- Downes & Solomon (1998) Downes, D., & Solomon, P.M. 1998, ApJ, 507, 615
- Hartman et al. (1999) Hartman R. C. et al. 1999, ApJS 123, 79
- Hunter et al. (1997) Hunter S. D. et al. 1997, ApJ 481, 205
- Mattox et al. (1996) Mattox J. R. et al. 1996, ApJ 461, 396
- Melnick & Mirabel (1990) Melnick J. & Mirabel I. F. 1990, A&A 231, L19
- (9) Gao Y. & Solomon P. M. 2004a, ApJ Suppl. 152, 63
- (10) Gao Y. & Solomon P. M. 2004b, ApJ 606, 271
- Pasquali et al. (2003) Pasquali A., Gallagher J. S., & de Grijs, R. 2003, A&A 415, 103
- Reimer et al. (2003) Reimer O., Pohl M., Sreekumar P. & Mattox J. R. 2003, ApJ 588, 155
- Sanders et al. (1988) Sanders D. B. et al. 1988, ApJ 325, 74
- Sanders & Mirabel (1996) Sanders D. B., & Mirabel I. F. 1996, ARA&A, 34, 749
- Torres et al. (2003) Torres D. F., Romero G. E., Dame T. M., Combi J. A. & Butt Y. M. 2003, Physics Reports 382, 303
- Torres (2004) Torres D. F. 2004, arXiv:astro-ph/0407240. To appear in ApJ.
- Torres et al. (2004) Torres D. F., Reimer O., Domingo-Santamaría E. & Digel S. 2004, ApJ 607, L99