Hubble Advanced Camera for Surveys Observations of the Quasar \qso: A Leak in the Gunn-Peterson Trough11affiliation: Based on observations obtained with the NASA/ESA Hubble Space Telescope (HST). HST is operated by the Association of Universities for Research in Astronomy, Inc. (AURA) under NASA contract NAS5-26555.
Abstract
The Hubble Advanced Camera for Surveys has been used to obtain a narrow-band image of the weak emission peak seen at Å in the Gunn-Peterson Ly absorption trough of the highest redshift quasar, \qso. The emission looks perfectly point-like; there is no evidence for the intervening galaxy that we previously suggested might be contaminating the quasar spectrum. We derive a more accurate astrometric position for the quasar in the two filters and see no indication of gravitational lensing. We conclude that the light in the Ly trough is leaking through two unusually transparent, overlapping windows in the IGM absorption, one in the Ly forest at and one in the Ly forest at .
If there are significant optical depth variations on velocity scales small compared with our spectral resolution ( km/s), the Ly trough becomes more transparent for a given Ly optical depth. Such variations can only strengthen our conclusion that the fraction of neutral hydrogen in the IGM increases dramatically at . We argue that the transmission in the Ly trough is not only a more sensitive measure of the neutral fraction than is Ly, it also provides a less biased estimator of the neutral hydrogen fraction than does the Ly transmission.
1 Introduction
The epoch of reionization of intergalactic hydrogen is a key cosmological observable that constrains the star and galaxy formation history of the universe. Clues to the ionization state of the intergalactic medium (IGM) come from two principal sources: cosmic microwave background (CMB) polarization measurements, which are sensitive to the integrated electron scattering optical depth from to , and studies of hydrogen absorption in the spectra of quasars and galaxies, which can detect neutral gas along the line of sight at .
The situation is currently somewhat muddled. The CMB measurements from the first year of Wilkinson Microwave Anisotropy Probe (WMAP) observations indicate that the IGM may already have been ionized at (Kogut et al. 2003). Quasar spectra show evidence for a sharp increase in the Ly absorption at , leading to the suggestion that reionization occurred near that time (Becker et al. 2001; Fan et al. 2002, 2003, 2004; White, Becker, Fan & Strauss 2003; but see Songaila 2004 for an opposing view). Wyithe & Loeb (2004) and Mesinger & Haiman (2004) conclude from the extragalactic H II regions around these quasars that the IGM is indeed close to neutral. On the other hand, the mere detection of Ly-emitting galaxies at higher redshifts is argued to be inconsistent with the IGM having a significant neutral fraction at (Rhoads et al. 2004; Stern et al. 2004; Malhotra & Rhoads 2004).
Theoretical work has shown that the WMAP and quasar results are not necessarily contradictory because they are sensitive to rather different physical regimes (Gnedin 2004). The black Gunn-Peterson (1965) Ly absorption troughs in quasar spectra can be produced by a small fraction () of neutral hydrogen, while the CMB polarization can be attributed either to an interval at high redshift when the universe was ionized followed by another recombination, or to a more recent reionization that persisted to the present day (see Fig. 7 of Gnedin 2004.) There are also theoretical reasons to believe that the ionization history of the universe could have been complex, with multiple periods of ionization and recombination (Wyithe & Loeb 2003, Cen 2003). Recent studies indicate that even a completely neutral IGM would not necessarily suppress Ly emission from galaxies at (Haiman 2002, Santos 2004, Gnedin & Prada 2004), especially when such uncertain effects as galactic winds, clustering of star-forming galaxies, and radiative transfer in the scattered Ly radiation are included. We need better observations to distinguish among the many possibilities.
Our understanding of quasar absorption at is based on only a handful of quasars, so cosmic variance along the different lines of sight is clearly a concern. There are just four quasars known with redshifts beyond 6.2, all discovered using the Sloan Digital Sky Survey (Fan et al. 2004), and one of those has intrinsic broad absorption lines that make it unsuitable for studies of the intervening Ly absorption. White et al. (2003) presented high resolution, high signal-to-noise ratio Keck spectra of the two highest redshift quasars, SDSSp J103027.10052455.0 (, hereafter SDSS J10300524) and SDSS J114816.64525150.3 (, hereafter \qso). SDSS J10300524 shows black hydrogen absorption with no indication of any residual quasar light in either the Ly or Ly troughs over the redshift range , which sets strong limits on , the Ly optical depth derived from the mean transmission. This spectrum has been analyzed by several different groups (e.g., Mesinger & Haiman 2004) and is the strongest evidence that the IGM is becoming neutral at .
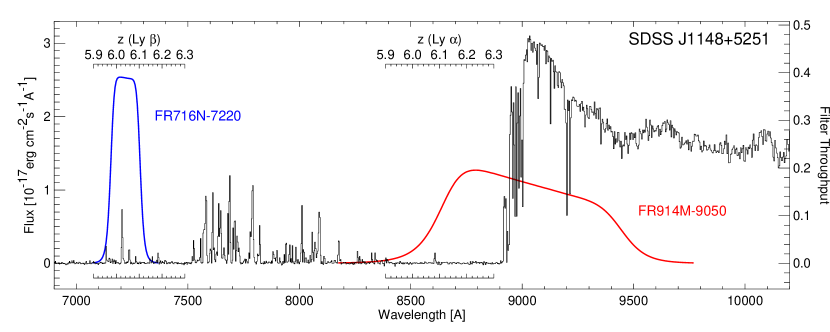
The spectrum of \qso also shows deep Ly and Ly absorption but differs from SDSS J10300524 in that the absorption troughs are not completely black (Fig. 1). There is a weak peak at that is seen in both Ly and Ly and is likely due to an ionized bubble along the line-of-sight that produces a “leak” in the IGM absorption (White et al. 2003). There are also several stronger emission peaks in the Ly trough without associated Ly peaks, with the strongest at 7205 Å. The straightforward interpretation of these peaks as due to transparent Ly windows in the IGM faces some serious problems, however (discussed further in §4.) Consequently, White et al. suggested that these features might be Ly emission at from an intervening galaxy; the presence of strong C IV absorption at the same redshift provided some support for this suggestion. The implausibility of finding such a galaxy along the line-of-sight by chance would be reduced if the intervening object is lensing the quasar. The uncertainty about the nature of the residual light in the Ly and Ly troughs of \qso called into question its use for studying the ionization state of the IGM at .
In this paper, we report Hubble Space Telescope (HST) Advanced Camera for Surveys (ACS) observations of the quasar \qso using a narrow filter in the Ly trough centered on the 7205 Å peak. These ACS images discriminate between the two hypotheses by allowing us to look directly for evidence that the emission comes from an intervening galaxy and to check for any signs that the quasar is gravitationally lensed. The observations are described in §2, and §3 discusses the analysis. The results and their implications for this object and for the IGM ionization are dicussed in §4.
2 Observations
Images of \qso were obtained with the ACS Wide Field Camera (WFC) on 2003 October 25. Two ramp filters were used: a narrow band covering the emission peak at 7205 Å (FR716N-7220, 4256 s exposure time) and a broader band located on the quasar’s Ly emission line (FR914M-9050, 720 s). We briefly refer to these filters as F720N and F905M in the following. Figure 1 shows the location of the filter bandpasses with respect to the quasar’s spectral features. About 60% of the F720N counts come from the narrow feature at 7205 Å, with most of the remainder coming from the weaker features nearby. The short-exposure F905M image is used to determine accurately the position and morphology of the quasar for comparison with the F720N detection.
Note that the field of view in the ACS ramp filters is limited to about arcsec. The filter strip is narrow, covering only about a third of the ACS field of view, and the ramp central wavelength changes along the length of the filter so that different parts of the image are being observed at different wavelengths. This does complicate the data analysis, but the limited field does not interfere with our science goals.
The images have been processed using the ACS Science Team’s APSIS pipeline (Blakeslee et al. 2003), which aligns the images, corrects the astrometry to the GSC-2 coordinate system, produces combined drizzled images on the same output pixel grid for the two filters, and runs SExtractor (Bertin & Arnouts 1996) to identify sources in a detection image created by combining the two filter images. We have augmented the processing using a custom cosmic-ray (CR) rejection algorithm that is optimized for the case of only two CR rejection images. The algorithm recognizes instances where cosmic rays hit the same pixel in both images and flags both as bad. The observations included two CR-split exposures at each of two different dither positions for F720N and a single exposure at the two dither positions for F905M.
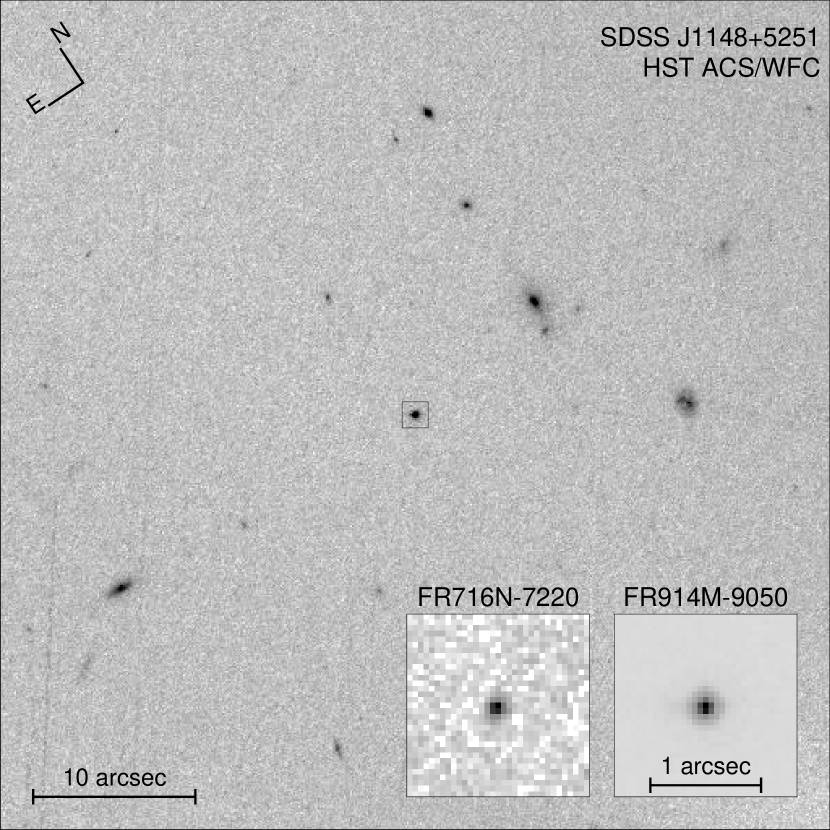
Figure 2 shows the resulting ACS images. The large image is the detection image while the insets show the quasar in the two filters. The detection image is dominated by the long-exposure F720N image except for the quasar, which is much brighter in the F905M image. The count rate for the quasar is 0.83 counts/s in F720N and 54.5 counts/s in F905M.
An inspection reveals no indication that either the F720N or F905M image is resolved, nor is there a significant shift between them. We quantify this statement in the next section, but our basic conclusion is that the 7205 Å emission peak is perfectly consistent with quasar light leaking through a transparent window in the Ly and Ly IGM absorption.
3 Analysis
Our principal goal in acquiring these observations was to determine the nature of the emission seen in the Ly absorption trough at 7200 Å. We therefore focus on determining whether the emission is extended (as expected for an intervening galaxy) or point-like (as expected for quasar light) and whether there is any indication of an astrometric shift between the two images (which would be expected if the quasar were gravitationally lensed.) We also determine accurate absolute astrometry for the quasar using nearby SDSS objects as references.
3.1 Size Limits
An upper limit on the size of the F720N image was determined by fitting a monochromatic 7205 Å Tiny Tim (Krist 1995) point-spread function (PSF) to the F720N quasar image. The simulated PSF was subsampled to allow an accurate sub-pixel position match. The fitting was performed on the flat-fielded image rather than the drizzled image to avoid possible problems with the drizzled PSF and to incorporate the best possible knowledge of the noise characteristics of the data. (Fits to the drizzled image gave similar results.)
The data are fitted very well by the PSF plus sky; the reduced for a pixel region () around the quasar is less than unity. To determine the size limit, the PSF was blurred with a Gaussian. When the Gaussian width is too large, it is no longer possible to get a good fit as determined by the value. The 90% confidence upper limit on the source size is a FWHM of 0.059 arcsec, and the 99% confidence limit is 0.067 arcsec.
For comparison, galaxies at typically have half-light diameters of 0.5 arcsec, and are almost never seen to have diameters smaller than 0.2 arcsec (Ferguson et al. 2004). Our 99% confidence size limit is far smaller than would be expected for an intervening galaxy.
While we can confidently conclude that most of the light in F720N does not come from a galaxy, we cannot rule out the possibility that a small fraction of the light is extended. Fitting the sum of a point source and a 0.5 arcsec FWHM Gaussian reveals that even a galaxy with 30% of the total flux would not be detectable. The 90% confidence upper limit on the fraction of light contributed by a galaxy is 0.46. That corresponds to a continuum level of . The best limit on residual continuum emission from an intervening galaxy probably comes from the spectrum itself and is about .
3.2 Relative Astrometry
The relative astrometric alignment of the two filter images was established by comparing positions for all common sources in the field of view. We fitted Tiny Tim PSFs to the drizzled images to determine the quasar position in each filter. (In this case we used the drizzled images because we needed to correct for the ACS distortion.) The measured quasar positions differ by only 0.22 pixels (0.011 arcsec). This is very similar to the rms for the objects matched to align the images. We conclude that the images in the two filters have positions that agree to better than 0.02 arcsec.
Note that if a lensing galaxy produced some of the light being detected in the F720N filter, we would expect to see some apparent shift between the positions because the apparent lensed quasar position would be shifted away from the galaxy center, and the galaxy would be far more prominent in the F720N filter. There is no hint of any such effect. Richards et al. (2004) also found no evidence for lensing in HST ACS images of four other high-redshift quasars.
3.3 Absolute Astrometry
We corrected the absolute astrometry of the HST images by matching our SExtractor catalog with the SDSS DR3 photometric catalog (Abazajian et al. 2004) and measuring the mean shift between them. We excluded the quasar itself from this matched list to avoid biases. There are 29 ACS/SDSS matches within 50 arcsec of the quasar. We searched for matches with separations as large as 2 arcsec, but all the SDSS sources found fell within 0.6 arcsec of the (APSIS-corrected) ACS positions. We conclude that all the matches are reliable associations.
The coordinate offsets in RA and Dec were estimated using both mean and median statistics, with essentially identical results. Both RA and Dec offsets are accurate to 0.03 arcsec, which is our remaining systematic error compared with the local SDSS coordinate system. Of course, this does not mean that our absolute astrometry is that good, but the astrometric accuracy for the quasar position is about 0.1 arcsec, the limit set by the SDSS reference frame (Pier et al. 2003).
The corrected position for the quasar \qso is , (J2000) with uncertainties of 0.003 s in RA and 0.03 arcsec in Dec. This differs by 0.13 arcsec from the quasar position given in the DR3 source catalog. Note that the extreme colors of this object (it is detected only in the z-band longward of 9000 Å) introduce significant differential refraction in the ground-based SDSS images, which reduces the accuracy of the SDSS astrometry. Differential refraction is of course not an issue for HST observations.
This improved position is most valuable in comparing to observations at other wavelengths. Walter et al. (2004) resolved the CO emission associated with \qso into two components. The CO positions are accurate, but the SDSS position falls between the components with uncertainties that overlap both. Walter et al. speculated that the quasar should be aligned with their southern component based on the overall symmetry of the source. Our improved position confirms that, with the quasar position falling exactly on top of the southern CO component.
4 Discussion
Our conclusion from the ACS images is that there is no evidence for a galaxy along the line-of-sight to \qso. The emission peak detected in the Gunn-Peterson Ly trough at 7205 Å is light from the quasar that is leaking through transparent regions in the IGM.
We recognize that our arguments for an intervening galaxy were met with some (apparently well deserved) skepticism among our readers111And even among the coauthors of this paper.. But the superficially more plausible explanation that the light is coming from the quasar actually faces some serious difficulties that were discussed in White et al. (2003).
The principal difficulty is the absence of Ly emission associated with the 7205 Å Ly emission peak. The Ly emission would be seen at 8539 Å but is completely absent (see Fig. 5 in White et al.) The optical depth in Ly is smaller than Ly, so it is expected to have more light leak through the Ly forest. However, the Ly trough also suffers from overlying Ly forest absorption, which reduces the incidence of Ly-only emission. And transparent Ly windows are always expected to have associated Ly peaks.
The combined optical depth222Here we adopt for the quasar, as derived by Willott, McLure & Jarvis (2003) and confirmed by the CO observations of Bertoldi et al. (2003). We also use a ratio , correcting the 15% error pointed out by Songaila (2004). The effect of these changes on the computed optical depths is small. at 7205 Å is . The absence of any Ly emission at 8539 Å implies a lower limit , corresponding to . We conclude that .
As White et al. point out, there are very few windows in the Ly forest with such low optical depths. The probability that a randomly selected wavelength near 7200 Å will fall in such a window is only about 1%. That is the fundamental problem: the strong peak in the Ly trough requires the alignment of two unusually transparent windows, one in the Ly forest and one in the Ly forest. However improbable it appears, this is the only explanation we see for the observed spectrum.
Here we are using the approach criticized by Songaila (2004), simply scaling the measured and values by the ratio of the transition strengths. This does in fact overestimate the ratio when there is a distribution of optical depths within a flux resolution element. However, the effect discussed by Songaila always reduces the Ly optical depths, so a simple scaling of gives a conservative lower limit to the true optical depth. Suppose that the true Ly optical depth in some region has a distribution , normalized such that . Then the observed mean optical depths in Ly and Ly are:
| (1) |
and
| (2) |
where is the nominal ratio between the Ly and Ly optical depths.
The exact value of the optical depth ratio depends on the distribution , which has been explored using physical models of the gas density distribution and ionization balance (Fan et al. 2002, Lidz et al. 2002, Cen & McDonald 2002, and references therein). For this paper we prefer to keep the equation in terms of the optical depth distribution rather rely on a more complicated physical model of the IGM to clarify the connections to directly observable quantities. A simple example illustrates the size of the effect. If is a Gaussian with mean and width ,
| (3) |
where is the scaled complementary error function,
| (4) |
When ,
| (5) |
The equation for is identical but with and replaced by and , respectively.
The optical depth distribution effect explains the overall ratio of the mean transmissions observed in the Ly and Ly Gunn-Peterson troughs for \qso. Using the spectrum in Figure 1 (White et al. 2003), the mean optical depth in the Ly trough () is while the mean in the Ly trough is , which is smaller by a factor of three than might be expected from the optical depth ratio . (Note that in both absorption troughs in \qso we detect residual light, whereas in SDSS J10300524 we measure only an upper limit to the IGM transmission.) The transparency of the Ly trough is due to the optical depth distribution in the trough. If we apply the Gaussian model (eqn. 3) we find and . Of course the Gaussian model used for this analysis is not particularly realistic, but the results will be similar for other models.
In this case the ratio is 0.48, which is (as demanded by the observations) indeed three times larger than . But the change is almost entirely the result of a reduction in the effective compared with the true mean optical depth . This effect is easy to understand: begins to saturate when the high optical depth regions effectively transmit no light, and the mean transmission becomes dominated by light in low opacity regions.
This is an important point: an optical depth distribution makes the IGM more transparent in the Ly absorption trough. As the Ly optical depth rises with increasing redshift, this effect tends to flatten the slope. However, we find that increases more steeply with starting at ; correcting for the effect makes this change even more dramatic. The inclusion of this effect thus strengthens the evidence for a significant increase in the neutral hydrogen fraction beyond redshift 6. This is inconsistent with Songaila’s (2004) conclusion that the inclusion of an optical depth distribution weakens the argument for an abrupt change in the ionization level at .
Another way of stating this conclusion is that is actually a less biased estimator of the mean neutral hydrogen fraction (the physical quantity of interest) than is . The interpretation of the observed Ly transmission is far less reliant on the details of than is the interpretation of the Ly transmission. Small changes in at can have a large effect on , but is sensitive only to changes integrated over the much larger range . The observed optical depths increase very dramatically with redshift for the known quasars (White et al. 2003; Fan et al. 2004). We interpret this as powerful direct evidence in favor of a rapid increase in the hydrogen neutral fraction at those redshifts.
Returning to the question of the 7205 Å emission in the Ly trough of \qso, it is clear that that the effect makes the absence of an associated Ly peak even more difficult to understand because it increases the strength expected for the Ly peak. For example, the specific Gaussian described above () is marginally consistent with the absence of Ly at 8539 Å only if there is practically no Ly forest absorption at all, . It is possible to rule out distributions with stronger tails near . The properties of this system can consequently put limits on the permitted optical depth distribution at velocity resolutions finer than those directly observed.
Perhaps in this quasar the IGM is very transparent in Ly yet opaque in Ly because the damping wings of the (roughly) neutral gas on either side are optically thick in Ly but not in Ly. If the presence or absence of damping wings can be shown to play a crucial role in interpreting the Ly “leaks” in this system, then we may be able to strengthen the case for (or against) a substantial neutral hydrogen fraction in the IGM at .
There is at least one satisfying aspect of this “two window” model for the 7205 Å peak. A plausible way to create a transparent region in the Ly forest is for a star-forming galaxy close to the line of sight at to ionize a bubble in the Ly forest. The halo of that same galaxy probably hosts the gas cloud that produces the strong C IV absorption doublet seen at 9200 Å (, White et al. 2003). Note that our observations do not rule out a faint galaxy roughly coincident with the quasar (§3.1) even though the light in the 7205 Å emission peak certainly comes from the quasar and not a galaxy. The angular scale at is kpc/arcsec (using the WMAP cosmology), so the galaxy need not lie too close to the line of sight to the quasar. A single unusual object along the line of sight can thus explain both the hole in the Ly forest absorption and the strong high-ionization metal absorption.
Finally, since the Ly and Ly troughs of \qso do show a low level of detectable light (which is perhaps still slightly contaminated by the galaxy), this spectrum is worthy of additional detailed physical modeling as has been applied to SDSS J10300524. And given the apparently unusual characteristics of this line of sight, additional high redshift quasars sampling the IGM absorption in other directions would of course be of great value.
References
- Abazajian et al. (2004) Abazajian, K., et al. 2004, ArXiv Astrophysics e-prints, astro-ph/0410239
- Becker et al. (2001) Becker, R. H. et al. 2001, AJ, 122, 2850
- Bertin & Arnouts (1996) Bertin, E. & Arnouts, S. 1996, A&AS, 117, 393
- Bertoldi et al. (2003) Bertoldi, F., et al. 2003, A&A, 409, L47
- Blakeslee et al. (2003) Blakeslee, J. P., Anderson, K. R., Meurer, G. R., Benítez, N., & Magee, D. 2003, ASP Conf. Ser. 295: Astronomical Data Analysis Software and Systems XII, 12, 257
- Cen & McDonald (2002) Cen, R. & McDonald, P. 2002, ApJ, 570, 457
- Cen (2003) Cen, R. 2003, ApJ, 591, 12
- Fan et al. (2002) Fan, X., Narayanan, V. K., Strauss, M. A., White, R. L., Becker, R. H., Pentericci, L., & Rix, H. 2002, AJ, 123, 1247
- Fan et al. (2003) Fan, X., et al. 2003, AJ, 125, 1649
- Fan et al. (2004) Fan, X., et al. 2004, AJ, 128, 515
- Ferguson et al. (2004) Ferguson, H. C., et al. 2004, ApJ, 600, L107
- Gnedin (2004) Gnedin, N. Y. 2004, ApJ, 610, 9
- Gnedin & Prada (2004) Gnedin, N. Y. & Prada, F. 2004, ApJ, 608, L77
- Gunn & Peterson (1965) Gunn, J. E. & Peterson, B. A. 1965, ApJ, 142, 1633
- Haiman (2002) Haiman, Z. 2002, ApJ, 576, L1
- Kogut et al. (2003) Kogut, A., Spergel, D. N., Barnes, C., Bennett, C. L., Halpern, M., Hinshaw, G., Jarosik, N., Limon, M., Meyer, S. S., Page, L., Tucker, G. S., Wollack, E., & Wright, E. L. 2003, ApJS, 148, 161
- Krist (1995) Krist, J. 1995, ASP Conf. Ser. 77: Astronomical Data Analysis Software and Systems IV, 4, 349
- Lidz, Hui, Zaldarriaga, & Scoccimarro (2002) Lidz, A., Hui, L., Zaldarriaga, M., & Scoccimarro, R. 2002, ApJ, 579, 491
- Malhotra & Rhoads (2004) Malhotra, S. & Rhoads, J. 2004, ArXiv Astrophysics e-prints, astro-ph/0407408
- Mesinger & Haiman (2004) Mesinger, A. & Haiman, Z. 2004, ApJ, 611, L69
- Pier et al. (2003) Pier, J. R., Munn, J. A., Hindsley, R. B., Hennessy, G. S., Kent, S. M., Lupton, R. H., & Ivezić, Ž. 2003, AJ, 125, 1559
- Rhoads et al. (2004) Rhoads, J. E., et al. 2004, ApJ, 611, 59
- Richards et al. (2004) Richards, G. T., et al. 2004, AJ, 127, 1305
- Santos (2004) Santos, M. R. 2004, MNRAS, 349, 1137
- Songaila (2004) Songaila, A. 2004, AJ, 127, 2598
- Stern et al. (2004) Stern, D., Yost, S. A., Eckart, M. E., Harrison, F. A., Helfand, D. J., Djorgovski, S. G., Malhotra, S., & Rhoads, J. E. 2004, ArXiv Astrophysics e-prints, astro-ph/0407409
- Walter et al. (2004) Walter, F., Carilli, C., Bertoldi, F., Menten, K., Cox, P., Lo, K. Y., Fan, X., & Strauss, M. A. 2004, ApJ, 615, L17
- White, Becker, Fan, & Strauss (2003) White, R. L., Becker, R. H., Fan, X., & Strauss, M. A. 2003, AJ, 126, 1
- Willott, McLure, & Jarvis (2003) Willott, C. J., McLure, R. J., & Jarvis, M. J. 2003, ApJ, 587, L15
- Wyithe & Loeb (2003) Wyithe, J. S. B. & Loeb, A. 2003, ApJ, 586, 693
- Wyithe & Loeb (2004) Wyithe, J. S. B. & Loeb, A. 2004, Nature, 427, 815