An infrared study of galactic OH/IR stars. I.
An
optical/near-IR atlas of the Arecibo sample††thanks: Based on
observations collected at the German-Spanish Astronomical Centre,
Calar Alto, operated jointly by Max-Planck-Institut füer Astronomie
and Instituto de Astrofísica de Andalucía (CSIC).,
††thanks: Tables A1 and A2 are only available in electronic form at the
CDS via anonymous ftp to cdsarc.u-strasbg.fr (130.79.128.5) or via
http://cdsweb.u-strasbg.fr/cgi-bin/qcat?J/A+A/,††thanks: The
complete atlas can be accessed electronically at:
http://www.edpsciences.org/aa
In this paper we present optical and near-infrared finding charts, accurate astrometry ( 1″) and single-epoch near-infrared photometry for 371 IRAS sources, 96% of those included in the so-called ‘Arecibo sample of OH/IR stars’ (Eder et al. Eder88 (1988); Lewis et al. 1990a ; Chengalur et al. Chengalur93 (1993)). The main photometric properties of the stars in the sample are presented and discussed as well as the problems found during the process of identification of the optical/near-infrared counterparts. In addition, we also identify suitable reference stars in each field to be used for differential photometry purposes in the future.
We find that 39% of the sources (144 in number) have no optical counterpart, 8 of them being invisible even at near infrared wavelengths. The relative distribution of sources with and without optical counterpart in the IRAS two-colour diagram and their characteristic near infrared colours are interpreted as the consequence of the increasing thickness of their circumstellar shells. Among the objects not detected at near infrared wavelengths four non-variable sources are proposed to be heavily obscured post-AGB stars which have just very recently left the AGB. Eight additional objects with unusually bright and/or blue near-infrared colours are identified as candidate post-AGB stars and/or proto-planetary nebulae.
Key Words.:
Stars: OH/IR – Stars: AGB and post-AGB – Stars: circumstellar matter – Stars: variable – Stars: evolution – Infrared: stars1 Introduction
Stars with masses between 0.8 and 8 M⊙ pass along the Asymptotic Giant Branch (AGB) towards the end of their evolution. Approaching the tip of the AGB they start to pulsate and appear as large-amplitude ( 0.4m at K-band) long-period ( 80 days) variables. The pulsation is accompanied by heavy mass loss which forms a circumstellar envelope of gas and dust. If the mass loss rate surpasses 10-6 M⊙year-1 the dust shell eventually becomes opaque to visible light (Habing Habing96 (1996)).
Stellar evolution models predict that stars close to the tip of the AGB experience thermal pulses (the so-called ‘TP-AGB’) leading to variations in luminosity and mass loss rates on timescales of several ten thousand years. In addition, they may change their photospheric chemistry from oxygen- to carbon-rich. The determination of the current evolutionary state of a particular AGB star is difficult because of the strong variability and the increasing obscuration which limits our observational capabilities. Moreover, their pulsation on timescales of 1 – 5 years usually requires long observational monitoring programs to determine representative parameters. Hence, well defined AGB star samples, observed over an adequate long period of time, are required to test current evolutionary models of this short-lived phase of stellar evolution.
Available samples of AGB stars are in many cases biased. Depending on whether the selection is made at optical/near-infrared wavelengths or in the far-infrared the samples under analysis contain a larger number of low-mass or high-mass AGB stars, respectively. Low-mass progenitors are expected to experience only moderate mass loss during their AGB lifetimes and, thus they will be detected preferentially in the optical and near-infrared. An example is the ‘dust-enshrouded AGB sample’ of Jura & Kleinmann (Jura89 (1989)), which contains stars with typical main-sequence masses MMS 1.3 M⊙ (Olivier et al. Olivier01 (2001)). In contrast, AGB stars descending from progenitors with larger main-sequence masses (MMS 2 M⊙) probably spend a larger fraction of their TP-AGB life in an obscured state. This is a consequence of the higher mass loss rates, which favours their detection in the far-infrared. Less biased AGB samples covering the complete TP-AGB and all kinds of chemistries should therefore include these far-infrared sources, something which is possible only since the infrared survey by the IRAS satellite was completed (Beichman et al. Beichman88 (1988)).
Samples of oxygen-rich AGB stars (‘OH/IR stars’) can be constructed using surveys of OH maser emission. In such surveys AGB stars are easily picked up because of their conspicuous double-peaked maser profile. However, these samples are also incomplete, as only part of the oxygen-rich AGB stars exhibit OH maser emission (Lewis & Engels Lewis95 (1995)). Monitoring of early samples (e.g. Baud et al. Baud81 (1981)) revealed either very long periods or rather weak variations (Engels et al. Engels83 (1983); Herman & Habing Herman85 (1985)). These OH/IR stars were considered as massive AGB stars (MMS = 3 – 8 M⊙ on the main sequence), with the long-period variables shortly before and the non-variables probably shortly after the departure from the AGB. From the analysis of ISO data of galactic AGB and post-AGB stars, García-Lario & Perea-Calderón (Garcia-Lario04 (2004)) have recently postulated the existence of three different chemical branches of AGB stars, depending on their progenitor mass: (i) low-mass oxygen-rich stars; (ii) intermediate-mass carbon-rich stars; and (iii) high-mass O-rich stars, where ‘hot bottom burning’ is active at the base of the convective envelope, preventing the formation of carbon (instead, the production of nitrogen is favoured). It is however not yet settled if low-mass oxygen-rich AGB stars evolve into the large mass loss regime observed in high-mass oxygen-rich AGB stars, and if so, how long they stay in this regime. It is therefore not clear what fraction of low-mass stars is present in OH/IR star samples. Actually, the relation between AGB star samples selected in different wavelength ranges remains to be explored.

A well-defined sample of far-infrared-selected oxygen-rich AGB stars is provided by the Arecibo survey of OH/IR stars (Eder et al. Eder88 (1988); Lewis et al. 1990a ; Chengalur et al. Chengalur93 (1993)). It consists of 390 IRAS sources, which were detected in the 1612 MHz OH maser line with the Arecibo radio telescope. The sample was obtained from a complete survey of IRAS sources with flux densities 2 Jy at 25 m, with declination 0° 37° and appropriate colours of AGB stars (Olnon et al. Olnon84 (1984)). The OH maser detection qualifies the IRAS source as an oxygen-rich AGB star. The positions of the sources in the IRAS two-colour diagram are shown in Fig. 1, together with a solid line which corresponds to the sequence of colours predicted for oxygen-rich AGB stars with increasing mass loss (Bedijn Bedijn87 (1987)) that we have named the ‘O-rich AGB sequence’. The broad range of colours suggests that this sample bridges the gap between the optically/near-infrared selected AGB samples and the OH/IR stars discovered by OH maser surveys.
The Arecibo sample is probably composed of objects with a variety of variability properties, although the Mira-type large amplitude variables are thought to prevail. Unfortunately, variability information only exists in the literature for around 50 sources in the sample, concentrated at the blue end of the IRAS two-colour diagram. Most of them are well known Mira variables (145d P 660d) listed as such in the General Catalogue of Variable Stars (Kholopov et al. Kholopov98 (1998)) on the basis of optical observations. Ten of them have also been monitored in the near-infrared (Whitelock et al. Whitelock94 (1994); Olivier et al. Olivier01 (2001)), displaying amplitudes of 0.5m K 1.7m. At least one of these blue sources, IRAS 02404+2150, has been reported to show a low amplitude semiregular variability (Whitelock et al. Whitelock95 (1995)). At the red end a handful of sources has previously been referred to in the literature either as variable or non-variable OH/IR stars, but usually a detailed knowledge of their light curves is still lacking. In addition, a few peculiar sources are also part of the sample, such as the very young planetary nebula M 192 (IRAS 19343+2926).
In order to study the variability properties of the ‘Arecibo sample’ (periods, amplitudes, and colour variations) we started in 1999 a near-infrared monitoring program that we are still carrying on. At the end of 2003 we had already completed 11 observing runs with more than 110 nights of observation. A subsample is also being monitored optically. The first results of this multi-wavelength long-term monitoring program are reported in this paper. Our ultimate goal is to study in particular the oxygen-rich AGB stars with MMS 2 M⊙ which are probably rare among AGB stars discovered optically and in the near-infrared, but are common in samples discovered by blind OH maser surveys.
In this paper, which is the first of a series of three, we will focus on the determination of the optical/near-infrared counterparts of all the OH/IR stars in the ‘Arecibo sample’ and on the identification of suitable reference stars in each field to be used for differential photometry purposes in the future. The result is an atlas of finding charts combining optical images from the Digitized Sky Survey (Djorgovski et al. Djorgovski01 (2001)) and our own near-infrared images, obtained in the J, H, and K bands.
Sect. 2 describes the observations performed and the acquisition and data analysis techniques applied. In Sect. 3 we explain how we identified the optical/near-infrared counterparts and how we determined new accurate coordinates. This is followed by a brief description of the atlas. In Sect. 4 we present the near-infrared photometry, while the results obtained are discussed in Sect. 5. Finally, the main conclusions are presented in Sect. 6.
2 Observations and data reduction
Our ‘Arecibo sample’ of OH/IR stars contains 385 objects, and comprises most of the original sources listed in Eder et al. (Eder88 (1988)), Lewis et al. (1990a ), and Chengalur et al. (Chengalur93 (1993)). The only objects not considered here were sidelobe responses or serendipitous OH maser discoveries, as described in Engels & Lewis (Engels96 (1996)), together with three objects (IRAS 18534+0215, IRAS 19175+1344, and IRAS 19226+1401) that were left out because they were re-classified by Lewis (Lewis97 (1997)) as molecular cloud sources. Finally IRAS 19200+2101 was also removed, as it turned out to be an erroneous entry in the IRAS PSC (see Lewis et al. Lewis04 (2004)).
2.1 Observations
The infrared observations under discussion here were performed during 20 nights in July 1999 and July 2000 at Calar Alto Observatory (Almería, Spain) using the 1.23 m telescope equipped with the infrared camera MAGIC (Herbst et al. Herbst93 (1993)). All sources in the sample, except 13 objects not accessible at this time of the year (with 4h 12h) and the very bright, detector saturating, Mira variable R Aql (IRAS 19039+0809), were observed in the J (1.25 m), H (1.65 m) and K (2.20 m) near infrared bands. The sources observed (N = 371) are listed in Table A2 of the Appendix. All except one (IRAS 18549+0208) were observed at least once under photometric weather conditions. The MAGIC camera uses a 256 256 pixels NICMOS3 array that provides an approximate field of 5′ 5′. Typical on-source integration times were 1 minute for the J and H bands, and 30 seconds for the K band, resulting in typical upper detection limits of around 15m, 14m and 13m, respectively. To avoid saturation when observing the brightest sources a small aperture configuration was used. Standard stars from Elias et al. (Elias82 (1982)) were observed during each night for photometric calibration. They were followed over a range of airmasses to determine the atmospheric extinction corrections.
The main difficulty to observing in the infrared is the high sky background level and its fast temporal and spatial variation. For the accurate determination of the background we took for each object and every filter 5 images with the object centered at different positions in the image (dithering or ‘moving sky’ technique). Thus, each measurement consisted of a set of 5 individual images. Taking the median of the 5 images we obtained a temporally and spatially well determined sky image which was subtracted from the object image. Flat-field images were also taken every night for each individual filter in each of both aperture configurations to correct for pixel-to-pixel sensitivity variations during the data reduction process.
2.2 Data reduction
During each of the two observing epochs we obtained of the order of ten thousand images covering the full sample twice. Within the long-term monitoring project we expect to take 150 000 images, which makes a high level of automation in data reduction desirable. Thus, a semi-automated reduction procedure was developed combining a self-written IDL (Interactive Data Language; Research Systems Inc.) routine with pre-existing routines within the IRAF111IRAF is distributed by the National Optical Astronomy Observatories, which are operated by the Association of Universities for Research in Astronomy, Inc., under cooperative agreement with the National Science Foundation. software package. The IDL routine first reads in all images taken of in a particular observing night from the observing logfile provided by the MAGIC camera software. Then it writes an IRAF macro, which combines several IRAF routines to perform the data reduction which consisted of the following steps. First, a detector mask was used in order to remove the bad pixels from the images. Then these images were divided by the appropriate flat-field images and subsequently the median sky images were subtracted. The sky-subtracted images were then inspected for cosmic ray hits and cleaned by interpolating between the neighbouring pixels. Finally, each set of 5 images obtained per source and filter were aligned and combined to yield the final near-infrared atlas image.
3 Identification of the optical/NIR counterparts
In order to determine the optical/near-infrared counterparts of the sources in our sample we first considered the best coordinates available from the literature or from existing catalogues and then searched for plausible counterparts at these locations both on the optical images from the Digitized Sky Survey and on our near-infrared images.
Improved coordinates with respect to those originally provided by the IRAS Point Source Catalogue (accuracy typically between 10″ – 15″) were obtained in many cases by cross-correlating our sample with the MSX6C Point Source Catalogue (Egan et al. Egan03 (2003)), which provides coordinates with an accuracy of 2″. Although the MSX survey was limited to low Galactic latitudes ( 6∘ in absolute value), its accuracy is in many cases essential for identifying the near-infrared counterpart, in particular in crowded regions along the galactic plane and for extremely red objects only marginally detectable in the K band, as we will see later.
Out of the 269 objects (73% of the observed sample) located within the region of the sky surveyed by MSX, (essentially b 6∘), we found that 249 objects (93%) had a mid-infrared counterpart in the MSX6C Point Source Catalogue (see Table 1 and Table A1 in the Appendix). The missing objects are all located at the edges of the MSX survey area, at galactic latitudes in the range 4.9∘ b 6∘. Two sources (IRAS 19161+2343 and IRAS 19206+2517), although not included in the Point Source Catalogue, were identified directly on the MSX images, from which we also derived the improved coordinates that were later used in the identification process.
Additional improved coordinates were taken from Lewis et al. (1990b ), who determined positions of the OH masers by radio interferometry at the VLA for 46 sources in our list. These coordinates have errors 1″. Note that part of these objects are also MSX detections.
Once the best coordinates available were determined for each source in the sample, we searched for their near-infrared counterparts in our images obtained at Calar Alto. For this we inspected a 30″ 30″ box (or smaller, depending on the accuracy of the available - IRAS, MSX or VLA - coordinates) centered at the nominal Arecibo source position, and searched for a plausible (i.e. redder than average) counterpart within the box. Usually only one ‘red’ source was found close to the expected position; in many cases this was the brightest source in the near-infrared field and/or showed extremely red colours.
In parallel, we searched also the corresponding position in the Second Digitized Sky Survey (DSS2) using the red filter image, which covers the spectral range 6 000 – 7 000 Å with a maximum efficiency around 6 700 Å. In many cases it was easy to confirm the previous identification made in the near-infrared since no optical counterpart (or a very faint one) was seen at the corresponding position.
However, in several cases additional information was needed to verify the optical and near-infrared identification. For a few Arecibo sources more than one candidate was found with appropriate colours. The right counterpart was then uniquely identified by searching for variability between two observing epochs. The same verification method was used for near-infrared counterparts which were detected only in the K band, and for which therefore colour information was lacking.
In most cases (61%), a single, point source counterpart was found both in the optical and in the near-infrared. For less than one third of the sample (28%), a bright near-infrared counterpart was found but so heavily obscured in the optical that nothing was seen on the DSS2 image above the detection limit of 20.8m. 11% of the sources are so strongly obscured that in the near-infrared the counterpart was not identified above the detection limit either (2%), or only in the K-band (9%), being completely invisible at shorter wavelengths.
In all but 8 cases the identification strategy provided a plausible counterpart to the Arecibo source, either in the optical and in the near-infrared or only in the near-infrared. The 8 sources without counterpart are listed in Table 1. All have MSX and/or VLA coordinates, and their counterparts must have been fainter than our detection limits at the two epochs of observation considered. Two of these objects, IRAS 184980017 (OH 32.80.3, a well known long-period variable OH/IR star, Engels et al. Engels83 (1983)) and IRAS 19440+2251 (Lawrence et al. Lawrence90 (1990)) were reported as detected sources in the past but only at wavelengths beyond 3 m. They do not appear to have a counterpart in the 2MASS Point Source Catalogue (Cutri et al. Cutri03 (2003)) either. Two of the sources in Table 1, IRAS 18517+0037 and IRAS 19374+1626, were classified as variable OH/IR stars in the GLMP catalogue (García-Lario Garcia-Lario92 (1992)), based on the large value of their IRAS variability index (quoted in Column 9). The same classification applies also to IRAS 18475+0353 and the above mentioned IRAS 184980017. The remaining three objects have a low variability index. One of them, IRAS 18596+0315 (OH 37.10.8, GLMP 862) is a non-variable OH/IR star which has already left the AGB (Engels Engels02 (2002)). If the non- or small amplitude variability of these objects is confirmed, they are probably also non-variable OH/IR stars that have left the AGB recently.
| MSXIRAS | VLA–IRAS | ||||||||
| IRAS | Coordinates | MSX6C_G | VAR | Other names | |||||
| (J2000) | [″] | [″] | [″] | [″] | |||||
| 18475+0353 | 18 50 00.5 | +03 56 33 | 6 | 1 | 036.2795+02.1143 | 99 | |||
| 18498$-$0017 | 18 52 22.2 | 00 14 11 | 2 | 2 | 032.827600.3152 | 96 | OH 32.8-0.3 | ||
| 18501+0013 | 18 52 40.02 | +00 16 46.9 | 4 | 0 | 5 | 0 | 033.320800.1459 | 15 | |
| 18517+0037 | 18 54 20.8 | +00 41 05 | 2 | 3 | 033.872800.3350 | 85 | GLMP 842 | ||
| 18596+0315 | 19 02 06.3 | +03 20 16 | 2 | 1 | 037.118500.8473 | 17 | OH 37.1-08, GLMP 862 | ||
| 19006+0624 | 19 03 03.4 | +06 28 54 | 1 | 2 | 040.0220+00.3818 | 16 | |||
| 19374+1626 | 19 39 39.2 | +16 33 41 | 17 | 3 | 053.135502.7609 | 60 | GLMP 939 | ||
| 19440+2251 | 19 46 09.27 | +22 59 24.0 | 6 | 0 | 7 | 0 | 059.478400.8969 | 16 | |
Taking into account that IRAS 184980017 (OH 32.80.3) has a period P 1 500d (Engels et al. Engels83 (1983)) and that the other stars in Table 1 are among the most obscured objects in the sample, we conclude that the variable sources are probably OH/IR stars with very long periods ( 1 000d) at the very end of the AGB, while the non-variable ones must be heavily obscured post-AGB stars, already in the transition to the planetary nebula stage.
3.1 The atlas of optical and near-infrared counterparts
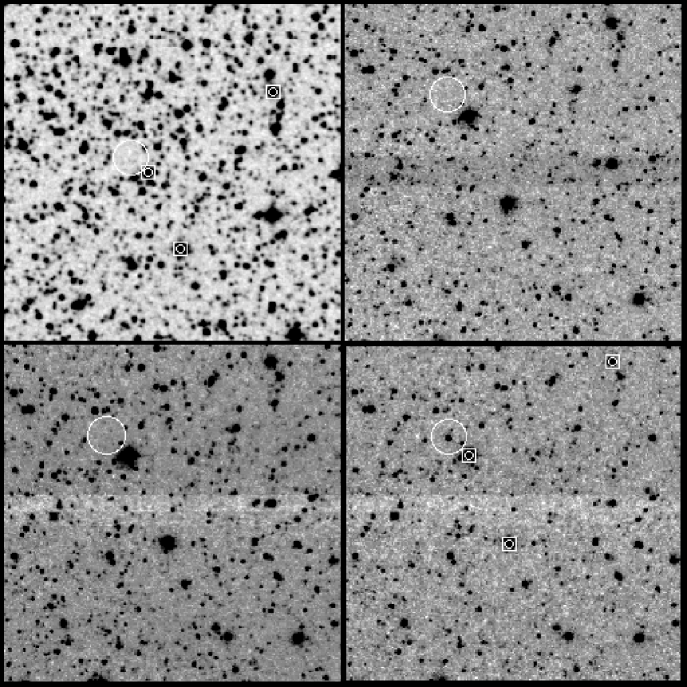
The selected counterparts are displayed as an atlas of finding charts. An example of the atlas images is given in Fig. 2. For each Arecibo source in our sample a chart was put together as a mosaic of 4 frames containing the optical image taken from the DSS2 in the upper left panel, and the J, H and K images from our observations in the upper right, lower left and lower right panels, respectively. The size of the field shown in each filter is 4.6′ 4.6′. For each source we marked the position of the optical/near-infrared counterpart with a circle in each of the available frames, as well as the position of the reference stars used for the astrometric measurements (with small circles surrounded by squares). These are the same stars which are used for differential photometry purposes in our on-going long-term monitoring program. In those cases where an optical/near-infrared counterpart was not found the circle was drawn at the position where the source should be located according to the best coordinates available (MSX or VLA). The complete atlas can be accessed electronically at: http://www.edpsciences.org/aa
3.2 Derivation of improved coordinates
Once the counterparts were identified, we used the set of reference field stars (usually three) visible in both optical and near-infrared images to derive new accurate coordinates of the target stars. Using the relative distances between the Arecibo source and the reference stars in the near-infrared we can determine the position of the counterpart with an accuracy equivalent to less than one pixel on the optical image. If a source was found at that precise position it was considered to be the optical counterpart of the Arecibo source.
In a few cases (4%) the near-infrared counterpart was so bright that the short integration time used to avoid saturation was insufficient to detect any reference star in the field. In these cases, a very bright object was also visible at the nominal position in the DSS2 image and this was taken as the optical counterpart. The plausibility of this identification is supported by the blue IRAS colours associated with these extremely bright near-infrared sources, which imply that they are not expected to be heavily obscured in the optical. Because of the very bright near-infrared counterpart of these stars the variability monitoring is done in the optical to avoid saturation problems during their luminosity maximum.
Taking advantage of the astrometric accuracy (1″/pixel) of the DSS2 images we systematically improved the accuracy of the astronomical coordinates of all sources in the sample for which either an optical or a near-infrared counterpart was found. If the Arecibo source had both an optical and a near-infrared counterpart, the coordinates were taken directly from the DSS2 image by determining the centroid of the point-like emission associated to the optical counterpart. If only a near-infrared counterpart was found, the position of the Arecibo source was determined from its relative position to the reference stars in the near-infrared field, which were always chosen to have point-like optical counterparts. In both cases, the typical astrometric errors are estimated, from the pixel scale of the DSS2 images, to be 1″ both in RA and DEC. The complete list (363 objects) of new coordinates is displayed in Table A1, where we also list the relative distance from the optical/near-infrared counterpart found to the original IRAS coordinates. When available, the distance of the associated MSX and VLA counterparts to the IRAS position is also provided for comparison.
If the Arecibo source had neither an optical nor a near-infrared counterpart, then the coordinates assigned are the best ones available for the source in the mid-infrared (MSX) or at radio wavelengths (for the two with VLA measurements). These are listed in Table 1.
4 Near infrared photometry
Near infrared photometry was performed on each of the sources in the sample for which a near infrared counterpart was found considering the whole set of images available. The SEXtractor software package (Bertin & Arnouts, Bertin96 (1996)) was used in combination with IDL routines to determine for each source the residual background noise in each of the five frames available per filter and to generate a catalogue with the accurate position and the aperture photometry (in integrated counts) of all the point sources detected in the field with a signal at least a 3 above the background. The counts corresponding to the source identified as the Arecibo counterpart were then extracted from these files and averaged, and a standard error was calculated. Individual measurements exceeding the average value by more than 3 were not considered for the subsequent flux determination and error calculation. The counts were then transformed into absolute fluxes taking into account the calibration observations made on standard stars which were used to derive the zero point of our photometric system and the atmospheric extinction. The associated errors were calculated using standard error propagation analysis, yielding typical values of 0.03m for ’well-detected’ sources in the three filters considered.
In Table A2 of the Appendix we present the near infrared magnitudes (or lower magnitude limits) derived for the Arecibo OH/IR stars observed. No photometric data are available for IRAS 18549+0208, because it could not be observed under photometric conditions in any of the observing epochs, nor for IRAS 19029+0933 and IRAS 20149+3440, because these sources were found to be strongly blended with a field star. Ten objects were barely detected in the K band, and were therefore too faint to perform reliable photometry. For them, lower magnitude limits in the three filters are given. Because of various technical problems we were not able to derive the K band magnitude of IRAS 19422+0933, and the H band magnitude of IRAS 20440+0412. We noticed during the data reduction process that several bright OH/IR stars observed with the large aperture were measured in the non-linear regime of the detector resulting in an underestimation of their brightness. For these objects upper magnitude limits are given.
5 Discussion
We made a number of consistency checks involving positional correlations and the analysis of colours, to validate the near-infrared counterparts selected and to single out exceptional objects.
5.1 Positions of the near-infrared counterparts
We have compared our new positions: i) with those originally listed in the IRAS Point Source Catalogue for all the sources in the sample with an NIR counterpart; ii) with those for a subsample of 243 objects with an MSX counterpart; and iii) with the accurate VLA radio coordinates of 44 OH/IR stars. In Table 2 we list the median and the mean separation in right ascension () and declination () between our Calar Alto coordinates and the IRAS, MSX and VLA ones, together with the associated standard deviations.
| N | () | () | |||
|---|---|---|---|---|---|
| median | mean | median | mean | ||
| CA–IRAS | 363 | 3.1″ | 5.6″ (7.1″) | 2.0″ | 2.3″ (2.2″) |
| CA–MSX | 243 | 1.4″ | 1.5″ (1.4″) | 1.0″ | 1.3″ (1.4″) |
| CA–VLA | 44 | 1.0″ | 1.0″ (0.8″) | 0.6″ | 1.1″ (1.4″) |
Our new coordinates are in excellent agreement with those obtained at the VLA, with an average offset in both RA and Dec. of 1″. The only exception is IRAS 18554+0231 with an offset of 7″ (cf. Table A1). Lewis et al. (1990b ) list for this source a larger astrometric uncertainty than for the others, implying that the difference is probably due to an error in the radio position.
In addition, there are 243 sources with available MSX coordinates in our ‘Arecibo sample’. The angular separation between the MSX coordinates and our new coordinates is shown in Fig. 3. The median angular separation is 1.7″. The very good positional agreement with the MSX data reinforces the reliability of our identifications.

As expected, much larger deviations are found when we compare our new coordinates with the original IRAS coordinates. Misidentifications are in this case more difficult to determine, especially if neither MSX nor VLA coordinates are available to support our choice of a given counterpart. Fig. 4 shows the histograms of these deviations. While in declination they are within 6″ with just a few exceptions, in right ascension we find a considerable number of objects ( 20%) showing deviations of the order of 10″ and even larger. The larger errors in RA is a well known feature of the IRAS Point Source Catalogue (Herman et al., Herman86 (1986); Bowers & Knapp, Bowers89 (1989); Lewis et al., 1990b ). The problem is related to the differential accuracy of the IRAS survey in the cross-scan and in-scan directions (Beichman et al. Beichman88 (1988)).


As part of our quality checks we verified that the differences found between Calar Alto and IRAS coordinates were similar to those found between MSX/VLA and IRAS coordinates (for the objects with MSX/VLA data available). Large but consistent deviations can be attributed to the large errors associated to the IRAS coordinates. For the remaining Arecibo sources (those with no MSX or VLA counterparts) it is more difficult to verify that the coordinate deviations are not due to a misidentification. In Table A1 there are 14 sources with extremely large differences in RA ( 20″). 9 of them have MSX coordinates showing very similar deviations with respect to the original IRAS coordinates. The remaining five sources (IRAS 18033+2229, IRAS 19346+0913, IRAS 20127+2430, IRAS 20194+1707 and IRAS 21305+2118) are bright IRAS as well as near-infrared sources. They also have blue IRAS colours and are located at galactic latitudes b 5∘, where confusion is unlikely. We conclude therefore that the identification of these counterparts is correct and that deviations with respect to the IRAS coordinates up to 60″ are possible, although not frequent, and are due to the large errors in the IRAS astrometry.
5.2 Near-infrared magnitude distribution of the ‘Arecibo sample’

Fig. 5 shows the J, H, and K magnitude distribution of the 351 Arecibo sources with a near-infrared counterpart for which a photometric measurement was done at least in the K band. Most of the sources observed have bright near-infrared counterparts with the magnitude distribution peaking around 6.0m in K, 6.5m in H, and 7.5m in J. The distributions are however not strongly peaked and have a long tail extending to the sensitivity limit of our observations. We estimate that the distributions in Fig. 5 become incomplete in all filters at 12m. 18% of the observed sources were not detected in the J-band, and 10% were not detected in the H band. As already mentioned in Sect. 3.1, for 18 sources (5% of the sample) the counterpart was too weak to derive a reliable photometric measurement in the K band.
The observed distribution can in principle be attributed: i) to the different intrinsic brightnesses of the sources in the sample; ii) to the different apparent luminosities expected from sources located in a wide range of distances; and iii) to the different optical thickness of their Circumstellar Envelope (CSE). From the photometric data alone it is unfortunately not possible to disentangle the relative contribution of these three effects for individual sources. However, considered as a whole, we can derive some statistical conclusions from Fig. 5. According to previous studies reported in the literature (cf. Habing Habing96 (1996)), and the results obtained by us (Jiménez-Esteban et al. Jimenez-Esteban04 (2004)) the distribution of intrinsic luminosities expected in our sample of OH/IR stars covers the range between 2 500 L⊙ and 26 000 L⊙. This would translate into a dispersion in observed brightness of the order of 2.5m. Moreover, in Jiménez-Esteban et al. (Jimenez-Esteban04 (2004)) we found that the distribution of luminosities is actually strongly peaked around 3 500 – 4 000 L⊙. This implies that the dispersion in the observed brightness due to the scatter of intrinsic luminosities must be even smaller when statistically considered. On the other hand, in Jiménez-Esteban et al. (Jimenez-Esteban04 (2004)) we found that most of our sources are estimated to be randomly distributed at distances ranging from 1 to 5 kpc. This would mean that their apparent luminosities would cover a brightness range equivalent to 3.5m. The combination of these two effects is not enough to explain the wide range of brightness shown in Fig. 5 (more than 8m in all filters). Thus, the different optical thickness of the CSE of individual OH/IR stars must contribute significantly to the observed scatter.
5.3 The J–H vs. H–K colour-colour diagram

In Fig. 6 we have plotted the near-infrared colour-colour diagram JH vs. HK of all sources with a detection at least in the H and K bands. For objects not detected in J, lower limits for the JH colours were calculated and these are indicated with an arrow in this diagram.
The JH and HK colours show an almost linear correlation extending from (JH = 0.5; HK = 0.3) up to (JH = 4.2; HK = 3.2). The scatter in the range 0.5 JH 3.0 is 0.26m, which is a factor 5 – 10 larger than expected from the errors of our photometry. Beyond JH = 3.0 the scatter increases to 0.40m.
The colour-colour distribution is similar to that obtained by Lewis et al. (Lewis04 (2004)) from 2MASS data for one third of the ‘Arecibo sample’. At its blue end it encompasses also the region where Mira variables are found (Whitelock et al. Whitelock94 (1994)). Unfortunately, the limited sensitivity of our observations especially in the J band prevents the full exploration of the red end of the distribution. If we extrapolate the correlation found, the reddest objects in our sample with H–K 4m would have associated colours J–H 6, well beyond the limit of JH = 4.2 shown in Fig. 6.
In general, the position of the sources in Fig. 6 can be explained as the result of the combined emission of a cool star (T 2 500 K) and a much cooler dust shell (T 800 K). The main effect of the shell in the near-infrared colours would be to increase the circumstellar reddening, which, together with differential interstellar extinction effects from source to source, could explain the width of the distribution observed.
But the correlation shown in the near-infrared colour-colour diagram JH vs. HK essentially represents a sequence of increasing optical thickness of the CSEs, where Mira variables with still optically thin CSEs are placed in the bluer part, and OH/IR stars with thicker CSEs are located in the redder part of the diagram. We expect therefore that the fraction of objects with optical counterparts will decrease with increasing near-infrared colours.

In Fig. 7 we have plotted the fraction of optically identified counterparts on the DSS2 images versus the near-infrared colour HK. As expected, the percentage of detections decreases with H–K colour. For H–K 1 almost all Arecibo sources have optical counterparts, while at H–K 1.5 the fraction decreases rapidly to 50%. The two very blue (H–K 0.7) Arecibo sources without optical counterpart are IRAS 18409+0431 (J = 6.8m) and IRAS 19178+1206 (H = 14.2m) (cf. Table A1). The non-detection of IRAS 18409+0431 might be caused by variability or extremely high extinction, while IRAS 19178+1206 will be later identified in this chapter as a non-variable OH/IR star already in the early post-AGB stage. Beyond H–K = 2 the fraction of optical detections decreases further but does not go down completely to zero. The very red stars (H–K 2.5) with optical counterparts are probably highly variable OH/IR stars optically detected during a luminosity maximum. Another possibility is that the proposed optical counterparts are misidentified and they are actually faint field stars unrelated with the IRAS sources.
Fig. 8 shows the position of the Arecibo sources in the IRAS colour-colour diagram as a function of their near-infrared colours. Blue near-infrared sources with HK 1.0 are located preferentially in the bluer part of the diagram ([12][25] 0.1), while those with a red near-infrared colour (HK 2.0), most of them heavily obscured sources without an optical counterpart as we have just shown, occupy the red part of the diagram ([12][25] 0.1). Those with intermediate near-infrared colours occupy an intermediate range of [12][25] colours, as expected. There are however large overlaps between these groups.

The smooth correlation found between near- and mid-infrared colours corroborates the generally accepted interpretation that both the HK and the [12][25] colour sequences are good indicators of the optical thickness of the CSE. The colours cover the whole optical thickness range, from the optically thin shells of Mira variables to the thick shells of OH/IR stars. As the transparency of the shell decreases, stars are expected to become obscured, initially in the optical range and subsequently in the near-infrared at increasing wavelengths. The very red objects which could not be detected in the H band represent the most extreme AGB population of obscured stars. Most of them are actually located among the reddest sources also in the IRAS two colour-colour diagram, as we can see in Fig. 8.
The detection of a few blue near-infrared (H–K 1.0) counterparts with very red [12][25] ( 0.55) colours could be an indicator of the end of the high mass loss regime in these stars, which should then be classified as post-AGB stars. Stars in the post-AGB phase are expected to reappear again as bright sources first in the near-infrared and later in the optical range, while the remnant of the circumstellar shell dissipates. Alternatively, they could also be field stars, with the true counterparts being heavily obscured beyond our detection limits. We will analyse this small group of stars later more in detail.
5.4 The K[12] vs. [12][25] colour-colour diagram
Another way to analyse the near- and mid-infrared properties of the sources in our sample is to study their distribution in the K[12] vs. [12][25] colour-colour diagram (Fig. 9). All stars with a reliable K band photometry and good quality IRAS fluxes at 12 and 25 m are plotted. If only upper limits in flux (lower limits in magnitudes) are available these are indicated with arrows. In stars with optically thin shells in the near-infrared the K[12] colour provides information on the relative contribution to the overall spectral energy distribution of the near-infrared emission, dominated by the central star and by the hot dust surrounding it, and of the mid-infrared emission, mainly coming from the cool dust in the circumstellar shell. The correlation of the K[12] with the IRAS [12][25] colour can then be interpreted as an additional indicator of the optical thickness of the CSE of a given source. To calculate the K[12] colour we adopted a zero-magnitude flux in the K band of 665 Jy (Koornneef Koornneef83 (1983)).

Although a clear correlation exists between the K[12] and the [12][25] colours, as is shown in Fig. 9, there is a very large scatter on both axes. Only a small part of this scattering can be attributed to the intrinsic errors associated to the photometric measurements, mainly in the IRAS data, as the errors associated to our K band photometry are in most cases negligible. Typical errors are in the 10 – 15% range at 12 and 25 m for the sources in our sample which translates into a dispersion of just 0.1 – 0.2m in the [12][25] colour. The influence of interstellar extinction is also expected to be low, as is indicated by the small size of the reddening vector shown in Fig. 9, which corresponds to the reddening effect expected for a star located at a distance of 10 kpc in the K[12] colour (the effect on the [12][25] colour would be negligible). The largest contribution to the colour dispersion observed is expected to come from the strong variability of the sources in our sample. In the case of the K[12] colour, the fact that the near- and mid-infrared observations under analysis were non-contemporaneous adds a substantial scatter. From data in the literature we know that optically bright Miras show typical K band amplitudes of 0.5 – 1.0m while the most extreme OH/IR stars can reach amplitudes in the K band of up to 4m (Engels et al. Engels83 (1983); Le Bertre LeBertre93 (1993); Olivier et al. Olivier01 (2001)). In addition, the bluest Miras with OH maser emission show a variability at 12 m of 0.6m (Smith Smith03 (2003)) while this variability can reach up to 1.8m in the most extreme OH/IR stars. This latter value has been estimated by comparing the measured flux in 12 m both by IRAS and MSX satellites for those Arecibo sources for which these photometric data exist. If we include all these uncertainties in the K[12] vs. [12][25] colour-colour diagram we obtain a wide area delimited by the dashed lines plotted in Fig. 9, where the majority of the stars are located. This would imply that in most cases the intrinsic variability of the sources could explain the scatter observed.
The K[12] colour distribution has also been studied by Whitelock et al. (Whitelock94 (1994)) for Mira variables and by Sevenster (Sevenster02 (2002)) for OH-selected AGB and post-AGB stars. The Mira variables in Whitelock et al. (Whitelock94 (1994)) cover the blue end of the J–H vs. H–K two-colour diagram (Fig. 6) with the majority of them concentrated around values of J–H 1.0 and H–K 0.5. In contrast, the OH-selected AGB and post-AGB stars studied by Sevenster (Sevenster02 (2002)) show a wider distribution in this diagram, very similar to what we observe in our ‘Arecibo sample’.
In the K[12] vs. [12][25] two-colour diagram the blue oxygen-rich Miras studied by Whitelock et al. (Whitelock94 (1994)) are confined to the region indicated in Fig. 9. In the Arecibo sample, K[12] values are in many cases considerably redder, in agreement with the values found in the OH-selected sample of AGB and post-AGB stars used by Sevenster (Sevenster02 (2002)). The scarcity of sources with very red K[12] colours in Whitelock et al. (Whitelock94 (1994)) is therefore largely a selection effect.
For Mira variables the K[12] colour is interpreted by Whitelock et al. (Whitelock94 (1994)) as a measure of the mass-loss rate arguing that the K and 12 m fluxes originate respectively from the star and the shell. This argument is, however, alleviated with the increasing optical thickness of the shell and the corresponding diminishing contribution from the star. The observed range of K[12] colours for a given [12][25] value is therefore a result of several contributions and a more thorough study is needed to properly explain the observations. This will be possible as soon as the K-band variability can be removed from the diagram as the result of our on-going monitoring program.
5.5 Early post-AGB candidates
Fig. 9 also shows at least four clear outliers displaying a near-infrared counterpart much brighter than expected from their red [12][25] colours. They are labelled with their IRAS name in the K[12] vs. [12][25] diagram. Namely, viz. IRAS 18520+0533, IRAS 18551+0159, IRAS 19343+2926 and IRAS 20160+2734. The most natural interpretation for their peculiar position in this diagram is that they are already in the post-AGB stage. As we have already mentioned, once the large mass loss at the end of AGB evolution ceases, the optical depth of the circumstellar envelope decreases and the central star is expected to reappear again at shorter wavelengths while the mid-infrared colours redden further for some time (Bedijn Bedijn87 (1987); Vassiliadis & Wood Vassiliadis93 (1993)). The cessation of the high mass loss is connected to the end of the large amplitude pulsation of regular OH/IR stars. Thus, non-variability is expected to be an additional post-AGB stage indicator.
In addition, we have also indicated with open symbols in Fig. 9 the position of those sources with very red [12][25] colours and unusually blue near-infrared counterparts that were also tentatively classified as candidate post-AGB stars or proto-planetary nebulae in Sect. 5.3. As we can see, two of these sources, IRAS 18520+0533 and IRAS 20160+2734, are among the outliers that we have just identified as candidate post-AGB stars, which supports our classification.
Both samples of candidate post-AGB stars are listed together in Table 3, where we give their photometric colours HK, K[12] and [12][25], the IRAS variability index and the proposed identification.
| IRAS | HK | K–[12] | [12]–[25] | VAR | Comments |
|---|---|---|---|---|---|
| 18095+2704 | 0.26 | 3.55 | 1.11 | 15 | Post-AGB star |
| 18520+0533 | 0.93 | 3.90 | 1.76 | 3 | Peculiar OH/IR star |
| 18551+0159 | 1.66 | 5.20 | 1.87 | 25 | Infrared Planetary nebula |
| 19065+0832 | 0.70 | 3.17 | 1.02 | 98 | Non-variable OH/IR star? |
| 19178+1206 | 0.65 | 7.89 | 0.92 | 1 | Non-variable OH/IR star |
| 19200+1035 | 0.82 | 1.46 | 0.61 | 0 | Planetary nebula |
| 19343+2926 | 1.79 | 2.15 | 1.33 | 0 | Bipolar proto-planetary nebula |
| 20160+2734 | 0.29 | 1.04 | 0.76 | 0 | Semi-regular variable |
As we can see, several of these stars have already been identified as post-AGB stars, proto-planetary nebulae or even as planetary nebulae in the literature.
This is the case for IRAS 18095+2704 a well-known high-galactic-latitude post-AGB star, with spectral type F3Ib (Hrivnak et al. Hrivnak88 (1988)), for which a detailed spectroscopic analysis including determination of chemical abundances can be found in Klochkova (Klochkova95 (1995)).
The NIR photometry of IRAS 18520+0533 shows no variability between our two observing epochs and it has a low IRAS variability index. Eder et al. (Eder88 (1988)) found that this source has a peculiar 1612 MHz spectrum. Its two strongest peaks show the standard profile observed in OH/IR stars, but exterior to these there is a pair of small flat peaks which may be due to a second shell of circumstellar material expanding at a larger velocity. This points to the peculiar nature of this OH/IR star, but we note that its location in the K[12] vs. [12][25] diagram depends strongly on the IRAS 12 m flux, for which there is only an upper limit in the IRAS PSC.
IRAS 18551+0159 was first identified as an infrared planetary nebula by Kistiakowsky & Helfand (Kistiakowsky95 (1995)) on the basis of its strong radio continuum emission at 20 cm and the large F([S III] 9 532Å) / F(Paschen 9 9 225Å) ratio, which means that classification as an ultracompact H II region must be discarded. The source is extremely red and has no optical counterpart on the DSS2 image, which is probably a signature of its recent departure from the AGB.
IRAS 19065+0832 (OH 42.6+0.0, GLMP 876) is the only source in Table 3 showing a large IRAS variability index. It was classified in the GLMP catalogue as a variable OH/IR star (García-Lario Garcia-Lario92 (1992)) on the basis of its large IRAS variability index, together with the detection of a strong silicate absorption feature in its IRAS Low Resolution Spectrum (it is a ‘class 39’ source). However, this is not consistent with the blue colours observed in the near-infrared nor with the non-variability which is suggested by the very similar photometry in our two epochs (only 0.07m difference in the K-band). Our suggestion is that, if the near-infrared source was correctly identified, the star must be already in the post-AGB stage, but we cannot discard the possibility of a misidentification. This is why our classification in Table 3 is only tentative.
We identify IRAS 19178+1206 (GLMP 899) as a non-variable OH/IR star in a very early post-AGB stage. The source is invisible in the optical while it has a relatively blue near-infrared counterpart. The non-variability and the blue near-infrared colours are confirmed with our two different epochs. However, the near-infrared counterpart of this source might in fact be a field star, and the true IRAS source invisible even in the K band.
IRAS 19200+1035 (K 333) is included as a compact planetary nebula in the Strasbourg-ESO Catalogue of Galactic Planetary Nebulae (Acker et al. Acker92 (1992)) although with a wrong finding chart. It is clearly identified as a bright source in our near-infrared images while it is very faint in the optical. Again the non-variability and the blue near-infrared colours are confirmed with our two different observing epochs.
IRAS 19343+2926 (M 192), also known as Minkowski’s Footprint, is a very well known young, bipolar proto-planetary nebula (Bujarrabal et al. Bujarrabal98 (1998)). The photometry for this source shows a very low variation between our two observing epochs ( 0.04m in K).
IRAS 20160+2734 (AU Vul) is classified as a semi-regular pulsating star in the SIMBAD database. It was first considered a post-AGB star by Jiménez-Esteban et al. (Jimenez-Esteban01 (2001)) during a first analysis of our present sample. Lewis et al. (Lewis04 (2004)) supported this classification on the basis of the erratic detection of its different masers, being detected in the 1612 MHz OH maser at the sensitivity limit of the telescope by Eder et al. (Eder88 (1988)), non-detected later in a water maser survey by Engels & Lewis (Engels96 (1996)) or as a mainline OH maser by Lewis (Lewis97 (1997)), and recently again detected at 1667 MHz but not at 1665 MHz by Lewis et al. (Lewis04 (2004)).
6 Conclusions
We have presented an atlas of optical/near-infrared finding charts and near-infrared photometric observations for 371 objects taken from the ‘Arecibo sample of OH/IR stars’. Except for 8 sources, we successfully identified their near-infrared counterparts and determined new positions for each source in the sample with an accuracy of 1″. The correctness of the identifications was carefully assessed using improved positional information (MSX, VLA), analysing the near- and mid-infrared colour measurements, and in some cases searching for variability. The few sources for which no near-infrared counterpart was found were identified either as heavily obscured variable OH/IR stars at the very end of the AGB or as non-variable OH/IR stars in a very early post-AGB stage.
The wide dispersion in J, H and K magnitudes is attributed not only to the different apparent brightnesses expected for sources located in a wide range of distances and to their different intrinsic luminosities but also significantly to differences in the optical thickness of the circumstellar shells.
The distribution of the Arecibo sources in the near-infrared JH vs. HK colour-colour diagram is interpreted as a sequence of increasing optical thickness of their CSEs, where Mira-like variables with still optically thin shells are lie in the blue part of this diagram while the more extreme OH/IR stars with thicker shells are located in the redder part of the diagram. Their near-infrared colours can be reproduced with a combination of the emission coming from a cool central star (T 2 500 K) and from a much cooler dust shell (T 800 K). The dispersion of colours observed along the sequence can be explained as differential circumstellar and/or interstellar reddening.
This interpretation was confirmed by a determination of the detection rate of optical counterparts as a function of the HK colour. We found that most of the Arecibo sources with HK 1.0 are detected in the optical range while those with HK 2.0 are heavily obscured sources with no optical counterpart in the DSS2 images. These sources are also located in different regions of the IRAS [12][25] vs. [25][60] colour-colour diagram, suggesting that both near- and mid-infrared colours are good indicators of the optical thickness of the shell.
The connection between the near- and the mid-infrared data was analyzed with the help of the K[12] vs. [12][25] colour-colour diagram. We found a clear correlation between these two colours which can also be interpreted as an indication of the increasing contribution to the overall spectral energy distribution of the mid-infrared component (emission from the cool dust in the circumstellar shell) with respect to the near-infrared component (emission from the central star plus the hot dust surrounding it) as these stars evolve along the ‘O-rich AGB sequence’. However, the scatter of this correlation is found to be very large, partly because of the strong variability of these sources in the near- and mid-infrared and the non-contemporaneity of the observations under comparison. The expected variability goes from 0.5 to more than 4m in the K band and from 0.5 to 1.8m at 12 m, both increasing toward redder [12][25] colours. Once these uncertainties are considered, the distribution observed in the K[12] vs. [12][25] diagram can be explained as a consequence of the different optical thicknesses of the CSEs, with the exception of a few outliers which were found to be much brighter than expected in the near-infrared according to their [12][25] colour.
The few sources showing very red [12][25] colours in combination with unusually blue near-infrared counterparts as well as the outliers in the K[12] vs. [12][25] diagram have been identified as candidate post-AGB stars (some of them are well known proto-planetary nebulae or planetary nebulae).
The proper identification of the IRAS counterparts forms the basis for a successful completion of our long-term infrared and optical monitoring program begun in 1999, which is aimed at determining the variability properties of all the sources in the ‘Arecibo sample of OH/IR stars’ and combine the information collected in the near-infrared with data available at other wavelengths in order to study more in detail the photometric behaviour of these stars in the context of stellar evolution.
Acknowledgements.
Based on observations collected at the German-Spanish Astronomical Centre, Calar Alto, operated jointly by the Max-Planck-Institut für Astronomie and Instituto de Astrofísica de Andalucía (CSIC). This work has been supported by the Deutsche Forschungsgemeinschaft through travel grants (En 176/24-1 and 25-1) and by the Spanish Ministerio de Ciencia y Tecnología through grant AYA200309499. Part of the data reduction was supported by a grant of the Deutscher Akademischer Auslandsdienst (DAAD) to FJE. This research has made use of the SIMBAD database, operated at CDS, Strasbourg, France. We acknowledge also the use of the Digitized Sky Survey, based on photographic data obtained using the UK Schmidt Telescope. The UK Schmidt Telescope was operated by the Royal Observatory Edinburgh, with funding from the UK Science and Engineering Research Council, until 1988 June, and thereafter by the Anglo-Australian Observatory. Original plate material is copyright (c) of the Royal Observatory Edinburgh and the Anglo-Australian Observatory. The plates were processed into the present compressed digital form with their permission. The Digitized Sky Survey was produced at the Space Telescope Science Institute under US Government grant NAG W-2166.References
- (1) Acker, A., Ochsenbein, F., Stenholm, B., et al. 1992, Strasbourg-ESO Catalogue of Galactic Planetary Nebulae (ESO-Garching)
- (2) Baud, B., Habing, H. J., Matthews, H. E., & Winnberg, A. 1981, A&A, 95, 156
- (3) Bedijn, P. J. 1987, A&A, 186, 13
- (4) Beichman, C. A., Neugebauer, G., Habing, J. H., Clegg, P., & Chester, T. J. 1988, IRAS Catalogs and Atlases, Volumen 1: Explanatory Supplement, US Government Printing Office, Washington, DC.
- (5) Bertin, E., & Arnouts, S. 1996, A&AS, 117, 393
- (6) Bowers, P. F., & Knapp, G. R. 1989, ApJ, 347, 325
- (7) Bujarrabal, V., Alcolea, J., & Neri, R. 1998, ApJ, 504, 915
- (8) Chengalur, J. N., Lewis, B. M., Eder, J., & Terzian, Y. 1993, ApJS, 89, 189
- (9) Cutri, R. M., Skrutskie, M. F., van Dyk, S. et al. 2003, 2MASS All-Sky Catalog of Point Sources
- (10) Djorgovski, S. G., Gal, R. R., de Carvalho, R. R., et al. 2001, 199th American Astronomical Society Meeting, BAAS, 33, 1461
- (11) Eder, J., Lewis, B. M., & Terzian, Y. 1988, ApJS, 66, 183
- (12) Egan, M. P., Price, S. D., Kraemer, K. E. et al. 2003, The Midcourse Space Experiment (MSX) Point Source Catalog Explanatory Guide. v2.3, Air Force Research Laboratory Technical Report No. AFRL-VS-TR-2003-1589
- (13) Elias, J. H., Frogel, J. A., Matthews, K., & Neugebauer, G. 1982, AJ, 87, 1029
- (14) Engels, D. 2002, A&A, 388, 252
- (15) Engels, D., & Lewis, B. M. 1996, A&AS, 116, 117
- (16) Engels, D., Kreysa, E., Schultz, G. V., & Sherwood, W. A. 1983, A&A, 124, 123
- (17) García-Lario, P., & Perea-Calderón, J. V. 2004, in preparation.
- (18) García-Lario, P. 1992, Ph.D. Thesis, Universidad de La Laguna, Tenerife (Spain)
- (19) Habing, H. J. 1996, ARA&A, 7, 97
- (20) Herbst, T. M., Beckwith, S. V., Birk, C., et al. 1993, Proc. SPIE Vol.1946, p.605
- (21) Herman, J. & Habing, H. J. 1985, A&AS, 59, 523
- (22) Herman, J., Burger, J. H., & Penninx, W. H. 1986, A&A, 167, 247
- (23) Hrivnak, B. J., Kwok, S., & Volk, K. M. 1988, ApJ, 331, 832
- (24) Jiménez-Esteban, F., Engels, D., García-Lario, P., 2001, in “Post AGB Objects as a Phase of Stellar Evolution”, ASSL v265, ed. R. Szczerba & S. K. Gorny, (Kluwer, Dordrecht).
- (25) Jiménez-Esteban, F., García-Lario, P., Engels, D. 2004, in preparation.
- (26) Jura, M., & Kleinmann, S. G. 1989, ApJ, 341, 359
- (27) Kholopov, P. N., Samus N. N., Frolov M. S., et al. 1998, Combined General Catalogue of Variable Stars, 4.1 Edition
- (28) Kistiakowsky, V., & Helfand, D. J. 1995, AJ, 110, 2225
- (29) Klochkova, V. G 1995, MNRAS, 272, 710
- (30) Koornneef, J. 1983, A&A, 128, 84
- (31) Lawrence, G., Jones, T. J., & Gehrz, R. D. 1990, AJ, 99, 1232
- (32) Le Bertre, T. 1993, A&AS, 97, 729
- (33) Lewis, B. M., Kopon, D. A., & Terzian, Y. 2004, AJ, 127, 501
- (34) Lewis, B. M. 1997, ApJS, 109, 489
- (35) Lewis, B. M., & Engels, D. 1995, MNRAS, 274, 439
- (36) Lewis, B. M., Eder, J., & Terzian, Y. 1990a, ApJ 362, 634
- (37) Lewis, B. M., Chengalur, J. N., Schmelz, J., & Terzian, Y. 1990b, MNRAS, 246, 523
- (38) Olivier, E. A., Whitelock, P., & Marang, F. 2001, MNRAS, 326, 490
- (39) Olnon, F. M., Baud, B., Habing, H. J., et al. 1984, ApJL, 278, L41
- (40) Sevenster, M. N. 2002, AJ, 123, 2772
- (41) Smith, B. J. 2003, AJ, 126, 935
- (42) Vassiliadis, E., & Wood, P. R. 1993, ApJ, 413, 641
- (43) Whitelock, P. 1985, MNRAS, 213, 51
- (44) Whitelock, P., Menzies, J., Feast, M., et al. 1994, MNRAS, 267, 711
- (45) Whitelock, P., Menzies, J., Feast, M., et al. 1995, MNRAS, 276, 219