A New Cataclysmic Variable in Hercules
Abstract
We present time-series observations, spectra and archival outburst data of a newly-discovered variable star in Hercules, Var Her 04. Its orbital period, mass ratio, and outburst amplitude resemble those of the UGWZ-type subclass of UGSU dwarf novae. However, its supercycle and outburst light curve defy classification as a clear UGWZ. Var Her 04 is most similar to the small group of possible hydrogen-burning “period bouncers”, dwarf novae that have passed beyond the period minimum and returned.
EQ J183926+260409 (catalog Var Her 04) AAVSO 1835+25 (catalog AAVSO 1835+25) Var Her 04 (catalog )
1 Introduction
Var Her 04 (EQ J183926+260409; =18:39:26.154 =+26:04:09.89 18mas [J2000]; GCVS designation not assigned yet) is a newly discovered cataclysmic variable in Hercules. It was discovered at photographic (Tri-X) magnitude 11.5 by Yuji Nakamura, Kameyama, Mie-ken, Japan on June 13.632 UT (Green et al., 2004). Announcement of the discovery was made on June 22 by the AAVSO after consultation with the IAUC.111The AAVSO offers two announcement services for these types of objects. The AAVSO customizable MyNewsFlash Service operates automatically continuously. The AAVSO Alert Notice is a more formal announcement of confirmed events. Both can be accessed and subscribed to at http://www.aavso.org/ The first known observation was found in the ASAS-3 survey database (Pojmanski, 2002) on June 15.2462 when it was measured at V= 12.03 0.03. The first American Association of Variable Star Observers (AAVSO)-coordinated observation was made on June 23.677.
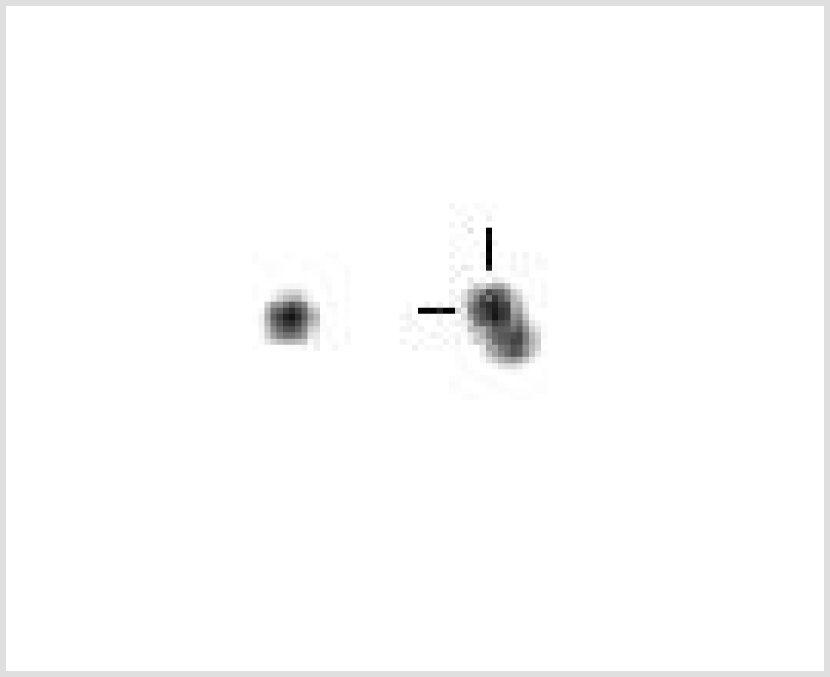
Var Her 04 is the NW component of a double star separated by 0.99 0.04” (Fig. 1). Astrometry was measured using the 1.55-m USNO Flagstaff Station (NOFS) telescope. The SE component matches the position of 2MASS J18392619+2604087 (=18:30:26.195 =+26:04:09.07 40mas [J2000]) within its margin of error. The SE component has B-V=2.09 and likely contaminates all observations made without filters or in Rc and Ic by a system that cannot separate the two. This includes all observations in this paper unless otherwise noted. Var Her 04’s location falls within the error margins of the location of 1RXS J183927.1+260409, a bright X-Ray source in the ROSAT catalog (average hardness ratio 0.59 +/- 0.26) (Voges et al., 1999).
2 Observations
AAVSO observers made 7,551 CCD measurements of the object over 16 days following the announcement of the discovery. Each observer reduced their own data using comparison stars published on an AAVSO chart. They are also instructed to synchronize their imaging computer clocks with the USNO NTP time server. Initial photometric calibration of the field was done by B. Gary from Hereford, Arizona over multiple nights with a 0.36m telescope, ST-8XE CCD and BVRc filters at prime focus (Table 1). Comparison stars were chosen based on brightness and B-V to avoid variability associated with M class stars. Later, precision photometry was obtained over multiple nights using the USNO-FS 1.0m telescope along with a large set of Landolt standards (Landolt, 1992) having a range of color and airmass. The field was observed over multiple nights with the University of Hawaii 2.2-meter on Mauna Kea. These images were calibrated with the comparison stars from Henden’s photometry. Using point spread function fitting, Henden also obtained precise astrometry for both the variable and companion along with photometry of the latter.
The variable was observed at the 1.8m Vatican Advanced Technology Telescope on 2004 June 24 (UT). CCD data was taken in the Johnson filter continuously for 5 hours. The majority of the images were 10 second exposures (plus a 30 second read-out). The data were bias corrected and flat-fielded using twilight sky images.
The optical light curve (Fig. 4) is characterized by a steady decline of 0.17 magnitudes per day until June 24.5000 (JD 2453181.00) when an inflection in the light curve gave rise to a gentle hump that spanned 0.1 magnitudes over 2 days. On June 26.5 (JD 2453182.00) the light curve resumed a slow decline until June 30.0358 (JD 2453186.55) when a rapid decline began. The decline resulted in a drop of 1.1 magnitude. The last observation of the decline was made 0.5062 days after it began. The star remained steady around V=16 through the end of observations in early September. Afterwards, BVRcIcJHKp photometry was obtained during quiescence providing a measurement of V = 17.095 0.029 (Table 2). Precision photometry of the companion revealed some brightening during the time period that the CV was declining and then it too went into a state of quiescence (Table 3).
A blue spectrum was obtained on 2004 June 23.32 UT and again on 2004 June 25.45 with the FAST spectrograph (Fabricant et al., 1998) at the Cassegrain focus of the 1.5-meter Tillinghast telescope at F. L. Whipple Observatory on Mt. Hopkins. The FAST spectrograph uses a 2688512 Loral CCD with a spatial scale of 11 per pixel in the binning mode used for these observations. The exposure time for the observation was 360s. The slit was oriented with a position angle of 70∘; this was not the optimal parallactic angle (Filippenko, 1982), but the low airmass (1.01) and wide slit (3′′) imply that differential slit losses were insignificant. Standard CCD processing and optimal spectral extraction were done with IRAF222IRAF is distributed by the National Optical Astronomy Observatories, which are operated by the Association of Universities for Research in Astronomy, Inc., under cooperative agreement with the National Science Foundation.. Custom routines were used to calibrate the flux data using the sdO comparison star BD (Stone, 1977) in the region 3400-4500 Å and the sdG comparison star BD (Oke & Gunn 1983) in the region 4500-7500 Å. Telluric absorption features were removed using the intrinsically featureless spectrum of BD (Wade & Horne, 1988; Matheson et al., 2000).
The spectrum (Fig. 2) shows a blue continuum with double-peaked Balmer lines. The full width at half maximum of the H line is 2000 km s-1 and it shows some change in shape between the two nights. The Balmer lines become dominated by absorption at the blue end of the spectrum. Weak, double-peaked emission lines of HeI are detected as well as a NaI absoprtion feature. Very broad bumps identified as HeII and high ionization states of carbon and nitrogen, generally associated with Wolf-Rayet features are also seen. The spectrum is similar to that of WZ Sge during outburst (Brosch et al., 1980).
3 Superhumps
Superhumps were observed from the beginning of AAVSO observations on June 23.3677 (2453179.8677) to June 30.5592 (2453187.0592) (Fig. 5). Before combining data for statistical analysis, each observer’s data set was individually transformed to a uniform zero-point by subtracting a linear fit from each night’s observations. This was done so that we could remove the overall trend of the outburst, and combine all observations into a single data set. We used a date-compensated discrete Fourier transform (Ferraz-Mello, 1981) combined with the CLEANest algorithm (Foster, 1995) for period analysis. Superhumps appeared in the earliest time series data set beginning on June 23.3677. Analysis of the observations until June 30.5592 (2453187.0592) give a superhump period of 0.05778 0.000001 days (Fig. 6). Then a period of 0.056855 0.000069 days emerged in quiescence (Fig. 7). The power spectrum in quiescence is also more complicated. This is probably because of noise from the faint photometry and influence by the red companion. Further time series CCD observations spread out over the next ten days revealed no significant change in the power spectrum.
4 Archival Data
The blue RH series patrol plates at the Harvard College Observatory Plate Stacks were inspected for previous outbursts on plates dating from 1929 to 1950. Four outbursts were detected and one more possible outburst was detected at the plate limit (Table 4). The All Sky Automated Survey 3 (ASAS-3) does not detect the star during almost nightly observations from March 30.4 2003 to June 6.3 2004. A search through the orphan files in the NSVS database (Wozniak et al., 2004) revealed no detected outbursts from April 5.5 1999 to March 23.5 2000.
5 Analysis
The orbital period, outburst amplitude and lack of a recently detected outburst333An outburst of this object within the last 20 years should have been detected by amateurs - as the 2004 outburst was - due to its prime location, brightness and duration of outburst. Outbursts during solar conjunction, though, could not have been observed. suggest classification as a UGWZ dwarf nova. However, Var Her 04 displayed more frequent and consistent outburst behavior from 1929 - 1950 and there is an absence of the expected UGWZ echo outbursts in the 2004 outburst.
If days is the superhump period and days is the orbital period then we derive a superhump-period excess, and an approximate mass ratio of as derived from
| (1) |
(Patterson 1998).
There are other objects that display similar erratic outburst behavior with orbital periods and mass ratios similar to Var Her 04: EG Cnc, WZ Sge, AL Com and DU UMa (Patterson, 1998). This small group of stars are believed to be hydrogen-burning “period bouncers”, dwarf novae that have periods which are lengthening after evolving through the period minimum. These are theoretically the most common type of CV, but also the most elusive as a result of their inherently faint nature and infrequent outbursts. The most obvious common trait of these stars is very low , which is dependant on mass ratio. The low mass ratio implies a very small secondary which provides a hint towards the relative age of the system with older systems more likely to have survived a period bounce.
The faint red companion is close to the variable making it difficult to obtain precision photometry and astrometry of both during quiescence. Photometry of this companion suggests a hint of brightening that is coincident with the outburst of the variable and beyond the expected photometric error. The online POSS I/II averaged coordinates were checked for proper motion but they consist of the averaged position of the red and blue plates. The former will be contaminated by the companion so proper motion could not be estimated. Additionally, direct parallax measurement would be quite difficult because of the companion but may be possible in three years with a large aperture telescope. The change in position angle should be detectable in a few years if the stars are part of the same system. If so, then the companion may have been reflecting outburst light from the variable.
6 Conclusions
AAVSO observations and study of recent and past Var Her 04 superoutbursts reveal an enigmatic system with an outburst light curve and supercycle unlike any other known object. Var Her 04 is most similar to the small group of now five possible UGSU hydrogen-burning “period bouncers”. Searches for past outbursts in other archives and careful monitoring of current behavior is needed to establish supercycle behavior evolution. AAVSO observers will carefully monitor the star over the next few years for a new outburst. Precision photometry, X-ray observations, and quality spectra in quiescence would be useful in firmly establishing the mass ratio of the system. In addition, future proper motion studies of the companion using large aperture telescopes is needed to determine any relationship with the faint red companion.
References
- Brosch et al. (1980) Brosch, N. et al. 1980, ApJ, 236, L29
- Fabricant et al. (1998) Fabricant, D., Cheimets, P., Caldwell, N., & Geary, J. 1998, PASP, 110, 79
- Ferraz-Mello (1981) Ferraz-Mello, S. 1981, AJ, 86, 619
- Filippenko (1982) Filippenko, A. V. 1982, PASP, 94, 715
- Foster (1995) Foster, G. 1995, AJ, 109, 1889.
- Green et al. (2004) Green, D. et al. 2004, IAU Circ., 8374
- Landolt (1992) Landolt, A. 1992, AJ, 104, 340
- Matheson et al. (2000) Matheson, T., Filippenko, A. V., Ho, L. C., Barth, A. J., & Leonard, D. C. 2000, AJ, 120, 1499
- Oke & Gunn (1983) Oke, J. B., & Gunn J. E. 1983, ApJ, 266, 713
- Patterson (1998) Patterson, J. 1998, PASP, 110, 1132
- Pojmanski (2002) Pojmanski, G. 2002, Acta Astron., 52, 396
- Stone (1977) Stone, R. P. S. 1977, ApJ, 218, 767
- Voges et al. (1999) Voges, W. et al. 1999, A&A, 349, 389
- Wade & Horne (1988) Wade, R. A., & Horne, K. D. 1988, ApJ, 324, 411
- Wozniak et al. (2004) Wozniak, P. R., et al. 2004. AJ, 127, 2436
Var Her 04 (NW component) and companion in Rc at quiescense. Image taken on Aug. 15, 2004 with the University of Hawaii 2.2m Telescope (0.2arcsec/pixel; N up, E right; image fov: 10”). Photometry of Ver Her 04 in quiescence is contaminated by the companion.
Blue (370-750nm) spectra from Mt. Hopkins on June 23.32 reveals the typical spectrum of a cataclysmic variable.
Comparison of Ha and Hb features in the Mt. Hopkins spectra taken on June 23.32 and June 25.00.
Var Her 04’s Light Curve. Data averaged from AAVSO sources. Combining faint unfiltered observations leads to the larger errors at late time.
Superhumps during outburst.
Power spectrum from June 23.3677 - June 30.5592 reveals a strong superhump period of 0.05778 0.000001 days (17.30702 0.00015 cycles/day ) .
Quiescence power spectrum from July 1.5 - July 9.2. The orbital period of 0.056855 0.000069 days (17.58860 0.02139 cycles/day) emerges among noise caused by the faintess of the object and the influence of the companion.
| Catalog No. (USNO-A2) | Gary V | Gary B-V | Henden V | Henden B-V |
|---|---|---|---|---|
| 1125_10016245 | 8.930.04 | 0.550.06 | N/A | N/A |
| 1125_10031765 | 10.170.04 | 0.540.06 | N/A | N/A |
| 1125_09987061 | 12.050.04 | 0.370.06 | N/A | N/A |
| 1125_10020652 | 12.770.04 | 0.390.04 | 12.7810.011 | 0.4820.021 |
| 1125_10006945 | 13.300.04 | 0.570.07 | 13.3050.013 | 0.6540.021 |
| 1125_10011471 | 14.980.05 | 0.640.10 | 15.0630.014 | 0.7460.016 |
| 1125_10011793 | 15.610.05 | 0.580.14 | 15.6420.006 | 1.1310.030 |
| 1125_10006257 | 16.520.15 | 0.680.29 | 16.5950.017 | 1.2620.023 |
| Filter | Date (UT) | Magnitude | Obs. |
|---|---|---|---|
| B | Aug. 3, Sep. 14 | 16.7010.084 | NOFS |
| V | Aug. 14.3, 15.3 | 17.0950.029 | UH |
| Rc | Aug. 14.3, 15.3 | 17.0050.082 | UH |
| Ic | Aug. 14.3, 15.3 | 17.0140.019 | UH |
| J | Sep. 23.1, 26.1 | 16.8850.064 | NOFS |
| H | Sep. 23.1, 26.1 | 16.5250.121 | NOFS |
| Kp | Sep. 23.1, 26.1 | 16.1500.100 | NOFS |
| Filter | Date (UT) | Magnitude | Obs. |
| B | Aug. 12.2, Oct. 15 | 17.015 0.188 | NOFS |
| V | Aug. 14.3, Aug. 15, Oct. 15 | 17.0980.061 | Combined NOFS & UH |
| Rc | Aug. 14.3, Aug. 15 | 16.9900.065 | UH |
| Ic | Aug. 14.3, Aug. 15, Oct. 15 | 16.9530.131 | Combined NOFS & UH |
| J | Jul. 8.3 | 13.3160.005 | NOFS |
| H | Jul. 8.3 | 12.7620.013 | NOFS |
| Kp | Jul. 8.3 | 12.5040.005 | NOFS |
| J | Aug. 4.3 | 13.4100.005 | NOFS |
| H | Aug. 4.3 | 12.8300.006 | NOFS |
| Kp | Aug. 4.3 | 12.5710.009 | NOFS |
| J | Sep. 23.1 | 13.3910.006 | NOFS |
| H | Sep. 23.1 | 12.8310.003 | NOFS |
| Kp | Sep. 23.1 | 12.5600.011 | NOFS |
| J | Sep. 26.1 | 13.4120.007 | NOFS |
| H | Sep. 26.1 | 12.8330.001 | NOFS |
| Kp | Sep. 26.1 | 12.5820.003 | NOFS |
| Date (UT) | Detection Magnitude (Blue) |
|---|---|
| 1932 April 21 | 10.4 |
| 1934 October 17 | 12.2 |
| 1939 August 16 | 14.2 |
| 1940 August 3 | 14.4 (near plate limit) |
| 1941 August 2 | 10.6 |