A Pre-Protostellar Core in L1551
Abstract
Large field surveys of NH3, C2S, 13CO and C18O in the L1551 dark cloud have revealed a prolate, pre-protostellar molecular core (L1551-MC) in a relatively quiescent region to the northwest of the well-known IRS 5 source. The kinetic temperature is measured to be 9 K, the total mass is , and the average particle density is – cm-3 . L1551-MC is in projection oriented at a position angle of 133∘. The turbulent motions are on the order of the sound speed in the medium and contain 4% of the gravitational energy, , of the core. The angular momentum vector is projected along the major axis of L1551-MC corresponding to a rotational energy of . The thermal energy constitutes about a third of and the virial mass is approximately equal to the total mass. L1551-MC is gravitationally bound and in the absence of strong, G, magnetic fields will likely contract on a Myr time scale. The line profiles of many molecular species suggest that the cold quiescent interior is surrounded by a dynamic, perhaps infalling envelope which is embedded within the ambient molecular gas of L1551.
1 Introduction
Stars play a vital role in the cosmos, enriching the interstellar medium and providing the basic building blocks for the formation of planets and life. Stars with masses are vastly more numerous than higher mass stars and contain most of the stellar mass in our Galaxy. Much advancement has been made toward the understanding of low mass star formation due in part to the study of nearby star-forming molecular complexes such as Taurus-Auriga. The dense molecular environments most closely associated with the star formation process have been identified (Beichman et al., 1986; Myers, 1987) and characterized in large survey data (Jijina, Myers & Adams, 1999, and references therein). However, the initial conditions under which protostellar collapse occurs remain poorly understood.
Dicarbon monosulphide is a powerful probe of the dense interstellar medium in star-forming regions containing a multitude of emission lines in the millimeter and centimeter wavebands with no hyperfine structure (Saito et al., 1987), a large Zeeman splitting factor (Shinnaga & Yamamoto, 2000) and high critical density (Wolkovitch et al., 1997). Observational and theoretical studies of C2S in the dense interstellar medium suggest that it traces the early evolutionary stages of pre-protostellar cores (Suzuki et al., 1992; Lee et al., 2003) and is otherwise not detectable in star forming regions (Lai & Crutcher, 2000).
In 2001, we conducted a C2S survey of Lynds 1551 (Lynds, 1962; Snell, 1981) in search of environments in the early stages of star formation. L1551 is an dark cloud at a distance of 140 pc (Kenyon, Dobrzycka & Hartmann, 1994) associated with more than 20 known pre-main sequence stars (see Palla & Stahler, 2002, and references therein). The energetics from the embedded young stellar objects are witnessed as molecular outflows (Snell, Loren & Plambeck, 1980; Moriarty-Schieven, Butner & Wannier, 1995), jets (Mundt et al., 1990) and numerous Herbig-Haro objects (Devine, Reipurth & Bally, 1999).
A single emission region appeared in the northwest quadrant of our C2S survey which we shall refer to as L1551-MC (Lynds 1551 Molecular Core). While L1551-MC is well separated from the known energetics in L1551, there is a low excitation Herbig-Haro object, HH265, which lies at the edge of the projected C2S emission (Devine, Reipurth & Bally, 1999; Garnavich, Noriega-Crespo & Green, 1992). No known energetics in L1551 are directed toward this region (see above references and also Figure 1) and the driving source for HH265 remains a mystery.
The many observations at centimeter and millimeter wavelengths used to investigate L1551-MC are described in §2 from which the morphological and physical properties are derived in §3. A discussion of these results is given in §4, and the conclusions, including future study plans, are summarized in §5.
2 Observations and Reductions
Table 1 displays the general parameters of our observations while the text in this section summarizes the relevant observational information not included in the Table.
2.1 BIMA Observations
2.1.1 mm
On 2001 September 2 and 3 a region centered on L1551 was mapped in C2S using the BIMA111The Berkeley-Illinois-Maryland Association array is operated by the University of California, Berkeley, the University of Illinois, and the University of Maryland with support from the National Science Foundation. array in its most compact (D) configuration equipped with 30 GHz receivers (Carlstrom, Joy & Grego, 1996). A 7 pointing mosaic () centered on the peak emission detected in the D array configuration was then observed in the B and C array configurations in the fall of 2001 and 2002. Only the C and D array data are used (see §3.3.2) which have sufficient coverage to sample all spatial frequencies between 27″ and .
These observations utilized the highest resolution correlator configuration at BIMA (Welch et al., 1996) which translates to a 0.054 km s-1 velocity resolution at the C2S transition frequency. Phase calibration was ensured with regular scans of the quasar 0449+113 while the flux scale of the observations was determined with scans of Jupiter and 3C84. All data were reduced with the MIRIAD reduction package (Sault, Teuben & Wright, 1995) using standard MIRIAD tasks.
2.1.2 mm
The C2S emission region described above (L1551-MC) was then mapped at the transition frequencies of a number of molecular tracers in the 3 mm band. These mosaics all consist of a 7 pointing, Nyquist sampled hexagonal grid centered on , covering a region with 100% sensitivity. These tracks were run at the Hat Creek Radio Observatory in the C and D array configurations between 2002 April and June. In addition to the spectral line information, each correlator configuration contained a total of 800 MHz of continuum which was calibrated and preserved.
The coverage was good at all molecular transition frequencies giving well sampled maps for sky angles except for CS which was only observed in the C array configuration and is more sparsely sampled over this spatial range. The integration time per mosaic pointing totaled minutes for the CS map and hours for all others. System temperatures were variable from to 650 K. All tracks contained 5 minute scans of 0530+135 or 0449+113 at intervals of minutes for phase calibration and 5 minute integrations on Saturn and W3OH for flux calibration. All data were reduced with the MIRIAD reduction package.
2.2 GBT Observations of NH3
Single pointing spectra and spectral line maps containing the (1,1) and (2,2) inversion transition frequencies of the NH3 molecule were obtained with the NRAO222The National Radio Astronomy Observatory is a facility of the National Science Foundation, operated under cooperative agreement by Associated Universities, Inc. 100 m Robert C. Byrd Green Bank Telescope (GBT) in K-band on the nights of 2004 January 6th and 10th. The spectrometer was set to contain 50 MHz of bandwidth centered on a 23.7088144 GHz sky frequency using 9 levels of sampler resolution with 32768 lags in dual polarization mode. Therefore, both the (1,1) and (2,2) inversion transition frequencies including the quadrupole satellites fell within the spectral window with 0.019 km s-1 spectral resolution. The absolute reference position was chosen to lie north of L1551 at , .
The spectral line maps are the result of the On-the-Fly (OTF) mapping technique and cover approximately centered on , . The GBT main beam efficiency, and the aperture efficiency, in K-band. The 60 arcsec s-1 scan rate and 13″ row spacing used to make the maps sufficiently sample all spatial frequencies available to the GBT within the mapped region. System temperature calibrations performed every two rows minimize gain variations across the individual maps and alternating the map scan directions sequentially between right ascension and declination minimize systematic errors (e.g. striping). Typical system temperatures were K on both observing nights.
The single pointing spectra were calibrated and exported into ASCII tables with the AIPS++ software package. All further reductions were performed using the IDL software of Research Systems, Inc. The OTF maps were calibrated and gridded in AIPS++ then written to FITS format for further processing in IDL.
Our final spectra, including those in the spectral maps, are the combination of the two independent, calibrated polarization channels fit in off-line frequencies with a third-order polynomial. Our final spectral map is the combination by weighted mean of six individual maps. Systematic effects from the OTF mapping technique are noticeable in the channels of the final map, although reduced significantly in the velocity integrated map. The total flux in the final spectral map was scaled up by 10% to match the total flux in our individual spectra taken at positions within the mapped region.
2.3 Kitt Peak 12 m Observations at mm
2.3.1 On-the-Fly 13CO and C18O Maps
A region of L1551 was mapped in 13CO on 2000 November 21 and 22 with the Kitt Peak 12 m Telescope333The Kitt Peak 12 m Telescope is operated by the Arizona Radio Observatory at Steward Observatory, University of Arizona, with partial support from the Research Corporation. using the OTF observing technique. The Millimeter Autocorrelator (MAC) was configured in 2 IF mode with 8192 channels and 150 MHz bandwidth. The main beam, taken to be a 2-dimensional Gaussian with a full width at half-maximum (FWHM) of 55″, comprises 90% of the full beam pattern. The aperture efficiency of the 12m at this observing frequency is 0.5. The 60 arcsec s-1 scan rate and 19″ row spacing of the maps provide spatial over-sampling. The number of rows per reference scan (OFF) and the number of OFFs per total power calibration varied over the course of the observations to keep the system temperature variations below 3% between measurements. System temperatures on the 21st were very good, K, and decent on the 22nd, K.
A comparable OTF map in C18O observed on 2002 January 15 and on three consecutive nights starting on 2002 October 21 covered the central of L1551. The backend setup was identical to the 13CO observations. System temperatures were good, K for our January observations and variable for the three nights in October.
The raw OTF data were calibrated, converted to visibility data, baseline fit using a first order polynomial, gridded into an image and then written to FITS file format with the AIPS reduction software. Further analyses were performed using IDL.
2.3.2 CS and N2H+ Spectra
Single pointing spectra were taken on the night of 2002 November 30 at selected points within the C2S emission region at the transition frequencies of both N2H+ and CS. The frequency throw was set to MHz for CS and MHz for N2H+. The MAC was configured in 2 IF mode with 12288 usable channels within a 75 MHz band.
Each spectrum was calibrated and folded using UNIPOPS at the observatory and then output into FITS tables. A third order polynomial baseline fit, the combination of independent polarizations, and further analyses were all done using IDL.
3 Results
3.1 Overview
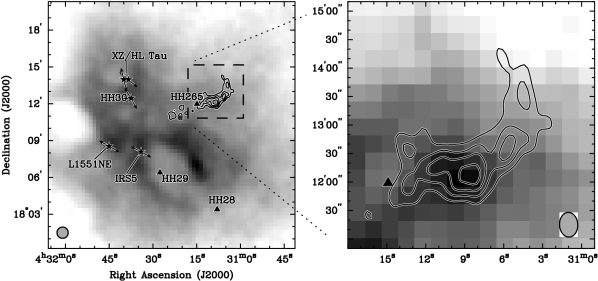
Figure 1 shows our full 13CO Kitt Peak 12 m map with known outflow sources overlaid in the left hand panel. The right hand panel is a closeup of the localized region of C2S emission L1551 revealed by our BIMA survey. The 13CO is optically thick in this region and has a relative maximum which coincides with the peak of the C2S emission. HH265 lies at the eastern edge of the projected C2S.
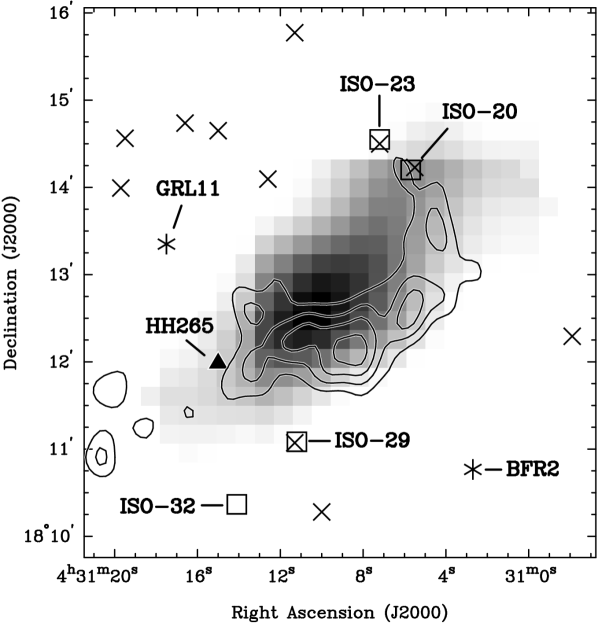
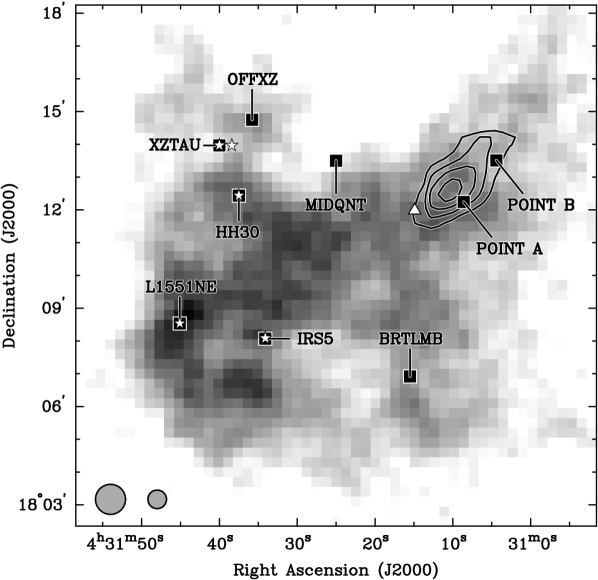
Figure 2 shows a prolate, dense core seen in NH3 spatially overlapping with the C2S emission. There are no compelling young stellar object candidates near L1551-MC in either radio, infrared, or X-ray data. Figure 3 reveals the morphology of the NH3 emission to more closely resemble the distribution of C18O than the optically thick 13CO.
Figure 4 shows a comparison of many molecular spectra taken at the peak of the C2S emission, defined as Point A, relative to the central velocity of the NH3 emission. All lines in Figure 4, excluding C2S, are from the 12 m observations; BIMA observations of these same transitions did not result in any detections, indicating the overall emission is spatially smooth. The C2S emission peaks significantly to the red of the reference velocity. There are signs of self-absorption in both the 13CO and CS spectra. The CS line profile in relation to the central velocity of the NH3 emission is consistent with an infalling envelope of L1551-MC. The N2H+ profile is slightly asymmetric, centered somewhat to the red of the NH3 central velocity, but is otherwise consistent with the NH3 emission profile.
3.2 Is L1551-MC Starless?
Jets, winds and outflows from young stellar sources can dramatically affect the interstellar environment from which they are created. Therefore it is important to determine whether or not a stellar point source is present within a molecular core before the molecular line data are interpreted.
The emission at all IRAS wavelengths in L1551 is dominated by the L1551-IRS5/L1551NE and HL/XZ Tau regions and shows no evidence of any other sources within L1551. A recent paper by Gålfalk et al. (2004) reports the results from a deep mid-IR search for young stellar objects in L1551 using the Infrared Space Observatory (ISO) and four sources (sources 20, 23, 29 and 32 of their Table 2) lie within a 3′ radius of L1551-MC. Source 32 is not considered a potential protostar candidate since it was only marginally detected in the 14.3 m band and has neither an optical nor near-IR counterpart.
The three sources detected at 6.7 m are plotted on an vs. color-color diagram (Figure 4 in Gålfalk et al., 2004). Sources 23 and 29 are consistent with dust reddened stars with no infrared excess. Source 20 was not detected in the band. However, this lower limit on places it above the reddening line at a position consistent with being a reddened main-sequence star.
A SIMBAD search reveals one additional radio source within the 3′ radius of the peak NH3 emission, GRL11. This 1.4 GHz continuum source is most likely of extragalactic origin (Giovanardi et al., 2000; Snell & Bally, 1986). An X-ray source, BFR12, lies within 4″ of GRL11 and is likely related (Bally, Feigelson & Reipurth, 2003). An additional X-ray source from the Chandra survey of L1551, BFR2, is seen to the southwest of L1551-MC and is also most likely a background object.
The combination of all our 3 mm BIMA continuum data precludes the existence of a compact, ″, source at GHz brighter than 5.3 mJy with 99% confidence. Given these considerations we conclude that L1551-MC is starless. A plot of the Gålfalk et al. (2004), 2MASS and SIMBAD sources can be seen in Figure 2.
3.3 Morphology
3.3.1 Distribution and Orientation of Dense Gas
The dense, inner regions of cores are traced well with NH3 emission due to a high abundance under these conditions and a tendency to avoid depletion onto grains (Aikawa, Ohashi & Herbst, 2003). In this section the primary morphological features of L1551-MC are characterized based on the NH3 emission in the region. Several single pointing spectra taken at 23 GHz within the larger L1551 cloud reveal that NH3 emission is not widespread but rather confined to the regions around L1551NE and IRS5 in addition to the region mapped in this paper (see Figure 3). The results from these spectra are summarized in Table 2.
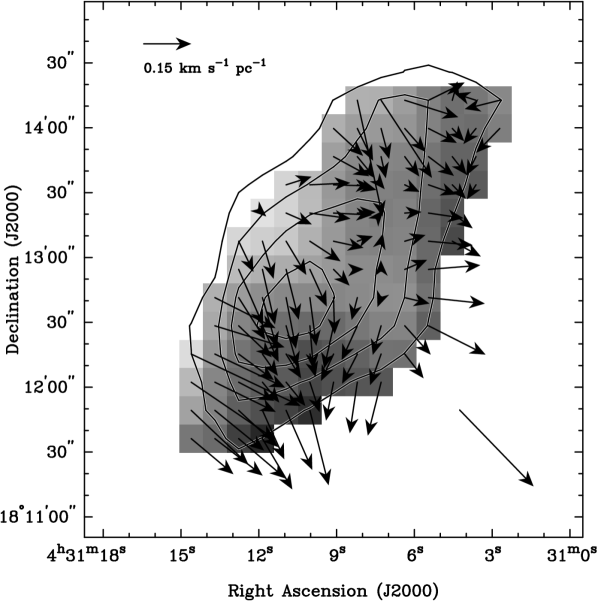
L1551-MC appears roughly elliptical in projection with an axial ratio, . Figure 5 shows the velocity integrated NH3(1,1) emission in the optically thin satellite components as contours. This emission distribution is fit with a 2-dimensional Gaussian with the peak emission amplitude, 2-d centroid, major and minor widths, and position angle as free parameters. The gross morphological features, including the characteristic quantities from the average spectrum within a half-maximum NH3 contour are summarized in Table 3.
A first moment map is created by fitting each spectrum in our NH3 data cube according to §A. Local velocity gradients calculated at each pixel by vector sum of the central velocity difference at the eight neighboring pixels in the first moment map are shown in Figure 5. There is some scatter to the local gradients, but there is an overall trend of higher velocities toward the southwest. Fitting a velocity gradient to the map in a manner similar to that done by Goodman et al. (1993) yields km s-1pc-1 at a position angle of , aligned along the short axis of the velocity integrated emission. The vector addition of all local velocity gradients in Figure 5 yields an identical gradient position angle but smaller amplitude. These results suggest that L1551-MC is prolate. (We assume a prolate spheroidal morphology for L1551-MC in forthcoming calculations unless otherwise stated.)
The velocity integrated emission in all satellite components averaged over elliptical annuli with an axial ratio of two centered on the coordinates in Table 3 at 13″ radius intervals is shown in Figure 6. The 2-dimensional projected radial distance from center is defined as , the impact parameter. The simplest characterization of the intensity profile is of a power law form, . If this function is assumed to describe the intrinsic shape of the intensity profile it becomes immediately apparent that it grossly overestimates the flux in the central pixels. A two component (“broken”) power law function of the form
| (1) |
where , is much more successful in fitting these data. The fit according to the minimum chi-squared value of this intrinsic radial profile convolved with the GBT beam is shown in Figure 6 as the solid line. There is little statistical uncertainty in our best fit parameters, but there is an unknown systematic error since the true 3-dimensional shape of L1551-MC cannot be determined directly from our data. The standard deviation in these parameters invoked by using elliptical annuli of varying axial ratios between and gives an estimate of this systematic error. The best fit parameter values are , , and pc.
An intrinsic intensity profile model of the form
| (2) |
fits our data to even higher precision than the broken power law. A similar model has been used by Tafalla et al. (2002) to fit the 3-dimensional radial profile of molecular cores with great success and is a good approximation to a Bonner-Ebert profile (Tafalla et al., 2004). This model is used here to fit the 2-dimensional intensity profile only for its convenience and easily interpretable parameters. The minimum chi-squared values for the free parameters of this function are K km s-1, pc, and . This fit is displayed as the dashed line in Figure 6.
A broad brush picture of the mass distribution in L1551-MC can be inferred if it is assumed to be an optically thin prolate spheroid at constant temperature, constant abundance fraction, and in local thermodynamic equilibrium (LTE). The inferred flat inner density profile with power index and break at pc where the power law index steepens to is typical for a starless core in Taurus (e.g. Caselli et al., 2002).
This simple picture is most challenged by the possibilities of a varying NH3 abundance fraction and a non-symmetric geometry in the third dimension. Recent studies suggest that the abundance fraction of NH3 increases toward the center of cores (Tafalla et al., 2004), so it is unlikely that an abundance fraction variation alone could produce the flattened inner profile. It would also be unlikely that a geometrical effect could reproduce the effect of having a centrally flat intensity distribution. The existence of a turnover radius at pc is therefore robust, while the slope of the profile both inside and outside is not. No significant N2H+ emission is detected in the BIMA 3 mm data, sensitive to spatial scales between 15 and 80″ at a 3- level of 0.1 Jy beam-1, suggesting that the densest gas in L1551-MC is distributed smoothly.
3.3.2 The Envelope
Carbon monoxide, the second most abundant molecule in the Galactic interstellar medium, has a relatively small dipole moment and traces low density molecular environments. Figures 1 and 3 show 13CO and C18O to be pervasive in L1551 and therefore these isotopomers probe the low density envelope of L1551-MC as well as the environment in which it sits.
If it is assumed that the rotational excitation temperature of 13CO and C18O are equal, the optical depths of these isotopomers can be estimated. The ratio of antenna temperatures of the 13CO and C18O transitions are
| (3) |
where the subscripts 13 and 18 are used to denote quantities related to 13CO and C18O respectively and is the beam efficiency. The telescope parameters are nearly equivalent at these neighboring transition frequencies so to a good approximation . It has been shown that for high column molecular gas ( mag) the 13CO/C18O abundance ratio is relatively uniform and consistent with terrestrial abundance ratios (McCutcheon et al., 1980) which implies . Using these numbers, the mean optical depth of 13CO in the NH3 emission region is 1.9.
The BIMA 13CO and C18O maps show a negligible amount of total emission. There is low level emission visible in the line wings of our 13CO map between the LSR velocities of 5.9–6.5 km s-1 and 7.2–7.9 km s-1. However, there is not enough signal above the 0.44 K per channel noise for any interpretation. No emission is detected in the line core where . The peak antenna temperature in our Kitt Peak maps are 5.74 K and 2.23 K in 13CO and C18O respectively and our BIMA maps are well sampled between 15″ and 80″ with an RMS of K. Therefore, the 13CO and C18O are tracing a relatively smooth envelope of L1551-MC, with an insignificant amount of structure smaller than 80″.
The 13CO and C18O emission extends smoothly from the region around L1551-MC into the greater L1551 cloud. The optically thin C18O follows more closely the overall form of NH3 emission showing no correlation to the C2S map. Therefore it appears that most of the mass in the envelope follows the gross morphology of the dense inner regions characterized in §3.3.1. This interpretation, however, does not account for depletion of these molecular species onto grains, which is known to occur in dense cores (Aikawa, Ohashi & Herbst, 2003; Lee et al., 2003; Tafalla et al., 2004).
The C2S emission in this region curls around the southwestern limb of the NH3 emission and stretches to the location of HH265 (see Figure 2). The brightest peak of C2S emission, defined as Point A in this paper, coincides with a relative maximum in the optically thick 13CO emission (see Figure 1) but shows no such correlation in the optically thin C18O.
No C2S emission is seen to a 3- level of 0.27 Jy beam-1 using BIMA in its B array configuration which samples spatial frequencies primarily between 10″ and 35″ at the our observing frequency. These data are not used in our final maps and spectra, yet the presented maps reflect an accurate morphology of this tracer given our sensitivity limits.
The CS spectrum at Point A is highly asymmetric containing a blue peak and a red shoulder, consistent with self-absorption in an infalling layer or shell (Myers et al., 1996; Evans, 1999). The C2S emission is significantly redshifted with respect to the systemic NH3 velocity. If the C2S emission region lies on the near side of the core, the arcuate distribution of C2S may represent an infalling layer around L1551-MC. The possibility of infall in L1551-MC is discussed further in §4.2.
3.4 Physical Properties
Many useful quantities describing conditions within dense molecular environments can be derived from the NH3(1,1) and (2,2) inversion transitions (see Ho & Townes, 1983). Our NH3(1,1) spectra are fit according to the method described in §A. Minimum chi-squared values less than unity, as expected for a detailed model, were typically achieved using this method and suggest that the LTE assumption is valid for this tracer. Table 4 summarizes the results of our NH3 fitting and Figure 7 shows fits to the spectra at Point A.
3.4.1 Kinetic Temperature
The flux ratio of the NH3 (1,1) and (2,2) transitions can be used to estimate the kinetic temperature of the emitting molecular gas (see §A). The best fit parameters for the (1,1) and (2,2) transitions along with Equations A5 and A6 give a kinetic temperature at Point A, K.
The sensitivity of our NH3 OTF map was not sufficient to detect the (2,2) transition. While a variation in gas temperature by a factor of has been conjectured for Taurus cores (Galli, Walmsley & Gonçalves, 2002), the upper limit on from the Point B spectrum limits the temperature variation to % (see Table 4). A constant kinetic temperature K within L1551-MC is assumed in all following calculations which include temperature.
3.4.2 Thermal and Turbulent Motions
The full width at half-maximum thermal line width for a gas in LTE at kinetic temperature is given by
| (4) |
where is the mean particle mass of a gas of molecular hydrogen containing atomic helium with a solar mass fraction (). Using from §3.4.1, km s-1. The non-thermal line width of a molecular species can be derived from the observed line width, , and kinetic temperature.
| (5) |
where is the mass of the observed species. Assuming well mixed conditions, this quantity represents the non-thermal line width for the medium. The total line width can be obtained by adding the thermal and non-thermal components in quadrature.
The mean non-thermal line width is km s-1 and the mean total line width is km s-1 obtained by averaging the line widths from each spectrum fit according to §A within a half-maximum NH3 contour. The errors in the line widths are from Landman, Roussel-Dupré & Tanigawa (1982) and by propagating the error in . The sound speed in the medium is given by, km s-1, roughly equal to in the region. There is no significant correlation between the projected distance from the peak NH3 emission and the velocity width.
3.4.3 Mass and Density
The total mass of a molecular core cannot be observed directly and must be inferred using estimates of tracer abundances. The most abundant molecule, H2, does not radiate in the millimeter or centimeter bands due to its homo-polar geometry, leaving mass estimates of molecular regions dependent on conversion factors for less abundant molecules such as CO. Many processes affect molecular abundance ratios (see van Dishoeck & Blake, 1998, for a comprehensive review) and published results for (CO) in Galactic molecular clouds have varied by a factor of (Lacy et al., 1994). Following is an estimate of the total mass of L1551-MC first using our CO isotopomer data and NH3 data within a half-maximum contour of the velocity integrated NH3 intensity and then by consideration of the virial theorem.
The total column of 13CO in each pixel of L1551-MC is found assuming that 13CO is thermalized at 9 K. These values are corrected for optical depth using Equation 3 and then summed. Using (13CO) converts this number to a total mass of 1.9 .
The total column of NH3 in the (1,1) state is derived approximating the partition function as the sum over all metastable states up to (Winnewisser, Churchwell & Walmsley, 1979). The total NH3 mass of L1551-MC is found to be which implies a total molecular mass between 0.8–2.4 for (NH3) between (Jijina, Myers & Adams, 1999) and (Tafalla et al., 2004). The total mass of L1551-MC estimated from molecular line emission is good to within about a factor of 2.
The virial mass is obtained assuming virial equilibrium between thermal and gravitational self-energy. If it is assumed that L1551-MC is comprised of molecular hydrogen
| (6) |
Here is the geometrical and non-uniformity factor of Equation 7 which is of order unity (Bertoldi & McKee, 1992), from Table 5, and is the semi-minor axis of the prolate spheroid. Equation 6 yields for
An estimate of the volume density from the NH3 fits is presented in Table 4. This density, , is estimated from the excitation temperature of the fit assuming non-LTE conditions and is a lower limit to the true density of the medium in the derivation (see Equations A7 and following). N2H+() is less likely to be in LTE than NH3(1,1) owing to a much higher critical density. The hyperfine structure in the N2H+() transition is fit in a similar fashion to the NH3 fits of §A only with the appropriate central frequencies and line strengths for the 7 hyperfine components (Caselli, Myers & Thaddeus, 1995; Tiné et al., 2000) input into Equation A4. The excitation temperature from the fit and temperature from §3.4.1 then determine the density of the medium using Equation A7 (see also Caselli et al., 2002). The best fit to the composite N2H+ spectrum gives an average particle density cm-3 in L1551-MC.
The average density inside this core using a mass of 2 and volume of a prolate spheroid with dimensions from Table 3 is cm-3. In consideration of the factor of two error in the mass, the unknown 3-dimensional geometry, and the estimates of from the NH3 and N2H+ data, the average density in L1551-MC – cm-3.
4 Discussion
4.1 Energy Partition
The gravitational stability and boundedness of L1551-MC can be estimated through investigation of the energy partition.
The gravitational self-energy for an ellipsoidal mass with a power-law density distribution, , is
| (7) |
where
| (8) |
and is the eccentricity of the ellipsoid (Bertoldi & McKee, 1992). An estimate of the rotational energy can be derived by assuming a spherical geometry with the radius equal to the semi-major axis.
| (9) |
where is the global velocity gradient and . The thermal energy for a diatomic molecular gas is and the turbulent energy is estimated from the non-thermal component of the line width , where .
Table 6 summarizes the results for the energy partition in L1551-MC for three different power law density profiles, , 1.2, and 2.0, using both a spherical, , and prolate spheroidal geometry with . In this table, and represents a measure of the gravitational stability based on virial arguments in the absence of magnetic fields (e.g. McKee & Zweibel, 1992). In this definition is the kinetic energy term in the absence of pressure confinement and is the gravitational term. The negative values of in Table 6 for all cases is strong evidence that L1551-MC is confined by its own self-gravity. The values most consistent with our analysis in §3 are and .
The strength of the magnetic field is not known in this region. Given the total energy estimates in Table 6, a field strength of G is needed for L1551-MC to be magnetically sub-critical which seems high based on Zeeman measurements (Levin et al., 2001; Crutcher, Heiles & Troland, 2003), but is on the order of recent estimates from polarized dust emission in starless cores (Crutcher et al., 2004). The ambient magnetic field position angle in L1551 was measured to be roughly 80∘ (Vrba, Strom, & Strom, 1976) based on the polarization of background stars in the periphery of the cloud. This angle is roughly consistent with the orientation of the jets and outflows and may reflect a relationship between the magnetic field geometry and the stellar formation process in L1551. The minor axis of L1551-MC is also in rough alignment with the ambient magnetic field position angle, but further study of the magnetic field in the immediate vicinity of L1551-MC is needed to determine conclusively its effects on the evolution of this molecular core.
To infer the force balance of a core from energy considerations the equilibrium state must be assumed. From §3.4.3, suggesting that L1551-MC is virialized. While virial equilibrium is generally conjectured for ammonia cores (e.g. Jijina, Myers & Adams, 1999), recent numerical results suggest that cores are not likely to be hydrostatic and that dynamic cores projected onto the sky can appear in equilibrium (Ballesteros-Paredes, Klessen & Vázquez-Semadeni, 2003, and references therein). Additionally, there are no equilibrium conditions for an isolated, self-gravitating, prolate spheroid (Myers et al., 1991). Nevertheless, we can conclude from these analyses that L1551-MC is gravitationally bound and may be unstable. Thermal pressures provide some support against collapse, but ultimately L1551-MC would have to be magnetically sub-critical to prevent collapse on a free-fall time scale, Myr.
4.2 Core Environment
L1551-MC appears fairly simple traced solely in NH3, but is significantly more complex when viewed in other molecular tracers. Figure 4 shows the comparison between the molecular emission of several tracers at Point A with the vertical dotted line signifying the central LSR velocity of the NH3 (1,1) transition from Table 3. All spectra in Figure 4 are taken in the 3 mm band using the Kitt Peak 12 m Telescope except the C2S spectrum which was taken from the BIMA 9 mm map, smoothed to ″ to minimize beam dilution effects.
The 13CO spectrum at the top of Figure 4 is optically thick; using Equation 3 with the error determined by Monte Carlo simulation assuming no error in the isotopic ratio. The width of this line is much larger than expected from the direct conversion from the NH3 width and there is a dip in the line intensity at the central NH3 velocity. The 13CO is likely tracing a column of gas which extends from the high density interior into the more tenuous and turbulent surroundings.
The CS line in Figure 4 clearly shows a non-Gaussian shape which represents all of our CS spectra taken across the major axis of the C2S emission. This profile shape has a high peak at km s-1 and a shoulder or second peak at km s-1 which could be due to another component along the line of sight or self-absorption. There is a decrement in intensity at the central velocity of the NH3 emission, suggesting that this feature is due to self-absorption. The broad width of the CS line also means that this gas comprises a larger volume along the line of sight than the NH3. It is possible that the asymmetric profile is due to gas infall from a layer (Myers et al., 1996) or spherical shell (Evans, 1999).
Another intriguing feature seen in Figure 4 is the redshifted peak of the C2S emission in relation to the central velocity of the NH3. This 0.16 km s-1 shift must be due to the kinematics of the gas in L1551-MC since the transition frequency used for our observations has an error (Yamamoto et al., 1990) much less than the observed line width. If the C2S emission lies on the near side of L1551-MC, this implies that the C2S is moving toward the highest density environs and may be further evidence of infall. Conversely, this kinematic shift could be due to outflow from L1551-MC. Chemical differentiation within molecular cores is a well known phenomenon (Tafalla et al., 2004, and references therein) and could also be contributing to the discrepancies seen between C2S and the other molecular tracers. However, there is no clear evidence of depletion in either 13CO or C18O. Alternatively, the C2S could be tracing a distinct component along the line of sight. Given the suggestive profile of the CS() line, the subsonic velocity shift of the C2S, and the coincidence of the C2S peak with the optically thick 13CO, the interpretation that the C2S gas is in a state of infall seems most likely.
The N2H+ spectrum in Figure 4 shows the isolated component at Point A. The fit to the full spectrum (see §3.4.3) yields a value of which means the optical depth of the isolated component is . Assuming a beam filling factor of unity, the excitation temperature K, and the total column of N2H+ within the 12 m beam is cm-2. The beam corrected column depth ratio of our two nitrogenated molecular tracers, (NH3)/N2H+), is consistent with other studies of starless cores in Taurus (Benson, Caselli & Myers, 1998). The distribution of N2H+ emission peaks slightly to the red of the NH3 and is about a factor of 2 broader than that expected from 9 K gas. The N2H+ molecular emission is likely tracing a larger column of gas than the NH3.
From these spectra, a picture emerges in which the cold, gravitationally bound inner region of L1551-MC is surrounded by a warmer, dynamic envelope showing evidence of gaseous infall. This envelope may not be uniform, but is connected to the more static and smoothly distributed, tenuous molecular gas pervading L1551.
5 Conclusions
In this article, the diagnosis of a newly discovered molecular core found within the L1551 dark cloud is described. This core, referred to as L1551-MC, is located at , and has a full width at half-maximum in NH3 emission of at a position angle of 133∘ east of north. It has an inner region with a relatively flat density profile which turns over to a more steeply declining function at a radius of pc. L1551-MC has a mass of , an average density of – cm-3, and a kinetic temperature of 9 K which varies by less than 50% in the inner region. The velocity of the turbulence is on the order of the sound speed in the medium and comprises 4% of the gravitational energy, , of the core. The rotational energy is , while the thermal energy is 0.3 . The core is gravitationally bound and either will collapse on a time scale of 0.3 Myr or is supported by G magnetic fields. L1551-MC has a high density interior traced by NH3 and N2H+ suspended within a dynamic, perhaps infalling envelope which is connected to the more static and tenuous molecular gas seen throughout L1551.
From energy considerations it appears as though L1551-MC will contract to form a star or stellar system. However, there is future work that could further characterize L1551-MC and more accurately place it within the larger star forming context of L1551. An accurate measurement of the magnetic field in L1551-MC will further our understanding of the gravitational support mechanism and constrain the core lifetime. The energy partition depends critically on the total mass and another independent method of determining the total mass, such as from dust emission, should be performed. While the state of the dense, inner regions of L1551-MC are presented herein, supplementary information regarding the envelope of this core is needed. Spectral line maps of CS and its optically thin isotopomer, C34S, will determine the nature of the asymmetric CS line profile and provide a more complete physical, spatial, and chemical picture of the envelope. Lastly, HH265 lies within the projected molecular emission of L1551-MC with no known driving source. Further investigation into the possible relationship between HH265 and L1551-MC may give deeper insight into the evolutionary state of L1551-MC.
Appendix A Ammonia Emission Model
We model our observed spectra using
| (A1) |
where
| (A2) |
and
| (A3) |
For the (1,1) transition, the optical depth is
| (A4) |
where is the total optical depth of the transition, are the relative line strengths of the 18 hyperfine components, is the standard deviation in frequency, and are the central frequencies of the hyperfine transitions (Kukolich, 1967; Rydbeck et al., 1977). To fit the (1,1) transition we wrote a wrapper for the IDL non-linear least-squares fitting routine MPFIT444http://astrog.physics.wisc.edu/$∼$craigm/idl/fitting.html which easily allows for the tying together of parameters and returns all relevant fitting quantities such as the covariance matrix. More than 70% of the total (2,2) intensity lies in the main component for which there are 3 hyperfine transitions ( and ) with separations kHz (Kukolich, 1967). Therefore, a single Gaussian component is used to fit our (2,2) spectra.
Our non-linear least-squares fitting routine utilizes Equations A1 and A4 to fit our (1,1) spectra with the amplitude factor, ; the LSR velocity of the emitting gas; the velocity width; and the total optical depth as free parameters. The velocity width is then analytically corrected for optical depth (e.g. Phillips et al., 1979) and instrumental broadening. The assumption that the excitation temperatures for all hyperfine transitions are equal is inherent in this fitting procedure.
The relative population of NH3 molecules in and states can be solved for assuming equal excitation temperatures and line widths for the (1,1) and (2,2) transitions (c.f. Ho et al., 1979)
| (A5) |
where is the energy difference between the and states in units of Kelvin, and are the statistical weights, is the total optical depth of the (1,1) transition, and and are the relative line strengths of the transitions.
The kinetic temperature, , can be very well approximated from if since transitions between K-ladders can only happen via collision and non-metastable states within a K-ladder radiatively decay very quickly (Ho & Townes, 1983; Walmsley & Ungerechts, 1983; Stutzki & Winnewisser, 1985). Then, only the (1,1), (2,2) and (2,1) states and their respective radiative and collisional rates need to be considered in the detailed balance equation. Using Ho & Townes (1983) for the spontaneous emission rate and Danby et al. (1988) for the collisional rates, we obtain a transcendental equation for in terms of and
| (A6) |
If a specific value of the beam filling factor is assumed, the excitation temperature can be obtained from the amplitude factor in our fits. The volume particle density can then be estimated using the equation of detailed balance for a 2-level system (Stutzki & Winnewisser, 1985; Caselli et al., 2002).
| (A7) |
where
| (A8) |
and are the spontaneous emission and collisional de-excitation rates for the transition with and corresponding to the upper and lower energy levels within the (1,1) state. The escape probability, should be obtained by detailed modeling, but here we use the approximation,
| (A9) |
where is taken to be the maximum optical depth from Equation A4. In Equation A7,
| (A10) |
is the kinetic temperature of the medium, K is the background radiation temperature, and is the particle density of the collisionally exciting species, taken to be H2.
References
- Aikawa, Ohashi & Herbst (2003) Aikawa, Y., Ohashi, N. & Herbst, E. 2003, ApJ, 593, 906.
- Caselli et al. (2002) Caselli, P., Benson, P., Myers, P. & Tafalla, M. 2002, ApJ, 572, 238.
- Ballesteros-Paredes, Klessen & Vázquez-Semadeni (2003) Ballesteros-Paredes, J., Klessen, R. & Vázquez-Semadeni, E. 2003, ApJ, 592, 188.
- Bally, Feigelson & Reipurth (2003) Bally, J., Feigelson, E. & Reipurth, B. 2003, ApJ, 584, 843.
- Beichman et al. (1986) Beichman, C. A., Myers, P. C., Emerson, J. P., Harris, S., Mathieu, R., Benson, P. J. & Jennings, R. E. 1986, ApJ, 307, 337.
- Benson, Caselli & Myers (1998) Benson, P., Caselli, P. & Myers, P. 1998, ApJ, 596, 743.
- Bertoldi & McKee (1992) Bertoldi, F. & McKee, C. 1992, ApJ, 395, 140.
- Carlstrom, Joy & Grego (1996) Carlstrom, J., Joy, M., Grego, L. 1996, ApJ, 456, L75.
- Caselli, Myers & Thaddeus (1995) Caselli, P., Myers, P. & Thaddues, P. 1995, ApJ, 455, L77.
- Crutcher, Heiles & Troland (2003) Crutcher, R., Heiles, C. & Troland, T. 2003, in Lecture Notes in Physics, vol. 614, ed. Falgarone, E. & Passot, T., Springer, 155.
- Crutcher et al. (2004) Crutcher, R., Nutter, D., Ward-Thompson, D. & Kirk, J. 2004, ApJ, 600, 279.
- Danby et al. (1988) Danby, G., Flower, D., Valiron, P., Schilke, P. & Walmsley, C. 1988, MNRAS, 235, 229.
- Devine, Reipurth & Bally (1999) Devine, D., Reipurth, B. & Bally, J. 1999, AJ, 118, 972.
- Evans (1999) Evans, N. 1999, ARA&A, 37, 311.
- Gålfalk et al. (2004) Gålfalk, M., Oloffson, G., Kaas, A., Olofsson, S., Bontemps, S., Nordh, L. Abergel, A., André, P., Boulanger, F., Burgdorf, M., Casali, M., Cesarsky, C., Davies, J., Falgarone, E., Montmerle, T., Perault, M., Persi, P., Prusti, T., Puget, J. & Sibille, F. 2004, A&A, 420, 945.
- Galli, Walmsley & Gonçalves (2002) Galli, D., Walmsley, M. & Gonçalves, J. 2002, A&A, 394, 275.
- Garnavich, Noriega-Crespo & Green (1992) Garnavich, P., Noriega-Crespo, A. & Green, P. 1992, Rev. Mexicana Astron. Astrofis., 24, 99.
- Giovanardi et al. (2000) Giovanardi, C., Rodríguez, L., Lizano, S. & Cantó, J. 2000, ApJ, 538, 728.
- Goodman et al. (1993) Goodman, A., Benson, P., Fuller, G. & Myers, P. 1993, ApJ, 406, 528.
- Ho & Townes (1983) Ho, P. & Townes, C. 1983, ARA&A, 21, 239.
- Ho et al. (1979) Ho, P., Barrett, A., Myers, P., Matsakis, D., Cheung, A., Chui, M., Townes, C. & Yngvesson, K. 1979, ApJ,234, 912.
- Jijina, Myers & Adams (1999) Jijina, J., Myers, P. & Adams, F. 1999, ApJS, 125, 161.
- Kenyon, Dobrzycka & Hartmann (1994) Kenyon, S., Dobrzycka, D. & Hartmann, L. 1994, AJ, 108, 1872.
- Kukolich (1967) Kukolich, S. 1967, Phys. Rev., 156, 83.
- Lacy et al. (1994) Lacy, J., Knacke, R., Geballe, T. & Tokunaga, A. 1994, ApJ, 428, L69.
- Lai & Crutcher (2000) Lai, S.-P. & Crutcher, R. 2000, ApJS, 128, 271.
- Landman, Roussel-Dupré & Tanigawa (1982) Landman, d., Roussel-Dupré, R. & Tanigawa, G. 1982, ApJ, 261, 732.
- Lee et al. (2003) Lee, J.-E., Evans, N. J., Shirley, Y. L. & Tatematsu, K. 2003, ApJ, 583, 789.
- Levin et al. (2001) Levin, S., Langer, W., Velusamy, T., Kuiper, T. & Crutcher, R. 2001, ApJ, 555, 850.
- Lynds (1962) Lynds, B. 1962, ApJS, 7, 1.
- McCutcheon et al. (1980) McCutcheon, W., Shuter, W., Dickman, R.& Roger, R. 1980, ApJ, 237, 9.
- McKee & Zweibel (1992) McKee, C. & Zweibel, E. 1992, 399, 551.
- Moriarty-Schieven, Butner & Wannier (1995) Moriarty-Schieven, G., Butner, H. & Wannier, P. 1995, ApJ, 445, L55.
- Mundt et al. (1990) Mundt, R., Buehrke, T., Solf, J., Ray, T., & Raga, A., 1990, A&A, 232, 37.
- Myers (1987) Myers, P. C., Fuller, G. A., Mathieu, R. D., Beichman, C. A., Benson, P. J., Schild, R. E. & Emerson, J. P. 1987 ApJ, 319, 340.
- Myers et al. (1991) Myers, P., Fuller, G., Goodman, A & Benson, P. 1991, ApJ, 376, 561.
- Myers et al. (1996) Myers, P., Mardones, D., Tafalla, M., Williams, J., Wilner, D. 1996, ApJ, 465, L133.
- Phillips et al. (1979) Phillips, T., Huggins, P., Wannier, P. & Scoville, N. 1979, ApJ, 231, 720.
- Pickett et al. (1998) Pickett, H., Poynter, R., Cohen, E., Delitsky, M., Pearson, J. & Muller, H. 1998, J. Quant. Spec. Radiat. Transf., 60, 883.
- Rydbeck et al. (1977) Rydbeck, O., Sume, A., Hjalmarson, Å., Elldér, J., Rönnäng, B. & Kollberg, E. 1977, ApJ, 215, L35.
- Saito et al. (1987) Saito, S., Kawaguchi, K., Yamamoto, S., Ohishi, M., Suzuki, H. & Kaifu, N. 1987, ApJ, 317, 115L.
- Sault, Teuben & Wright (1995) Sault, R., Teuben, P. & Wright, M. 1995, in ASP Conf. Ser. 77, Astronomical Data Analysis Software and Systems IV, ed., R. A. Shaw, H. E. Payne & J. J. E. Hayes (San Francisco: ASP), 433.
- Shinnaga & Yamamoto (2000) Shinnaga, H. & Yamamoto, S. 2000, ApJ, 544, 330.
- Snell, Loren & Plambeck (1980) Snell, R., Loren, R. & Plambeck, R., 1980, ApJ, 239, 17.
- Snell (1981) Snell, R. 1981, ApJS, 45, 121.
- Snell & Bally (1986) Snell, R. & Bally, J. 1986, ApJ, 303, 683.
- Palla & Stahler (2002) Palla, F. & Stahler, S. 2002, ApJ, 581, 1194.
- Stutzki & Winnewisser (1985) Stutzki, J. & Winnewisser, G. 1985, A&A, 148, 254.
- Suzuki et al. (1992) Suzuki, H., Yamamoto, S., Ohishi, M., Kaifu, N., Ishikawa, S., Hirahara, Y. & Takano, S. 1992, ApJ, 392, 551.
- Tafalla et al. (2002) Tafalla, M., Myers, P., Caselli, P., Walmsley, C. & Comito, C. 2002, ApJ, 569, 815.
- Tafalla et al. (2004) Tafalla, M., Myers, P., Caselli & P., Walmsley, C. 2004, A&A, 416, 191.
- Tiné et al. (2000) Tiné, S., Roueff, E., Falgarone, E., Gerin, M. & Pineau des Forêts, G. 2000, A&A, 356, 1039.
- van Dishoeck & Blake (1998) van Dishoeck, E. & Blake, G. 1998, ARA&A, 36, 317.
- Vrba, Strom, & Strom (1976) Vrba, F., Strom, S & Strom, K. 1976, AJ, 81, 958.
- Walmsley & Ungerechts (1983) Walmsley, C. & Ungerechts, H. 1983, A&A, 122, 164.
- Welch et al. (1996) Welch, W. J. et al. 1996, PASP, 108, 93.
- Winnewisser, Churchwell & Walmsley (1979) Winnewisser, G., Churchwell, E. & Walmsley, C. 1979, A&A, 72, 215.
- Wolkovitch et al. (1997) Wolkovitch, D., Langer, W., Goldsmith, P. & Heyer, M. 1997, ApJ, 477, 241.
- Yamamoto et al. (1990) Yamamoto, S., Saito, S., Kawaguchi, K., Chikada, Y., Suzuki, H., Kaifu, N., Ishikawa, S.-I. & Ohishi, M. 1990, ApJ, 361, 318.


| BIMA | ||||
|---|---|---|---|---|
| Transitions | Frequency (MHz) | aaPost-reduction spectral resolution (kHz) | Obs. Type | |
| C2S() | 33751.373711From Pickett et al. (1998) | 6.1 | Mosaic | |
| 13CO() | 110201.354111From Pickett et al. (1998) | 24.4 | Mosaic | |
| C18O() | 109782.173411From Pickett et al. (1998) | 24.4 | Mosaic | |
| CS() | 97980.950011From Pickett et al. (1998) | 12.2 | Mosaic | |
| N2H+() | 93176.265022Frequency of the hyperfine component (Caselli, Myers & Thaddeus, 1995) | 12.2 | Mosaic | |
| C34S() | 109782.1734 | 12.2 | Mosaic | |
| Green Bank 100m | ||||
| NH3(1,1) | 23694.49553,43,4footnotemark: | 3.1 | OTFbbOn-the-Fly mapping | 34″ |
| NH3(1,1) | 23694.4955 | 3.1 | APSccAbsolute Position Switching | 34″ |
| NH3(2,2) | 23722.633333Hyperfine weighted mean transition frequency from Kukolich (1967) | 3.1 | OTF | 34″ |
| NH3(2,2) | 23722.6333 | 3.1 | APS | 34″ |
| Kitt Peak 12m | ||||
| 13CO() | 110201.3541 | 24.4 | OTF | 55″ |
| C18O() | 109782.1734 | 24.4 | OTF | 55″ |
| N2H+() | 93176.265022Frequency of the hyperfine component (Caselli, Myers & Thaddeus, 1995) | 12.2 | FSddFrequency Switching | 65″ |
| CS() | 97980.9500 | 12.2 | FS | 65″ |
| Source | R.A.(J2000) | Dec.(J2000) | TB(1,1)aaPeak value of main component brightness temperature in Kelvin. Beam filling factors are assumed to be unity. | TB(2,2)aaPeak value of main component brightness temperature in Kelvin. Beam filling factors are assumed to be unity. | |
|---|---|---|---|---|---|
| POINT A | 4:31:08.6 | +18:12:14.4 | 1.41 | 0.23 | 0.04 |
| POINT B | 4:31:04.4 | +18:13:30.4 | 1.09 | 0.07 | |
| IRS5 | 4:31:34.1 | +18:08:04.1 | 2.81 | 0.53 | 0.10 |
| L1551NE | 4:31:45.1 | +18:08:32.0 | 0.44 | 0.06 | |
| XZTAU | 4:31:40.0 | +18:13:58.0 | 0.06 | ||
| HH30 | 4:31:37.5 | +18:12:26.0 | 0.06 | ||
| OFFXZ | 4:31:35.8 | +18:14:45.0 | 0.06 | ||
| MIDQNT | 4:31:25.0 | +18:13:30.0 | 0.06 | ||
| BRTLMB | 4:31:15.5 | +18:06:55.0 | 0.06 |
Note. — Absence of data signifies a non-detection.
| R.A.aaCoordinates of the peak emission. | Dec.aaCoordinates of the peak emission. | bbThe line profile characteristics are derived from the mean spectrum averaged within a half-maximum contour of the NH3 emission. | bbThe line profile characteristics are derived from the mean spectrum averaged within a half-maximum contour of the NH3 emission. | maj.cc“maj.” and “min.” are the FWHM of the major and minor axes respectively. | min. | P.A. |
|---|---|---|---|---|---|---|
| (J2000) | (J2000) | (km s-1) | (km s-1) | (arcmin) | (arcmin) | degrees |
| 4:31:09.9 | +18:12:41 | 6.72 | 0.26 | 2.25 | 1.11 | 133 |
| Source | aaUpper limits to derived from level in the (2,2) spectrum. Quantities dependent on were computed with upper limit value when appropriate. | (NH3) | bbDensity derived using equation Equations A7–A9 | (NH3) | |||||||
|---|---|---|---|---|---|---|---|---|---|---|---|
| (km s-1) | (km s-1) | (K) | (K) | (cm-2) | (cm-3) | (cm-2) | |||||
| POINT A | 6.72 | 0.24 | 8.7 | 5.8 | 4.4 | 0.26 | |||||
| POINT B | 6.71 | 0.23 | 2.9 | 4.5 | |||||||
| IRS5 | 6.42 | 0.48 | 10.0 | 3.5 | 6.4 | 0.47 | |||||
| L1551NE | 6.55 | 0.40 | 4.1 | 3.2 | |||||||
| (K) | () | () | (cm-3) | (km s-1) | (km s-1) | (km s-1) |
|---|---|---|---|---|---|---|
| 9 | 2 | 1.9 | 0.42 | 0.20 | 0.46 |
| aaPower index for . | bbAxial ratio, | ccAn inclination angle, is assumed | dd | |||||
|---|---|---|---|---|---|---|---|---|
| (ergs) | () | () | () | () | ||||
| 0.0 | 1.0 | 1.00 | 1.00 | -0.9 | 0.28 | 3.2 | 2.8 | -0.37 |
| 1.2 | 1.0 | 1.15 | 0.79 | -1.1 | 0.24 | 2.7 | 1.9 | -0.46 |
| 2.0 | 1.0 | 1.67 | 0.56 | -1.5 | 0.17 | 1.9 | 0.9 | -0.63 |
| 0.0 | 2.0 | 0.76 | 1.00 | -0.7 | 0.37 | 4.1 | 3.7 | -0.18 |
| 1.2 | 2.0 | 0.87 | 0.79 | -0.8 | 0.32 | 3.6 | 2.5 | -0.29 |
| 2.0 | 2.0 | 1.27 | 0.56 | -1.2 | 0.22 | 2.5 | 1.2 | -0.51 |