Extragalactic Background Light: new constraints from the study of the photon-photon absorption on blazar spectra
Abstract:
The study of the Extragalactic Background Light (EBL) is crucial to understand many astrophysical problems (as the formation of first stars, the evolution of galaxies and the role of dust emission). At present, one of the most powerful ways to put constraints on EBL is represented by the study of the photon-photon absorption on gamma-ray spectra of TeV blazars. Adopting this method, we found that, if the only contribution to the optical and Near Infrared (NIR) background is given by galaxies, the spectrum of the blazar H 1426+428 cannot be fitted. To reproduce the observational data of H 1426+428 a Near Infrared excess with respect to galaxy counts is required, with amplitude consistent with both the Matsumoto et al. (2000) data with Kelsall’s model of zodiacal light (ZL) subtraction and the DIRBE data with Wright’s model of ZL subtraction. The derived constraints on the optical EBL are weaker, because the experimental errors on blazar data are still bigger than the differences among various optical EBL models. In the mid-infrared the SPITZER measurement of =2.7 nW m-2 sr-1 at 24 m, provides the best fit of the blazar spectrum.
PoS(BDMH2004)
1 Introduction
The study of the Extragalactic Background Light (hereafter EBL) might provide unique information to understand many crucial astrophysical questions, including, among others, the first cosmic star formation (Salvaterra & Ferrara 2003), the evolution of galaxies and the role of dust emission (Totani & Takeuchi 2002). In this proceeding we want to show as the study of the photon-photon absorption on blazar spectra can provide a powerful method to improve our knowledge of the EBL. In Sec. 2 we summarize the present measurements and problems about EBL. In Sec. 3 we shortly describe the photon-photon absorption and our procedure. In Sec. 4 we present our findings and in Sec. 5 we report some conclusions.
2 The Extragalactic Background Light
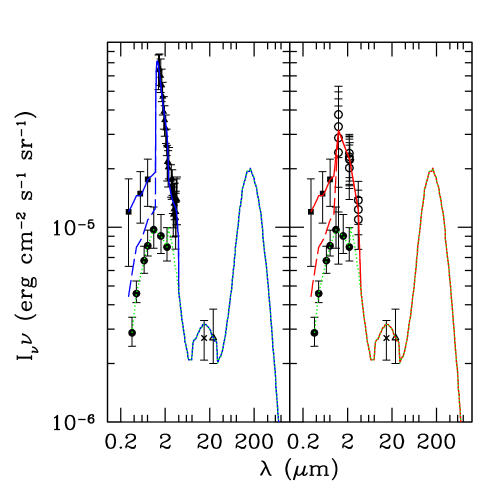
At present, our knowledge of the EBL still presents a lot of uncertainties, both in the optical and in the infrared region. Galaxy counts (Madau & Pozzetti 2000) could entirely represent the optical EBL. But Dube et al. (1979) derived an upper limit of the background flux at considerably higher than galaxy counts and, more recently, Bernstein et al. (2002) measured a significant excess at =3000, 5500, and 8000 (Fig. 1). On the other hand, this excess can not yet be confirmed, as pointed out by Mattila (2003). An analogue uncertainty about the presence of an excess affects the Near-Infrared region (hereafter NIR). The principal problem of NIR background measurements is represented by the subtraction of Zodiacal Light (hereafter ZL). The Zodiacal Light is the sunlight scattered by interplanetary dust. There are two different models of ZL light subtraction: the Kelsall model (Kelsall et al. 1998), based on the temporal variability of the ZL due to the different amounts of dust encountered by the Earth during its orbit, and the Wright model (Wright 2001 and references here), the maximal one, based on the fact that the Kelsall model seems to be unable to subtract all the ZL at some wavelengths (for example at 25 m). In the left panel of Fig. 1 we indicate the Matsumoto data (Matsumoto et al. 2000) of the NIR region, obtained subtracting the ZL contribution through the Kelsall model; while in the right panel we show the COBE/DIRBE data (Wright 2001), where the ZL has been subtracted following the Wright model. Both Matsumoto et al. and Wright data show an excess in the NIR with respect to galaxy counts, even if of different amount.
The problem of the Mid and Far-Infrared region is the small number of data. In fact the only recent data are provided by ISOCAM (Metcalfe et al. 2003), measuring a flux of nW m-2 sr-1 at 15m, and by SPITZER satellite (Papovich et al. 2004), which gives a background total flux of nW m2 sr at 24 m. At present we are waiting for new SPITZER measurements.
3 The photon-photon absorption on blazar spectra
Because of the present uncertainties about EBL direct measurements, we need an alternative approach to improve our knowledge of the Extragalactic Background Light. This alternative approach can be represented by the study of the photon-photon absorption on blazar spectra, a pair production process involving two photons whose energies, and , are related by the (approximate) formula (where is the electron rest mass). This means that, if is the energy of a photon in the TeV range of a blazar spectrum, the interacting photon should belong to the Infrared Background (, where is the wavelength of the photon of energy ). This strong relation between the energies of the interacting photons exists because the photon-photon absorption cross section for a given is a well peaked function of (Fig. 2).

The full expression of the photon-photon absorption can be written (Madau & Phinney 1996) as
| (1) |
where is the proper line element111We adopt the following
cosmological parameters:
Hubble constant =71 km s-1 Mpc-1, =0.27,
=0.73, which are in agreement with the recent WMAP
determination (Spergel et al. 2003).
,
is the speed of light and
.
In eq. 1, , being the angle between the directions of the two interacting photons. is the observed energy of the blazar photon and is the observed energy of the background photon; is the redshift of the considered blazar; finally,
is the specific number density of background photons.
The energy threshold for the interaction, , is defined by
,
where is the electron mass.
The photon-photon absorption cross section is given by
| (2) |
where is the Thompson cross section and We integrated numerically the expression 1 for different EBL models, using a three-dimensional integral based on the method of Gaussian quadratures.
The absorbed spectrum of the blazar () can be derived by the unabsorbed one (), given the relation:
| (3) |
Assuming that the unabsorbed spectrum has a power law shape222 The assumption that the unabsorbed spectrum follows a power law is valid especially in the case of the blazar we are going to analyze (H 1426+428). For other blazars the unabsorbed spectrum is better fitted by a power law with an exponential cut-off (Konopelko et al. 2003). () and calculating for various EBL models, we can derive the absorbed spectrum and compare it with observational data. Through this procedure we are able to distinguish among various EBL models. We apply this method to 5 different EBL models, reported in Table 1.
| Model | Optical Background | NIRB | MIRB-FIRB |
|---|---|---|---|
| C1 | Madau & Pozzetti (2000) | Totani & Takeuchi (2002) + SPITZERb | |
| MK1 | Madau & Pozzetti (2000) | Matsumoto et al. (2000) (K)a | Totani & Takeuchi (2002) + SPITZER |
| MK2 | Bernstein et al. (2002) | Matsumoto et al. (2000) (K) | Totani & Takeuchi (2002) + SPITZER |
| DW1 | Madau & Pozzetti (2000) | Wright (2001) (W)a | Totani & Takeuchi (2002) + SPITZER |
| DW2 | Bernstein et al. (2002) | Wright (2001) (W) | Totani & Takeuchi (2002) + SPITZER |
a(K) and (W) indicate the ZL subtraction obtained using Kelsall’s model and Wright’s model, respectively.
bTotani & Takeuchi model rescaled to the SPITZER data (Papovich et al. 2004).
4 Results
The first result we obtained adopting our method is that an EBL excess (in the optical or NIR) is required to fit the TeV spectrum of the blazar H 1426+428 (redshift ). In fact adopting the model C1, i.e. assuming that both the optical and the NIR background are represented by galaxy counts, we cannot fit the spectrum of H 1426+428, as you can see from Fig. 3 and from the test in Table 2.
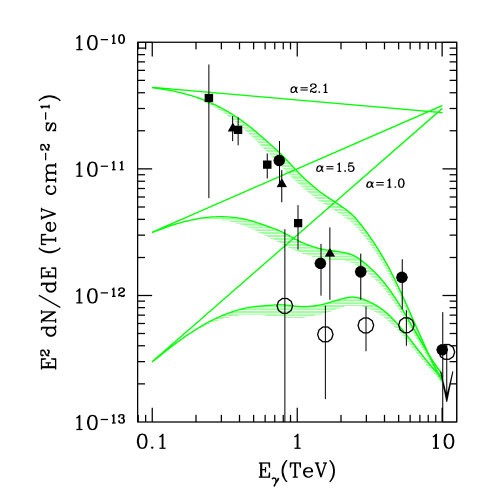
| C1 | MK1 | MK2 | DW1 | DW2 | |
| 48.00 | 18.69 | 19.71 | 6.98 | 7.41 |
We calculated the for each one of the considered models. We based our statistical analysis on 12 observational data of the spectrum of H1426+428 (CAT 1998-2000, Whipple 2001, HEGRA 1999-2000).
Then we need of an EBL excess. If we assume that this excess is in the NIR region, we can fit the spectrum of H 1426+428 (Fig. 4), both if we calculate adopting the Kelsall model of ZL subtraction for the NIR (MK1 and MK2 models) and if we calculate adopting the Wright model (DW1 and DW2). The DW1 model gives the best result, considering the (Table 2); but we cannot exclude also the other 3 cases (DW2, MK1 and MK2).
Unfortunately, our results are not conclusive concerning the existence of an optical excess. The reason is, as shown in Fig. 4, that the difference between the results obtained using only galaxy counts for the optical background and those obtained adopting the Bernstein et al. measurements is much smaller than the error bars in the observational data of the blazar spectrum.
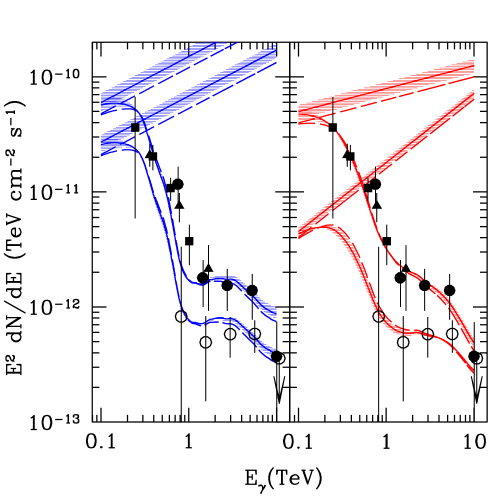
Using our method we can also derive the most likely spectral index of the blazar spectrum. In particular, if we use the DW1 model, we obtain for H 1426+428 a spectral index , in good agreement with previous results (Aharonian et al. 2003).
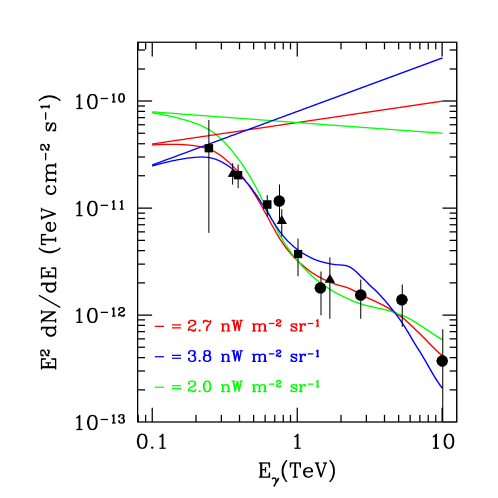
Our method can provide also some constraints on the SPITZER data, at least under the assumption that the Totani & Takeuchi (2002) model of Mid and Far Infrared is correct. Let’s consider the SPITZER measurement at 24 m (total background flux ). We obtain a good fit of the blazar spectrum only adopting the SPITZER best value; while using the upper or the lower limit of this measurement our results are not in agreement with some observational data (Fig. 5).
5 Summary
In conclusion, the most important finding of our work is that a Near Infrared excess with respect to galaxy counts must be present, if we want to explain the photon-photon absorption deduced from blazar spectra. We cannot definitely distinguish between the NIR excess derived adopting the Kelsall model of ZL subtraction and that obtained from the Wright model; but the analysis favors the latter. This result is crucial for models describing the connection between EBL and Population III stars (Salvaterra & Ferrara 2003). In fact these models, which explain the EBL in the Near Infrared region as the radiation emitted by high metal free stars and redshifted in the infrared region, are in agreement with the existence of a NIR excess with respect to galaxy counts.
Our work presents also a lot of challenges. First of all we need new measurements in the 0.1-1 TeV range of the spectrum of H 1426+428, because this region is crucial to distinguish among various optical background models. These new measurements could be provided by new Cherenkov telescopes, which are already at work (MAGIC, VERITAS, HESS) or will be operating in a few years (GLAST). We need also new spectra of other high redshift blazars, because now our analysis is based on only one blazar (H 1426+428). In particular, there are at least two TeV blazars with redshift similar (PKS 2155-304 at ) or higher (1ES 2344+514 at ) than H1426+428; but the data which are available for these blazars (Roberts et al. 1998, Catanese et al. 1998) are not sufficiently accurate for our analysis. Finally, we need also new SPITZER data, to improve our knowledge of the Mid and Far Infrared background.
References
- [1] Aharonian F. et al., Observations of H1426+428 with HEGRA. Observations in 2002 and reanalysis of 1999& 2000 data, 2003, A&A, 403, 523 [astro-ph/0301437]
- [2] Bernstein R. A., Freedman W. L. & Madore B. F., The First Detections of the Extragalactic Background Light at 3000, 5500, and 8000 . I. Results, 2002, ApJ, 571, 56 [astro-ph/0112153]
- [3] Catanese M. et al., Discovery of Gamma-Ray Emission above 350 GeV from the BL Lacertae Object 1ES 2344+514, 1998, ApJ, 501, 616 [astro-ph/9712325]
- [4] Dube R. R., Wickes W. C. & Wilkinson D. T., Upper limit on the EBL, 1979, ApJ, 232, 333
- [5] Kelsall T. et al., Model of the Interplanetary Dust Cloud, 1998, ApJ, 508, 44 [astro-ph/9806250]
- [6] Konopelko A. et al., Modeling the TeV Gamma-Ray Spectra of Two Low-Redshift Active Galactic Nuclei: Mkn 501 and Mkn 421 [astro-ph/0302049]
- [7] Madau P. & Pozzetti L., Deep galaxy counts, extragalactic background light and the stellar baryon budget, 2000, MNRAS, 312, 9 [astro-ph/9907315]
- [8] Mapelli M., Salvaterra R. & Ferrara A., Gamma-ray constraints on the infrared background excess [astro-ph/0410615]
- [9] Matsumoto T. et al., NIR Extragalactic Background, 2000, Lecture Notes in Physics, vol. 548, p.96
- [10] Mattila K., Has the Optical EBL Been Detected?, 2003, ApJ, 591, 11 [astro-ph/0303196]
- [11] Metcalfe L. et al., An ISOCAM survey through gravitationally lensing galaxy clusters, 2003, A&A, 407,791 [astro-ph/0305400]
- [12] Papovich C. et al., The 24 Micron Source Counts in Deep Spitzer Space Telescope Surveys, 2004, ApJ, 154, 70 [astro-ph/0406035]
- [13] Roberts M. D. et al., TeV gamma-ray observations of southern BL Lacs with the CANGAROO 3.8m Imaging Telescope, 1998, A&A, 337, 25 [astro-ph/9811260]
- [14] Salvaterra R. & Ferrara A., The imprint of the cosmic dark ages on the near-infrared background, 2003, MNRAS, 339, 973 [astro-ph/0302285]
- [15] Spergel et al., First-Year Wilkinson Microwave Anisotropy Probe (WMAP) Observations: Determination of Cosmological Parameters, 2003, ApJ, 148, 175 [
- [16] Totani, T. & Takeuchi, T. T., A Bridge from Optical to Infrared Galaxies: Explaining Local Properties and Predicting Galaxy Counts and the Cosmic Background Radiation, 2002, ApJ, 570, 470 [astro-ph/0201277]
- [17] Wright E. L., DIRBE minus 2MASS: Confirming the Cosmic Infrared Background at 2.2 Microns, 2001, ApJ, 553, 538 [astro-ph/0004192]