Single star-forming galaxies and star-forming galaxies in SF + SF and mixed pairs
Abstract
We compare the SFR of single star-forming galaxies with the SFR of star-forming galaxies in pairs. Volume-limited samples are compared selected from the 2dFGRS, applying a maximum magnitude difference criterion. We show that SF galaxies in SF + SF pairs typically increase their SFR as they get fainter, whereas this does not happen for SF galaxies in mixed (SF + passive) pairs. And we provide evidence that differences between single SF and SF in pairs get more significant when SF galaxies in mixed pairs are excluded from the pair sample. Our analysis confirms that enhanced SFR and the presence of a companion galaxy (on 0.5 Mpc scale) are correlated quantities, provided the galaxy is neither too luminous nor too faint, and the triggering galaxy is itself a SF galaxy.
1 Introduction
It is known that the star formation rate (SFR) of galaxies decreases as galaxies get more luminous and older, and that star formation is inhibited in dense environments such as rich groups and clusters (Lewis et al. 2002, Gomez et al. 2003). In contrast, galaxy-galaxy interactions seem to be powerful mechanisms to trigger the SFR. It is clear that interactions occur, however the frequency of these events, and the distribution of galaxy luminosities (and masses) involved has yet to be established. Isolating the relevant quantity that distinguishes between single and pair systems is not straightforward. Distance to the companion is argued as being the fundamental factor, and an extremely close companion has been shown to enhance the SFR of galaxies significantly (Lambas et al. 2003, Barton et al. 2003, Nikolic et al. 2004). However, such close companions are rare in the present universe, meaning that this kind of interaction is not a relevant phenomenon for the galaxy population as a whole (Bergvall et al. 2003). In this study we allow a distance as large as 0.5 Mpc between pair members.
2 Sample selection criteria
Each 2dF galaxy spectrum is typed on the basis of the relative strength of its first two principal components, which are the emission and the absorption components within the spectrum. The parameter is the linear combination of these two components (Madgwick et al. 2002). Low are typically early type galaxies, high late type galaxies. Qualitatively is an indicator of the ratio of the present to the past star formation activity of each galaxy. To separate passive from star-forming galaxies we divide our sample at = -1.4, as in Madgwick et al. (2003):
- -1.4
-
==¿ Passive
- -1.4
-
==¿ Star-Forming
The single SF and the pair SF galaxy samples have been selected from the 2dFGRS applying the following criteria:
- pair
-
1 companion galaxy within 500kpc projected distance and 1000km/s depth. No further companion within [0.5 - 1.0]Mpc projected distance and 1000 km/s depth.
- single
-
no companion galaxy within 500kpc projected distance and 1000km/s depth. No further companion within [0.5 - 1.0]Mpc projected distance and 1000 km/s depth
The large search radius used to find companions allows us to select samples of single and pair galaxies that are large. The request for no companions in the [0.5 - 1]Mpc region, for both samples, reduces contamination by single and pair galaxies located in groups and avoids misinterpretation between the triggering effect of one single companion and the triggering effect of multiple interactions. It has been shown (Alonso et al. 2004) that pairs embedded within groups have a lower SF activity than other group members.
Companions are here counted applying a maximum magnitude criterion: all galaxies that are in a 2-magnitude bin, ranging from the absolute magnitude of the galaxy itself to 2 magnitudes fainter, are counted as companions. To cover the same depth in absolute magnitude space around each SF galaxy, only galaxies enter the samples that would still be in the 2dF if they were 2 magnitudes fainter.
To avoid a selection bias, comparison between single SF and SF galaxies in pairs is performed using 10 different volume limited samples, covering a 1-Magnitude range each. The parameter is used to compute k-corrections (Madgwick et al. 2002), that are then applied to each galaxy individually to derive its absolute magnitude. A flat Lambda cosmology is assumed throughout with M=0.3, Λ=0.7 and h = H/75 km s-1 Mpc-1.
3 Single SF galaxies and SF galaxies in pairs
In Table 1 we list the number of SF galaxies and the median, upper quartile and lower quartile of the distributions, for single and pair samples. The fraction of SF galaxies in pairs (normalized to the sum of SF galaxies in single and pair systems) is 30% in all, but the faintest and brightest volume limited samples, where it decreases to 20%.
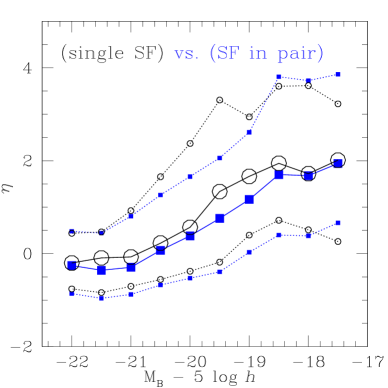
In Figure 1 we plot as a function of absolute magnitude, for single SF galaxies (squares) and for SF galaxies in pairs (circles). It clearly emerges that differences between single and pair samples are definitely modest when compared to differences that both samples undergo because of the dramatic effect of luminosity on the SFR of galaxies. Nevertheless, Figure 1 indicates that the median SFR of SF galaxies in pairs, is either similar or above the median values for single SF galaxies.
We use the KS test to eveluate how significant differences are between single SF galaxies and SF galaxies in pairs. We perform the comparison in each volume-limited sample separately. The null hypothesis that the single SF and the SF in pair samples are drawn from the same parent distribution can be rejected with a significance level that is listed in column 2 in Table 3.
The KS test indicates that, in general, we cannot reject the hypothesis that single SF galaxies and SF galaxies in pairs are drawn from the same parent population. The 2 significance level is reached in 2 samples only, namely the [–19.0 –20.0] and the [–19.5 –20.0] ones.
4 SF galaxies in SF + SF and mixed pairs
To check whether the triggering effect of a companion galaxy is linked to the spectral-type of the companion itself, we next compare SF galaxies whose companion is another SF galaxy with SF galaxies whose companion is a passive galaxy.
In Table 2 the number of SF galaxies in SF + SF pairs and the number of SF galaxies in SF + passive pairs is listed, for each volume-limited sample. The incidence of mixed pairs is generally small in intermediate luminous samples, and definitely negligible in faint (M - 5logh –19) samples. In general we expect the incidence of mixed pairs to be low, due to our choice to select ’isolated’ single and pair systems (no companion in the 0.5-1.0 h-1Mpc region).
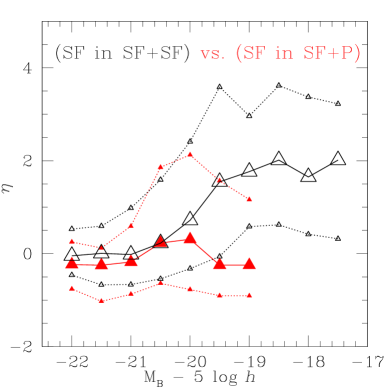
Figure 2 shows median values only for samples that include a minimum of 10 sources. Figure 2 shows that SF galaxies in SF + SF pairs (empty triangles) typically increase their SFR as they get fainter, whereas this does not happen for SF galaxies in mixed (SF + passive) pairs (filled triangles). Figure 2 thus provides evidence that a passive companion does not trigger star formation as efficiently as a SF companion. However, the spectral-type of the companion appears to relate to the average SFR in intermediate luminous samples only, not in the more luminous ones. Our results can be compared with those of Nikolic et al. (2004). They have investigate the effect of galaxy interaction on star formation using the SDSS, and find no dependence of star formation enhancement on the morphological type or mass of the companion galaxy.
5 Single SF galaxies and SF galaxies in SF + SF pairs
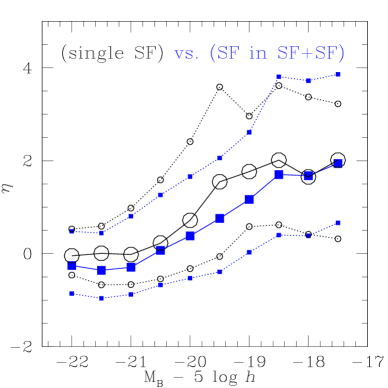
Having shown that the triggering effect of passive and SF companions is different, we next investigate whether differences between single SF galaxies and SF galaxies in pairs get more significant when SF galaxies in mixed pairs are excluded from the pair sample. Figure 3 is the equivalent of Fig. 1 for SF galaxies in SF + SF pairs only. Comparison with Fig.1 reveals that differences between median values get more pronounced.
Again we apply the KS test to evaluate how significant differences are. The null hypothesis that the single SF and the SF in the SF + SF samples are drawn from the same parent population can be rejected with a significance level that is listed in column 3 in Table 3. Differences are significant at 3 c.l. in the [–19.0 –20.0] sample, and at the 2 c.l. in the [–18.5 –19.5], [–19.5 –20.5], [–20.5 –21.5] and [–21.0 –22.0] samples. Differences between single SF and pair SF galaxies are not significant, however, when faint or extremely bright samples are compared.
Comparing single SF with SF + SF pairs improves differences between single and pair samples in as many as 4 cases (out of 6 among those having LKS1). We conclude that, when excluding SF galaxies in mixed pairs, the SFR of SF galaxies in pairs is larger than the SFR of the single SF galaxies.
| Magnitude range | Single SF | 111 | SF in pair | |
|---|---|---|---|---|
| –17.0 –18.0 | 71 | 1.939 / 0.662 / 3.858 | 18 | 2.012 / 0.260 / 3.223 |
| –17.5 –18.5 | 113 | 1.677 / 0.384 / 3.721 | 48 | 1.720 / 0.511 / 3.614 |
| –18.0 –19.0 | 194 | 1.701 / 0.401 / 3.807 | 97 | 1.944 / 0.718 / 3.602 |
| –18.5 –19.5 | 300 | 1.165 / 0.030 / 2.611 | 128 | 1.663 / 0.399 / 2.942 |
| –19.0 –20.0 | 433 | 0.758 / -0.393 / 2.058 | 160 | 1.336 / -0.183 / 3.305 |
| –19.5 –20.5 | 635 | 0.381 / -0.527 / 1.658 | 234 | 0.566 / -0.392 / 2.369 |
| –20.0 –21.0 | 605 | 0.071 / -0.674 / 1.262 | 252 | 0.227 / -0.554 / 1.653 |
| –20.5 –21.5 | 428 | -0.293 / -0.878 / 0.805 | 176 | -0.072 / -0.704 / 0.925 |
| –21.0 –22.0 | 253 | -0.358 / -0.961 / 0.443 | 98 | -0.092 / -0.837/ 0.466 |
| –21.5 –22.5 | 113 | -0.256 / -0.860 / 0.481 | 32 | -0.201 / -0.759 / 0.439 |
| Magnitude range | SF + SF | SF + Passive | ||
|---|---|---|---|---|
| –17.0 –18.0 | 17 | 2.012 / 0.318 / 3.222 | 1 | - - - |
| –17.5 –18.5 | 46 | 1.651 / 0.416 / 3.371 | 2 | - - - |
| –18.0 –19.0 | 94 | 2.012 / 0.620 / 3.614 | 3 | - - - |
| –18.5 –19.5 | 118 | 1.764 / 0.581 / 2.960 | 10 | -0.246/ -0.906 / 1.164 |
| –19.0 –20.0 | 135 | 1.546 / -0.062 / 3.586 | 25 | -0.247/ -0.906 / 1.566 |
| –19.5 –20.5 | 188 | 0.717 / -0.322 / 2.410 | 46 | 0.309 / -0.772 / 2.125 |
| –20.0 –21.0 | 188 | 0.227 / -0.543 / 1.587 | 64 | 0.230 / -0.640 / 1.858 |
| –20.5 –21.5 | 132 | -0.020 / -0.665 / 0.979 | 44 | -0.180 / -0.873 / 0.591 |
| –21.0 –22.0 | 65 | 0.007 / -0.672 / 0.593 | 33 | -0.250 / -1.027 / 0.120 |
| –21.5 –22.5 | 20 | -0.046 / -0.460 / 0.529 | 12 | -0.234 / -0.759 / 0.251 |
| Magnitude range | SF single vs. SF in pair LKS | SF single vs. SF + SF LKS |
|---|---|---|
| –17.0 –18.0 | 1 | |
| –17.5 –18.5 | ||
| –18.0 –19.0 | ||
| –18.5 –19.5 | 1 | 2 |
| –19.0 –20.0 | 2 | 3 |
| –19.5 –20.5 | 2 | 2 |
| –20.0 –21.0 | 1 | 1 |
| –20.5 –21.5 | 1 | 2 |
| –21.0 –22.0 | 1 | 2 |
| –21.5 –22.5 | 1 | 1 |
6 References
Alonso M.S., Tissera P., Coldweel G. & Lambas D.G. 2004, MNRAS, 352, 1081
Barton E., Geller M.J. & Kenyon S.J. 2003, ApJ, 582, 668
Bergvall N., Laurikainen E. & Aalto S. 2003, A&A, 405, 31
Gomez P.L., Nichol R.C., Miller C.J et al. 2003, ApJ, 584, 210
Lambas D.G., Tissera P.B., Alonso M.S., Coldwell G. 2003, MNRAS, 346, 1189
Lewis I., Balogh M., De Propris R. et al. 2002, MNRAS, 334, 673
Madgwick D.S., Lahav O., Baldry I.K. et al. 2002, MNRAS, 333, 133
Madgwick D.S., Hawkins E., Lahav O. et al. 2003, MNRAS, 344, 847
Nikolic B., Cullen H. & Alexander P. 2004, [astro-ph/0407289]