The -band intensity profile of R Leonis probed by VLTI/VINCI ††thanks: Based on public commissioning data released from the ESO VLTI (www.eso.org/projects/vlti/instru/vinci/vinci_data_sets.html).
We present near-infrared -band interferometric measurements of the Mira star R Leonis obtained in April 2001 and January 2002 with the VLTI, the commissioning instrument VINCI, and the two test siderostats. These epochs correspond to near-maximum stellar variability phases 0.08 and 1.02 (one cycle later), respectively. The April 2001 data cover a range of spatial frequencies (31–35 cycles/arcsecond) within the first lobe of the visibility function. These measurements indicate a center-to-limb intensity variation (CLV) that is clearly different from a uniform disk (UD) intensity profile. We show that these measured visibility values are consistent with predictions from recent self-excited dynamic Mira model atmospheres that include molecular shells close to continuum-forming layers. We derive high-precision Rosseland diameters of mas and mas for the April 2001 and January 2002 data, respectively. Together with literature estimates of the distance and the bolometric flux, these values correspond to linear radii of R⊙ and R⊙, and to effective temperatures of K and K, respectively.
Key Words.:
Techniques: interferometric – Stars: late-type – Stars: AGB and post-AGB – Stars: atmospheres – Stars: fundamental parameters – Stars: individual: R Leo1 Introduction
R Leo is one of the brightest, apparently largest, and hence best studied Mira variable stars. Mira stars are cool, low-mass, pulsating variables that are located on the asymptotic giant branch of the Hertzsprung-Russell diagram and that exhibit a conspicuous mass-loss. Because of to the low temperatures, molecules are present in their extended atmospheres, and dust is formed at larger distances from the star. High resolution techniques at optical/infrared wavelengths, such as speckle interferometry, masked aperture techniques, lunar occultation measurements, and long-baseline interferometry, allow the measurement of the stellar radii, the center-to-limb intensity variations (CLV) including the effects of molecular layers, and the dust envelopes. For instance, Mira star diameters and CLVs have been measured by, e.g., Di Giacomo (digiacomo (1991)), Haniff et al. (haniff (1995)), Burns et al. burns (1998), Perrin et al. (perrin (1999)), Young et al. (young (2000)), Hofmann et al. (hofmann (2001)), Hofmann et al. (hofmann02 (2002)), Woodruff et al (woodruff (2004)), Perrin et al. (perrin2004 (2004)). Works by, e.g., Danchi et al. (danchi (1994)), Bedding et al. (bedding (2001)), Monnier et al. (monnier (2004)), Ohnaka et al. (ohnaka (2004)) also include characterizations of circumstellar dust shells. For non-variable giants up to at least spectral type M 4, it was shown that observed and model-predicted visibility curves do not differ significantly from those of uniform disk (UD) profiles up to the first minimum, but result in a diameter that is different by a few percent at near-infrared wavelengths (see, e.g the discussions in Wittkowski et al. WHJ:01 (2001, 2004)). For Mira stars, however, it was observed that the visibility function may deviate already in its first lobe from a UD curve, indicating a two- or multi-component, or Gaussian-shaped intensity profile. Theoretical models including the effects of molecular shells have been created that can explain such CLVs. For more detailed discussions on these topics, see the reviews by Scholz (Scholz98 (1998), Scholz03 (2003)), and also Scholz (Scholz01 (2001)), as well as the references given above. In particular, the P and M self-excited dynamic atmosphere model series by Hofmann et al. (HSW98 (1998)), Tej et al. (2003b ), Ireland et al. (2004a ; 2004b ), have been designed to match the well-studied nearby Miras Cet and R Leo. These series are based on fundamental mode pulsation models. The comparison of theoretical pulsation models with MACHO observations of long-period variables in the LMC (Wood et al. wood (1999)), pulsation velocities derived from Doppler line profiles (Scholz & Wood scholzwood (2000)), as well as recent detailed analyses of interferometric radius measurements (for instance, Mennesson et al. mennesson (2002), Woodruff et al. woodruff (2004), Perrin et al. perrin2004 (2004)) strongly indicate that Mira stars are fundamental mode pulsators.
Earlier diameter estimates of Mira stars which suggested overtone pulsation very likely overestimated the true photospheric diameter due to the effects of molecular layers at larger distances from the star (cf. for instance the discussions in Jacob & Scholz JS02 (2002); Mennesson et al. mennesson (2002); van Belle et al. vanbelle2 (2002); Woodruff et al. woodruff (2004); Ireland et al. 2004a ; 2004b ; Perrin et al. perrin2004 (2004)). In addition, distances to Mira stars are often not known with a high precision since the parallax is typically only a fraction of the stellar angular diameter. This leads to an additional uncertainty when comparing measured Mira star radii to theoretical radius-period relations. Note, however, that the pulsation mode determination in Wood et al. (wood (1999)) depends mainly on the period ratios in multiperiodic long-period variables. Since period ratios are unaffected by uncertainties in distance or angular diameter measurements, this mode determination should be robust.
Often, interferometric measurements cannot probe the CLV in detail owing to sparse coverage of the -plane. In these cases, filter-specific uniform disk radii are often transformed into physically more meaningful Rosseland or continuum radii using available Mira star atmosphere models (e.g. van Belle et al. vanbelle1 (1996, 2002); Hofmann et al. hofmann02 (2002); Boboltz & Wittkowski BW (2004)). Detailed tests of Mira star atmosphere models at different stellar variability phases are desirable in order to increase the confidence in using them for such purposes. Recently, Woodruff et al. (woodruff (2004)) have shown that their near-infrared -band interferometric observations of Cet indicate a CLV that differs from a UD profile, and that is consistent with CLV predictions by the P and M model series mentioned above.
In this paper, we present a comparison of near-infrared -band VLTI/VINCI interferometric observations of R Leo with predictions by the P and M model series.
R Leo is an oxygen-rich Mira star with spectral type M6e-M8IIIe-M9.5e, a period of 310 days, a magnitude of 4.4-11.3 (Kholopov et al. kholopov (1998)), and a mass-loss rate of 1 M⊙/yr (Danchi et al. danchi (1994), Knapp et al. knapp (1998)). Sloan & Price (sloan (1998)) measured a relatively low dust emission coefficient of 0.23, i.e. the ratio of the total emission of the dust to the total emission of the star in the mid-infrared. We use a parallax value of mas as given by Whitelock & Feast (WF (2000)), which is the weighted average of the values by Gatewood (gatewood (1992)) and Perryman & ESA (esa (1997)). Whitelock et al. (whitelock (2000)) derived a mean bolometric magnitude =0.65 with total (peak-to-peak) amplitude =0.63. Previous measurements of the -band diameter of R Leo are listed in Table 1, together with the visual phases at the time of the observations.
| [mas] | Reference | |
|---|---|---|
| 33.10 1.30 | 0.18 | Di Giacomo et al. (digiacomo (1991)) |
| 28.18 0.05 | 0.24 | Perrin et al. (perrin (1999)) |
| 30.68 0.05 | 1.28 | Perrin et al. (perrin (1999)) |
| 34.00 2.00 | 0.44 | Tej et al. (tej99 (1999)) |
| 30.00 0.30 | 0.71 | Monnier et al. (monnier (2004)) |
2 Observations and data reduction
| UT | Sp. freq | az | # | ||
| [1/′′] | [deg] | ||||
| 1 April 2001 | |||||
| 02:25:26 | 34.93 | 72.86 | 5.07e-02 | 2.46e-03 | 389 |
| 02:35:12 | 34.95 | 72.39 | 5.40e-02 | 2.86e-03 | 306 |
| 3 April 2001 | |||||
| 00:36:01 | 31.39 | 76.30 | 8.14e-02 | 4.08e-03 | 388 |
| 00:40:13 | 31.66 | 76.21 | 8.13e-02 | 4.56e-03 | 332 |
| 00:44:27 | 31.91 | 76.11 | 7.65e-02 | 3.76e-03 | 391 |
| 00:49:06 | 32.18 | 76.00 | 7.55e-02 | 3.78e-03 | 374 |
| 00:53:45 | 32.44 | 75.88 | 7.21e-02 | 3.58e-03 | 389 |
| 00:58:31 | 32.69 | 75.76 | 7.10e-02 | 3.52e-03 | 383 |
| 01:03:09 | 32.92 | 75.63 | 6.99e-02 | 3.48e-03 | 379 |
| 01:08:14 | 33.17 | 75.48 | 6.37e-02 | 3.16e-03 | 386 |
| 01:12:44 | 33.36 | 75.35 | 6.09e-02 | 3.01e-03 | 380 |
| 01:17:27 | 33.56 | 75.21 | 6.07e-02 | 3.03e-03 | 379 |
| 01:21:18 | 33.71 | 75.08 | 5.85e-02 | 3.20e-03 | 338 |
| 01:25:35 | 33.87 | 74.94 | 5.63e-02 | 2.79e-03 | 387 |
| 01:30:12 | 34.03 | 74.79 | 5.63e-02 | 2.79e-03 | 387 |
| 01:34:37 | 34.17 | 74.63 | 5.06e-02 | 3.18e-03 | 146 |
| 01:38:50 | 34.29 | 74.48 | 5.32e-02 | 2.58e-03 | 382 |
| 01:42:36 | 34.40 | 74.34 | 5.42e-02 | 2.83e-03 | 371 |
| 01:47:20 | 34.51 | 74.16 | 5.10e-02 | 2.46e-03 | 388 |
| 01:51:09 | 34.60 | 74.01 | 5.15e-02 | 2.62e-03 | 386 |
| 01:55:20 | 34.67 | 73.84 | 4.99e-02 | 2.41e-03 | 387 |
| 01:59:10 | 34.74 | 73.68 | 4.95e-02 | 2.56e-03 | 376 |
| 02:03:24 | 34.80 | 73.50 | 4.89e-02 | 2.36e-03 | 394 |
| 02:07:14 | 34.85 | 73.33 | 4.88e-02 | 2.46e-03 | 383 |
| 02:13:10 | 34.90 | 73.06 | 4.80e-02 | 2.31e-03 | 393 |
| 02:16:57 | 34.93 | 72.89 | 4.85e-02 | 2.44e-03 | 387 |
| 02:21:09 | 34.94 | 72.69 | 4.72e-02 | 2.27e-03 | 389 |
| 02:42:02 | 34.88 | 71.62 | 4.85e-02 | 2.33e-03 | 391 |
| 02:45:46 | 34.84 | 71.41 | 4.91e-02 | 2.50e-03 | 382 |
| 02:50:36 | 34.78 | 71.14 | 4.96e-02 | 2.38e-03 | 391 |
| 02:54:38 | 34.71 | 70.90 | 4.88e-02 | 2.45e-03 | 384 |
| 02:58:43 | 34.64 | 70.66 | 5.02e-02 | 2.42e-03 | 269 |
| 20 January 2002 | |||||
| 06:22:56 | 34.18 | 74.62 | 8.73e-02 | 1.65e-03 | 453 |
| 06:29:14 | 34.36 | 74.39 | 8.67e-02 | 4.45e-03 | 285 |
| 07:20:33 | 34.94 | 72.12 | 7.93e-02 | 1.44e-03 | 487 |
| 07:26:12 | 34.91 | 71.82 | 7.87e-02 | 1.47e-03 | 466 |
The R Leo interferometric data were obtained on 1 & 3 April 2001 (JD=2452003, stellar phase ) and on 20 January 2002 (JD=2452295, ) with the ESO Very Large Telescope Interferometer (VLTI) equipped with the -band commissioning instrument VINCI (Kervella et al. kervella1 (2003)). The VLTI test siderostats were used on stations E0 and G0 forming an unprojected ground baseline length of 16 m. These data were obtained in the early commissioning phase of the VLTI, and are publicly available from the ESO archive. Figure 1 shows the visual lightcurve for the cycles covering our observation dates, as obtained from the AAVSO (Waagen AAVSO (2004)) and AFOEV (operated by CDS) databases. Indicated are the dates of our observations as well as the dates of maximum visual light, as given by the AFOEV database for these cycles. It shows a cycle-to-cycle variation from our first to our second epoch of 0.5 mag near the maxima. Note that the post-minimum “bump” which is predicted by self-excited pulsation models (Hofmann et al. HSW98 (1998); Ireland et al. 2004a ; 2004b ) is clearly seen in Fig. 1. Tab. 2 lists the details of our observations together with the obtained calibrated squared visibility amplitudes and their errors.

Data were obtained as a series of, typically, 500 interferograms with scan lengths of 250 m and fringe frequencies of 295 Hz and 415 Hz. Mean coherence factors were computed using the VINCI data reduction software, version 3.0, as described by Kervella et al. (kervella2 (2004)), employing the results based on the wavelets power spectral density. The stars $α$ Hya (-band UD diameter mas, using the calibration by Dyck et al. dyck (1996)), $δ$ Oph ( mas, Bordé et al. borde (2002)), $θ$ Cen ( mas, Bordé et al. borde (2002)), and $υ$ Cet ( mas, after Dyck et al. dyck (1996)) were used as calibration stars. The calibration of the visibility values was performed as described in Wittkowski et al. (WAK:04 (2004)), using a weighted average of all transfer function values obtained during the night. R Leo data were calibrated using calibration star data obtained with the same fringe frequency while the transfer function errors were computed using all available values. The listed errors of the calibrated squared visibility values include the uncertainties of the adopted calibration stars’ diameters, the variation of the transfer function over the night, as well as the scatter of the single scans’ coherence factors. For the night 3 April 2001, all calibration star data were obtained after all R Leo observations. This may cause an additional systematic error of the calibrated visibility values which is not included in the listed error bars. However, it is very unlikely that such an additional calibration uncertainty is larger than the error bars shown. All observations cover a narrow range of azimuth angles of the projected baseline (70-76 deg. E of N), and hence are not sensitive to possible asymmetries. The VINCI sensitivity function covers the range 1.9 to 2.5 m. The effective wavelength of our R Leo observations is 2.22 m.
In order to derive effective temperatures from the measured angular radius and the bolometric flux (see Sect. 3 below), we use the mean bolometric magnitude and its amplitude given by Whitelock et al. (whitelock (2000)). For the stellar phases 0.08 and 1.02 of our observations, we derive bolometric fluxes of erg cm-2 s-1, and erg cm-2 s-1, respectively. Errors of 30% are considered, taking into account cycle-to-cycle variations and the uncertainty of the estimate at phases 0.08 and 1.02.
3 Results and comparison to models
| Model | ||||||||||
| [mas] | [mas] | [mas] | [mas] | [] | [K] | |||||
| 1 & 3 April 2001, | ||||||||||
| P10 | -0.08 | 28.9 | 0.03 | 29.1 | 0.03 | 1.86 | 352 | 2906 | 1.42 | 0.93 |
| P11n | +0.02 | 28.7 | 0.01 | 29.2 | 0.00 | 1.56 | 350 | 2916 | 1.25 | 0.98 |
| P20 | -0.09 | 27.7 | 0.05 | 27.7 | 0.05 | 0.41 | 337 | 2968 | 1.35 | 0.97 |
| P21n | +0.03 | 28.0 | 0.05 | 27.5 | 0.05 | 0.57 | 341 | 2952 | 1.15 | 1.06 |
| P22 | +0.10 | 28.6 | 0.05 | 27.3 | 0.05 | 0.37 | 348 | 2921 | 1.10 | 1.11 |
| P30 | -0.10 | 29.0 | 0.04 | 29.3 | 0.04 | 1.29 | 353 | 2901 | 1.30 | 0.95 |
| P40 | -0.08 | 28.2 | 0.03 | 27.9 | 0.03 | 0.56 | 344 | 2942 | 1.22 | 1.02 |
| M10 | -0.06 | 28.6 | 0.03 | 28.3 | 0.03 | 1.65 | 348 | 2921 | 1.13 | 1.06 |
| M11n | +0.03 | 28.2 | 0.04 | 27.1 | 0.04 | 1.05 | 344 | 2942 | 1.05 | 1.14 |
| M20 | -0.03 | 28.6 | 0.04 | 27.9 | 0.03 | 1.32 | 348 | 2921 | 1.09 | 1.10 |
| M21n | +0.02 | 28.6 | 0.04 | 27.5 | 0.03 | 1.26 | 348 | 2921 | 1.06 | 1.15 |
| Avg. | -0.02 | 28.5 0.4 | 0.03 | 28.1 0.8 | 0.03 | |||||
| 20 January 2002, | ||||||||||
| P10 | -0.02 | 26.8 | 0.03 | 27.1 | 0.04 | 0.09 | 327 | 3042 | 1.32 | 0.97 |
| P11n | +0.08 | 26.6 | 0.12 | 27.0 | 0.12 | 0.08 | 324 | 3054 | 1.15 | 1.02 |
| P20 | -0.03 | 24.8 | 0.19 | 24.8 | 0.19 | 0.12 | 303 | 3163 | 1.21 | 1.03 |
| P21n | +0.09 | 25.0 | 0.18 | 24.6 | 0.18 | 0.10 | 305 | 3150 | 1.03 | 1.13 |
| P30 | -0.04 | 26.8 | 0.12 | 27.1 | 0.12 | 0.06 | 327 | 3043 | 1.20 | 0.99 |
| P40 | -0.02 | 25.9 | 0.13 | 25.6 | 0.13 | 0.03 | 316 | 3095 | 1.12 | 1.08 |
| M10 | -0.00 | 26.5 | 0.12 | 26.3 | 0.12 | 0.08 | 323 | 3060 | 1.04 | 1.11 |
| M11n | +0.09 | 26.1 | 0.11 | 25.0 | 0.11 | 0.05 | 318 | 3083 | 0.97 | 1.19 |
| M20 | +0.03 | 26.5 | 0.12 | 25.8 | 0.12 | 0.06 | 323 | 3060 | 1.01 | 1.15 |
| M21n | +0.08 | 26.5 | 0.12 | 25.4 | 0.11 | 0.06 | 323 | 3060 | 0.99 | 1.20 |
| Avg. | +0.03 | 26.2 0.7 | 0.12 | 25.9 0.9 | 0.12 | |||||
Our measured R Leo squared visibility amplitudes are shown in Figs. 2 and 3, together with a typical model prediction for each epoch based on the P and M model series by Hofmann et al. (HSW98 (1998)), Tej et al. (2003b ), and Ireland et al. (2004a ; 2004b ). A detailed description of the models and the calculation of synthetic visibility values follows below. The visibility curves for UD intensity profiles with best fitting UD diameters are shown as well. The obtained UD diameters and their formal errors for the April 2001 and January 2002 data are mas and mas, with reduced values of 2.47 and 0.14, respectively.
The April 2001 data were obtained for a relatively wide range of projected baseline lengths (spatial frequencies between 31 and 35 cycles/arcsecond) while the azimuth angle of the projected baseline changed only marginally, thanks to the position of the star on the sky. This allows the study of the CLV without the often inherent simultaneous change of baseline angle and resulting confusion with possible asymmetries. These data show that R Leo’s CLV at this epoch significantly deviates from a UD intensity profile. The January 2002 data cover only a much smaller range of spatial frequencies between 34 and 35 cycles/arcsecond, and do not allow a discrimination of UD and more complex intensity profiles.
The P and M model series are complete self-excited dynamic model atmospheres that were created to match the parameters of the best studied Mira variables Cet and R Leo. These series are based on fundamental mode pulsation. First-overtone pulsation models, such as the O model series of Hofmann et al. (HSW98 (1998)) are not considered since recent results indicate that Mira stars are fundamental mode pulsators (see Introduction). For the details of the model calculations, including assumptions and approximations, we refer to Hofmann et al. (HSW98 (1998)). The P and M series differ with respect to the mass of the so-called “parent star”, which is a hypothetical non-pulsating giant that has the same mass and luminosity as the Mira variable. The geometric pulsation of the Mira occurs around the parent’s star Rosseland radius (e.g. Ireland et al. 2004a ; 2004b ). The parent star of the here considered P and M series has solar metallicity, luminosity =3470, period 332 days, mass =1.0 (P series) and 1.2 (M), radius =241 (P) and 260 (M) (Hofmann et al. HSW98 (1998)). The moderately larger radius of the M-series parent star leads to a slightly lower effective temperature of the parent star and systematically lower phase-dependent effective temperatures of the pulsating Mira compared to the P series (see the discussion in Ireland et al. 2004b ). The M models tend to exhibit less pronounced cycle-to-cycle variations than the P models and to have more compact atmospheres resulting in only moderate differences of K-band contamination but larger differences of high-layer absorption features (cf. Hofmann et al. HSW98 (1998); Ireland et al. 2004a ; 2004b ).
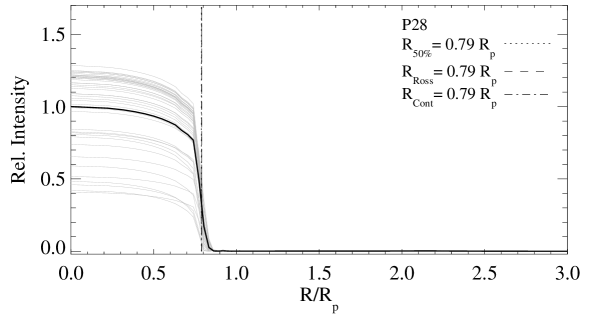
These models are available for 25 phase and cycle combinations for the P series (see Ireland et al. 2004a ), and for 20 combinations for the M series (see Ireland et al. 2004b ). The models include molecular shells close to continuum-forming layers. The model studies by Ireland et al. (2004a , 2004b ) show that the true continuum CLVs are relatively close to UD profiles and follow a sinusoidal diameter variation as a function of photometric stellar phase. For observations with broad near-continuum bandpasses in the near-IR that include molecular (mainly water) lines, the molecular shells lead to tail-like or protrusion-like extensions of the CLV and to deviations from the sinusoidal diameter variation (cf. Tej et al. 2003a ). This effect due to molecular shells is smallest at pre-maximum phases ( 0.8) of the photometric variability when continuum photons are mostly generated in a narrow region just below the strong shock emerging from the stellar interior. At these phases, effective temperatures are highest, and the visibility curves for broad bandpasses are expected to be very close to UD curves up to the first minimum (see the example in Fig. 4). For maximum and post-maximum phases, however, the molecular contamination is higher, the CLVs for broad bandpasses are clearly different from UD profiles, and these differences can already be detected in the first lobe of the visibility function (see the examples in Figs. 2 and 3 below).
For each model, we used monochromatic tabulated intensity values at 46 radii between 0 and 5 parent star radii , for wavelengths between 1.99 and 2.40 m in steps of 0.01m. Broad-band synthetic visibility values for the VINCI sensitivity function ( 1.9–2.5 m) were computed as described in Wittkowski et al. (WAK:04 (2004)). The VINCI sensitivity curve includes the transmission curves of the VINCI -filter, the sensitivity of the optical fibers, the detector quantum efficiency, and the atmospheric transmission. The wings of the VINCI sensitivity function between 1.9 and 2.0 m, as well as between 2.4 and 2.5 m are neglected. A dust shell was not included in the modeling. The dust emission coefficient of 0.24 (Sloan & Price sloan (1998), see Sect. 1) is relatively low, and dust shells as optically thin as this, are not expected to contribute significantly to -band visibilities (see e.g., Woodruff et al. woodruff (2004), Monnier et al. monnier (2004), Ohnaka et al. ohnaka (2004); see also Bedding et al. bedding (2001)). Since all observations cover only a narrow range of azimuth angles of the projected baseline, our observations are not sensitive to asymmetries (see above and Tab. 2). As a result, asymmetric shapes of the intensity distribution are not considered for the modeling.
We estimate the uncertainty of the assignment of the model stellar variability phases relative to the stellar phases at the dates of our observations to be about 0.1 owing to irregularities and cycle-to-cycle variations of the light curves of modeled and real stars (cf. Ireland et al. 2004a ; 2004b ). As a result, fits were made to our observational data with all models that have a (model) phase which differs by up to 0.1 from the stellar phases at the dates of our observations. For each model, the angular diameter is the only free parameter of the fit. In order to characterize the angular diameter of the fitted CLV, any well-defined reference radius of the model CLV can be used, such as the Rosseland radius or the 1.04 m continuum radius. Physically most meaningful may be a true continuum radius, such as the 1.04 m radius, which is not affected by time variable molecular contamination (see Hofmann et al. HSW98 (1998); Jacob & Scholz JS02 (2002); Ireland et al. 2004a ; 2004b ). In the following, the Rosseland radius is mainly used as reference quantity, as is usual in the literature. It can be transformed into any other reference point of the model CLVs with conversion factors derived from the model atmospheric structure, as for instance those given in Ireland et al. (2004a ; 2004b ).
Tab. 3 lists for these models the
best-fitting Rosseland diameters, and as alternative information,
the 1.04 m continuum diameters, with their formal errors and
the reduced values. Shown are also the resulting linear
Rosseland radii and the effective temperatures
computed with our adopted values for the parallax
and the bolometric fluxes (see above). The last
columns provide a comparison to the respective model values
of and . Our derived
values have an uncertainty of 15%, and
the values of 10%.
Taking into account the uncertainties of our visibility values and
of the derived and values, all
considered model predictions are consistent with our measured
visibility values and with the derived
and values, to within 1-2.
The correspondence of our obtained linear radii with the
model radii also indicates that the assumption of fundamental mode
pulsation is valid.
For instance, the (piston-driven)
first-overtone E model series of Bessell et al. (bessell (1996)) predict
radii (given in Hofmann et al. HSW98 (1998)) which are
larger by a factor of 1.5 when compared to the fundamental mode
P series and by a factor of 1.4 when compared to the M series.
The (self-excited) overtone O series of Hofmann et al. (HSW98 (1998))
have radii larger by factors 2.1 and 1.9, respectively.
The mean values,
averaged over the fits to all considered models, are used as the final
angular diameters.
The average formal error of
is 0.03 mas for the April 2001 data, and 0.12 mas for the
January 2002 data. In addition, a calibration error of 0.1 mas
is considered, based on calibrations using different calibrators, and
different averaging of the transfer function over the night. Finally,
an uncertainty arises from the scatter of the fit results using the
different
models, which amounts to 0.39 mas for the April 2001 data, and
0.72 mas for the January 2002 data. Altogether, the final
values for the Rosseland angular diameters are
mas and
mas.
The Rosseland angular diameter at the variability phase closer to the
maximum (1.02) is smaller by 8 % than that at variability
phase 0.08. This is consistent with pulsation models
(see, e.g. Ireland et al. 2004a ; 2004b ).
Together with the adopted values for and , these
angular diameters for April 2001 and January 2002 correspond to
linear radii of R⊙ and
R⊙, and to effective temperatures
of K and K, respectively.


The values in Tab. 3 suggest that the models of the second cycle of the P series (P2x models) fit our April 2001 data marginally better than those of the other model cycles. However, these differences are not significant, and a better baseline coverage would be needed to clearly discriminate between different model cycles and between the P and M model series (see the discussion in Ireland et al. 2004a ; 2004b ). As an example, Figs. 2 and 3 show comparisons of the April 2001 data to the well fitting P22 model, and of the January 2002 data to the P30 model prediction, respectively. These models match the data well at the respective stellar phases, in terms of consistency of the CLV and of the and values. For comparison, best fitting UD curves are shown as well. Fig. 4 shows for illustration for our April 2001 data the VINCI bandpass-averaged visibility prediction for a typical pre-maximum model, P28 (stellar phase 0.83), which is very close to a UD profile, and as expected not consistent with our post-maximum measurement.
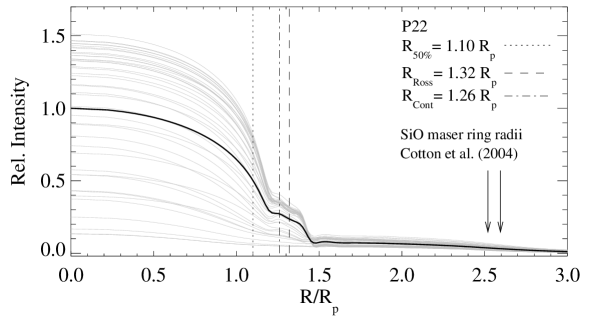
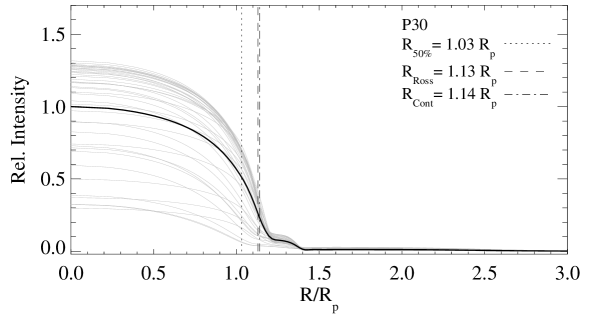
Fig. 5 shows the corresponding P22, P28, and P30 CLVs. Plotted are the monochromatic CLVs as well as the filter-averaged CLV. The Rosseland- and the 1.04 m true continuum radii are indicated, as well as the radius at which the filter-averaged CLV decreases by 50%. For the near-UD pre-maximum CLV of P28, these different radii coincide because there is little molecular contamination. For the maximum and post-maximum models P22 and P30 these three different radius definitions for each model differ by 15% and 10%, respectively, owing to a mix of contributions from continuum and line-forming layers in our broad bandpass at these phases of the pulsation cycle.
4 Comparison to other observations
Our R Leo angular diameter values are consistent with earlier -band measurements listed in Tab.1, when taking into account possible phase and cycle-to-cycle variations.
Very recently, Perrin et al. (perrin2004 (2004)) presented high-precision interferometric measurements of R Leo in four relatively narrow sub-filters of the -band obtained in November 2001 at variability phase 0.80. They compare these measurements together with broad-band observations from 2000 at phase 0.63 to an empirical model. This model consists of a stellar uniform disk and a single thin molecular layer detached from the star with different optical depths at each observed wavelength (9 free parameters), and leads to a good agreement with the data. They obtain a stellar (continuum) diameter of 21.88 1.7 mas at their pre-maximum variability phase. This diameter estimate is consistent with our values of the continuum diameter of 28.1 0.8 mas and 25.9 0.9 mas at variability phases 0.08 and 1.02, considering that the P and M model series predict diameter differences between phases 0.8 and 1.1 by a factor of about 1.5 (P08 compared to P11n; P17n to P21n; M08 to M11n; M18 to M21n; see Ireland et al. 2004a ; 2004b ). It has to be kept in mind as well that the modeling approaches are quite different and that the assignment of the model phase to the observational phase has some uncertainty (see Sect. 3). In the here adopted approach, the fundamental stellar parameters are the only free parameters and the CLV in any bandpass is then predicted as a function of phase. The measurements of Perrin et al. (perrin2004 (2004)) also illustrate the importance of narrow-band observations for more detailed tests of Mira atmosphere models.
Woodruff et al. (woodruff (2004)) recently measured the shape of the -band visibility curve for $o$ Cet at post-maximum stellar phase 0.13 and found a similar deviation from a UD curve as for our post-maximum R Leo observation at phase 0.08, both of which are consistent with the predictions of the P model series at such stellar phases. This similarity between the R Leo and Cet CLVs at similar phase is remarkable since the shapes and amplitudes of their lightcurves are different (Ireland et al. 2004a ; 2004b ).
Monnier et al. (monnier (2004)) report that their measured R Leo -band visibility function at pre-maximum phase 0.71 (around February 1, 2000) can be well be described by a UD curve. This is consistent with the predictions from the P and M model series which show near-UD CLVs for broad bandpasses at pre-maximum stellar phases (see Sect. 3). Consistently, Perrin et al. (perrin (1999)) measured a R Leo -band visibility function which is clearly different from a UD curve at post-maximum stellar phase 0.28.
Cotton et al. (cotton (2004)) have obtained VLBA maps of the (43.1 GHz) and (42.8 GHz) SiO maser emission toward several Mira stars, including R Leo. One of their R Leo epochs, from 29 April 2001, is very close in time to our first VLTI epoch (1 & 3 April 2001), with a difference of the stellar phase of only 0.09. They derived a mean diameter of the SiO maser rings of 51.1 mas and 49.3 mas for the and transitions, respectively (with widths of 2.2 mas). Compared to our value for the April 2001 R Leo Rosseland angular diameter, the SiO maser spots for the and transitions lie at 1.8 and 1.7 Rosseland radii, respectively. Cotton et al. (cotton (2004)) obtained slightly larger mean values of 2.0 and 1.9, respectively, when comparing to a mean value of the near-infrared -band UD diameters from Perrin et al. (perrin (1999)) obtained in April 1996 and March 1997. Our newly estimated R Leo values are also in good agreement with recent values of 1.7 and 1.6 for the same and SiO transitions obtained by Boboltz & Wittkowski (BW (2004)) for the Mira star S Ori by quasi-simultaneous VLTI/VLBA observations. For illustration, the mean maser ring radii derived by Cotton et al. (cotton (2004)) are indicated in the top panel of Fig. 5, together with the well fitting P22 near-infrared -band model CLV.
Danchi et al. (danchi (1994)) obtained an inner radius of the dust envelope of R Leo of 70 mas by radiative transfer modeling using mid-infrared interferometric data taken in 1988 and 1990. Compared to our Rosseland angular diameter, this would place the inner radius of the dust envelope at roughly 5 Rosseland radii, and at roughly three times the distance of the SiO maser zone.
5 Summary and conclusions
We have obtained near-infrared -band interferometric data on R Leo for two near-maximum (visual stellar phases 0.08 and 1.02) epochs.
For the first epoch, our interferometric data – obtained for a sufficiently large range of spatial frequencies – show that R Leo’s intensity profile deviates significantly from a uniform disk profile. We have compared these data to recent self-excited dynamic models which were specially created to match the stellar parameters of Cet and R Leo. We find that these model CLVs for the phases of our observations are consistent with our measurements. Furthermore, the model parameters for and are consistent with those derived from our observations, as well. The models include the effects of close molecular layers, and the correspondence with our measurements show that these effects are well described.
Very recently, Woodruff et al. (woodruff (2004)) found a similar shape of the -band visibility curve for the Mira star Cet at post-maximum phase 0.13, and consistency with predictions by the P-model series (model P21n). It is remarkable that the two stars appear to show similar CLVs which are consistent with the predictions by the P model series, while their lightcurves and variability amplitudes are different (Ireland et al. 2004a ; 2004b ). In accordance with the CLV predictions by the P and M model series, Perrin et al. (perrin (1999)) also obtained a R Leo visibility function in the -band which is very different from a UD curve at post-maximum stellar phase 0.28, and Monnier et al. (monnier (2004)) report a -band visibility function which can be well be described by a UD curve at pre-maximum stellar phase 0.71. These findings increase our confidence in these dynamic Mira star models, which are often used to transform broad-band filter-specific UD diameters into more meaningful Rosseland or continuum diameters.
We also obtained high-precision angular Rosseland diameters for R Leo at the epochs of our observations, and derive fundamental parameters, i.e. linear radius and effective temperature, from these in combination with literature estimates of R Leo’s distance and bolometric flux. The correspondence of our obtained linear radii with model radii of the fundamental mode pulsation models used is in agreement with the general recent conclusions that Mira stars pulsate in fundamental mode.
More detailed observations are desirable in the future in order to better constrain the models. Such observations should probe the CLV at a larger range of spatial frequencies. In addition, measurements with high spectral resolution in both true continuum and certain molecular bands will be useful in order to separate line-forming and continuum-forming layers. Moreover, monitoring of the observed CLVs in time over several cycles with a resolution of 10% of the variability period are desirable in order to investigate the strong model-predicted CLV variations with variability phase and cycle.
Acknowledgements.
We thank D. Boboltz, T. Driebe, and K. Ohnaka for interesting discussions, and I. Percheron and V. Roccatagliata for help and support with the data reduction. We are grateful for the valuable comments on our manuscript provided by the referee B. Lopez. DF’s stay at ESO was partly financed by the Italian National Institute for Astrophysics (INAF), under financial fund no. 0330909. We are also grateful for partial support by the ESO DGDF 2004. This research was in part supported by the Australian Research Council and the Deutsche Forschungsgemeinschaft within the linkage project “Red Giants”. We acknowledge with thanks the variable star observations from the AAVSO International Database contributed by observers worldwide and used in this research. This research has made use of the AFOEV database, operated at CDS, France.References
- (1) Bedding, T. R., Jacob, A. P., Scholz, M., & Wood, P. R. 2001, MNRAS, 325, 1487
- (2) Bessell, M. S., Scholz M., & Wood, P. R. 1996, A&A, 307, 481
- (3) Boboltz, D. A., & Wittkowski, M. 2005, ApJ, in press
- (4) Bordé, P., Coudé du Foresto, V., Chagnon, G., & Perrin, G. 2002, A&A, 393, 183
- (5) Burns, D., Baldwin, J. E., Boysen, R. C., et al. 1998, MNRAS, 297, 462
- (6) Cotton, W. D., Mennesson, B., Diamond, P. J., et al. 2004, A&A, 414, 275
- (7) Danchi, W. C., Bester, M., Degiacomi, C. G., Greenhill, L. J., & Townes, C. H. 1994, AJ, 107, 1469
- (8) di Giacomo, A., Lisi, F., Calamai, G., & Richichi, A. 1991, A&A, 249, 397
- (9) Dyck, H. M., Benson, J. A., van Belle, G. T., & Ridgway, S. T. 1996, AJ, 111, 1705
- (10) Gatewood, G. 1992, PASP, 104, 23
- (11) Haniff, C. A., Scholz, M., & Tuthill, P. G. 1995, MNRAS, 276, 640
- (12) Hofmann, K.-H., Scholz, M., & Wood, P.R. 1998, A&A, 339, 846
- (13) Hofmann, K.-H., Balega, Y., Scholz, M., & Weigelt, G. 2001, A&A, 376, 518
- (14) Hofmann, K.-H., Beckmann, U., Blöcker, T., et al. 2002, New A, 7, 9
- (15) Ireland, M. J., Scholz, M., Wood, P. R. 2004a, MNRAS, 352, 318
- (16) Ireland, M. J., Scholz, M., Tuthill, P. G., & Wood. P. R. 2004b, MNRAS, in press
- (17) Jacob, A. P. & Scholz, M. 2002, MNRAS, 336, 1377
- (18) Kervella, P., Gitton, P., & Ségransan, D., et al. 2003, Proc. SPIE, 4838, 858
- (19) Kervella, P., Ségransan, D. & Coudé du Foresto, V. 2004, A&A, 425, 1161
- (20) Knapp, G. R., Young, K., Lee, E., & Jorissen, A. 1998, ApJS, 117, 209
- (21) Kholopov, P. N., et al. 1998, Combined General Catalogue of Variable Stars, 4.1 Ed (II/214A). (1998)
- (22) Mennesson, B., Perrin, G., Chagnon, G., et al. 2002, ApJ, 579, 446
- (23) Monnier, J. D., Millan-Gabet, R., Tuthill, P. G., et al. 2004, ApJ, 605, 436
- (24) Ohnaka, K., Bergeat, J., Driebe, T., et al. 2004, A&A, in press
- (25) Perrin, G., Coudé du Foresto, V., Ridgway, S.T., et al. 1999, A&A, 345, 221
- (26) Perrin, G., Ridgway, S.T., Mennesson, B., et al. 2004, A&A, 426, 279
- (27) Perryman, M. A. C. & ESA 1997, The Hipparcos and Tycho catalogues, Publisher: Noordwijk, Netherlands: ESA Publications Division, 1997, Series: ESA SP Series vol no: 1200, ISBN: 9290923997
- (28) Sloan, G. C. & Price, S. D. 1998, ApJS, 119, 141
- (29) Scholz, M. 1998, IAU Symp. 189: Fundamental Stellar Properties, 189, 51
- (30) Scholz, M. 2001, MNRAS, 321, 347
- (31) Scholz, M. 2003, Proc. SPIE, 4838, 163
- (32) Scholz M., Wood P.R. 2000, A&A, 362, 1065
- (33) Tej, A., Chandrasekhar, T., Ashok, N. M., et al. 1999, AJ, 117, 1857
- (34) Tej, A., Lançon, A., & Scholz, M. 2003a, A&A, 401, 347
- (35) Tej, A., Lançon, A., Scholz, M., & Wood, P. R. 2003b, A&A, 412, 481
- (36) van Belle, G. T., Dyck, H. M., Benson, J. A., & Lacasse, M. G. 1996, AJ, 112, 2147
- (37) van Belle, G. T., Thompson, R. R., & Creech-Eakman, M. J. 2002, AJ, 124, 1706
- (38) Waagen, E. O. 2004, Observations from the AAVSO International Database, private communication
- (39) Whitelock, P. & Feast, M. 2000, MNRAS, 319, 759
- (40) Whitelock, P., Marang, F., & Feast, M. 2000, MNRAS, 319, 728
- (41) Wittkowski, M., Hummel, C. A., Johnston, K. J., et al. 2001, A&A, 377, 981
- (42) Wittkowski, M., Aufdenberg, J. P., & Kervella, P. 2004, A&A, 413, 711
- (43) Wood, P. R., Alcock, C., Allsman, R.A., et al. 1999, IAU Symp. 191: Asymptotic Giant Branch Stars, 191, 151
- (44) Woodruff, H. C., Eberhardt, M., Driebe, T., et al. 2004, A&A, 421, 703
- (45) Young, J. S., Baldwin, J. E., Boysen, R. C., et al. 2000, MNRAS, 318, 381