MODELING THE 3C 120 RADIO JET FROM 1 TO 30 MilliARCSECONDS
Abstract
In this paper we use the predicted spatial development of helical structures along an expanding jet to model observed structures and motions in the 3C 120 jet. New results of VLBI imaging of the parsec-scale radio jet in 3C 120 at 5 GHz are examined along with older long term monitoring results at 5 GHz and older results obtained at 22 and 43 GHz. The high frequency observations provide detailed information on motions and structure from 0.5 to 10 mas from the core and the lower frequency observations from 1 to 30 mas from the core. Proper motions of helical components associated with the pattern and of other components that move through the pattern provide estimates of flow and helical pattern speeds. Theoretical modeling of the motion and appearance of the helical pattern allows determination of sound speeds as a function of the jet viewing angle. The jet sound speed declines although probably not as fast as adiabatically. At a 12° viewing angle the most likely scenario involves a decline in jet sound speed from at mas from the core to at mas from the core accompanied by some acceleration in the jet flow from Lorentz factor to . The sound speed in the cocoon medium around the jet is less well determined but is less than the sound speed in the jet probably by a factor of 1.5 - 5. A largest possible viewing angle of 15° implies a jet sound speed at the upper limit of these estimates and somewhat higher flow Lorentz factors. However, jet morphology argues against viewing angles larger than 12°. At smaller viewing angles the jet sound speed is lower and at a 6° viewing angle the jet sound speed is about a factor 2 less but the flow Lorentz factor is comparable. The decline in radio intensity is on the order of what would be associated with isothermal jet expansion. Knot interknot intensity variations are greater than would be expected from adiabatic compressions associated with the helical twist and we infer the presence of a shock along the leading edge of the helical twist in addition to shock or density structures flowing through the helical pattern. Our results imply that the macroscopic heating of the expanding jet fluid is less than the microscopic energization of the synchrotron radiating relativistic electrons.
1 Introduction
The radio source 3C 120 is dominated by a variable core and a prominent one-sided jet extending from the core on subparsec scales to about a hundred kiloparsecs (Walker, Benson, & Unwin, 1987). The galaxy has a redshift (Baldwin et al., 1980), and with km s-1 Mpc-1 and there are pc mas-1. Recent high frequency VLBI observations at 86, 43 and 22 GHz (Gómez et al., 1998; Gómez, Marscher, & Alberdi, 1999; Gómez et al., 2000, 2001; Marscher et al., 2002) have produced high resolution images of the innermost features and motions in the jet. The 43 and 22 GHz observations, show that the inner jet structure, within 10 mas from the core, is complex and exhibits a subluminal to superluminal transition on very small scales. Global VLBI observations at 5 GHz and 10.7 GHz (Walker et al., 2001) find superluminal motions consistent with those observed at 22 and 43 GHz. The 3C 120 jet shows a variety of knots and side-to-side structures, and it has been suggested that the jet structure of 3C 120 inside 10 mas may be described by components interacting with the external medium in their motion along an underlying helical twist (Gómez et al., 1998, 2000, 2001). VLBI images at 1.7 GHz, see Figure 6 in Walker et al. (2001), also show structure suggestive of a helical twist beyond 25 mas but with considerably longer wavelength.
Helical structure in relativistic jets can arise as a result of ordered variation in the flow direction at the central engine, e.g., precession, and/or as a result of random perturbations to the jet flow such as the jet cloud interaction discussed in Gómez et al. (2000). Initial random perturbations can trigger or propagate as pinch, helical, or higher order normal modes of jet distortion. Any normal mode structure will depend on the initial excited wave frequency or frequencies and initial amplitudes, and on the subsequent propagation and growth or damping of these wave frequencies along the jet, e.g., axisymmetric perturbations as in Hardee et al. (1998) and Agudo et al. (2001) or some combination including asymmetric perturbations as in Aloy et al. (2003) and Hardee & Hughes (2003). In these simulations linear and/or non-linear perturbations were applied. In particular, an injection event can coexist and interact with a precession induced helical twist (Aloy et al., 2003). In general, non-linearly triggered normal modes are damped until reaching a “linear” regime and both non-linear triggers and “linear” normal mode structures can coexist on the jets. Within the “linear” regime normal mode structures can be satisfactorily modeled by the linearized relativistic hydrodynamic (RHD) equations (Hardee et al., 1998; Agudo et al., 2001; Hardee & Hughes, 2003). The behavior of normal modes and, in particular, helical twist propagation and growth or damping can sensitively depend on jet speed via the Lorentz factor, on the sound speeds in the jet and surrounding material, and on the rate of jet expansion (Hardee, 2003).
That the normal wave modes predicted theoretically operate on AGN jets has been suggested by Lobanov & Zensus (2001) who successfully fitted the twisted emission threads observed in the 3C 273 jet by a combination of helical and elliptical surface and internal normal modes. Other similar fitting has been performed by Lobanov, Hardee, & Eilek (2003) in the context of M 87. Helical twists have been invoked to explain other observed jet structure and, for example, it has been shown that superluminal motions and accelerations along a curved trajectory can be produced by helical jet models, e.g., the radio source 3C 345 (Hardee, 1987; Steffen et al., 1995). While some fitting of helically twisted structure to observed jet morphology has been performed, to date no detailed self-consistent models have been constructed.
Only in the past few years have time dependent relativistic hydrodynamical codes become readily available (Duncan & Hughes, 1994; Martí, Müller, & Ibáñez, 1994; Koide, Nishikawa, & Mutel, 1996; Falle & Komissarov, 1996; Aloy et al., 1999a). More recently this has allowed fully 3D relativistic jet simulations to be performed with resolution sufficient to compare structure with theoretical predictions and/or with features observed in AGN jets (Aloy et al., 1999b, 2000; Hardee et al., 2001; Hughes et al., 2002; Hardee & Hughes, 2003; Aloy et al., 2003). Ideally we would like to model observed jet structures numerically and include non-linear effects. In general, computational constraints make it very difficult to simulate and model the superluminal jets that must lie near to the line of sight. Satisfactory numerical modeling would require very high grid resolution across the jet to reduce the effects of numerical viscosity ( computational zones) Perucho et al. (2004) and additional zones outside the jet, lengthy computational grids in order to account for projection, and very large storage capabilities in order to account for light travel time effects, e.g., Gómez et al. (1997); Aloy et al. (2003), that make it impractical to conduct numerical modeling involving many trials. This difficulty can be overcome using theoretical models based on the linearized fluid equations.
In this paper we consider high frequency VLBI images and proper motions from Gómez et al. (1998); Gómez, Marscher, & Alberdi (1999); Gómez et al. (2001) that cover the inner 10 mas of the jet, new 5 GHz images that cover the inner jet out to 30 mas, and proper motions from Walker et al. (2001) that cover this portion of the jet. With these observations, we begin to discern what trajectory components follow, whether motions are constant for a given feature and between features, and whether there are similarities between component speeds, trajectories, and structure at parsec and tens of parsec scales. We use the observed structure and proper motions to constrain the macroscopic properties of the jet and surrounding medium. In §2 the observed relevant observations are summarized. In §3 we show how to model relativistically moving helical twists along with the accompanying line of sight appearance and model the innermost 10 mas portion of the jet as a single frequency helical twist on an isothermally expanding jet. In §4 we extend the modeling to larger distances with dual harmonic twist frequencies and also consider adiabatic expansion. We conclude in §5 with a summary and discussion of the implications of our intensity and dynamical modeling.
2 Observed Structure and Motion inside 30 mas
The inner 10 mas structure of 3C 120 has been interpreted as determined by the evolution of superluminal components and their complex interactions with the external medium and/or underlying jet (Gómez et al., 1998; Gómez, Marscher, & Alberdi, 1999; Gómez et al., 2000, 2001; Marscher et al., 2002) The association of some of these components with injection of material into the jet, leading to the formation of shocks, has been established by simultaneous radio and X-ray observations. Dips in the X-ray light curve are interpreted as caused by the disappearance of a section of the inner accretion disk past the event horizon of the black hole, while the remainder of the disk material is injected into the jet, leading to a flare in the radio light curves and the appearance of a new superluminal component in the jet (Marscher et al., 2002). Other components seem to be generated by the passage down the jet of such leading shocks, as has been considered for components , , and (Gómez et al., 2001). These are observed to appear in the wake of the strong superluminal component , and present a similar behavior to the trailing components obtained in numerical simulations by Agudo et al. (2001).
Continued monthly monitoring of the inner structure at 22 and 43 GHz with the VLBA has revealed rapid changes in the total and linearly polarized intensity, accompanied by a rotation of the magnetic polarization vector, interpreted as resulting from the interaction of the jet components with the external medium (Gómez et al., 2000, 2001). In particular, these high frequency observations also show evidence for the existence of an underlying helical jet structure, which may also be affecting the jet’s structural evolution. Component (Figure 1 at 22 GHz) can be resolved into two subcomponents and (Figure 1 at 43 GHz) that show changes in the position angle and magnetic polarization suggesting interaction with an underlying helical twist (Gómez et al., 2001).

In general, there are ”northern” and ”southern” jet components, see Figures 2 in Gómez et al. (2000, 2001), that seem to be ejected with different position angles. The southern components are usually brighter than the northern components and this could be the result of the overall curvature of the jet to the north, e.g., Walker et al. (2001), leading to higher pressures along the southern edge combined with projection effects associated with a helical twist of the jet.
It is tempting to identify prominent southern components as indicating an overall helical twist. The spacing between the prominent southern components , and (22 GHz) is similar and other components can appear to outline a projected helical twist between these prominent southern components. For example, note the curved path in intensity contours between components and (December 1996) and between components and (November 1997). That prominent components always evolve towards the southern side of the jet suggests that projection plays a significant role in their location. These “helical” components with similar spacing and motion would indicate the wavelength and motion of the helical twist. Other non-helical components would outline and indicate flow through the helically twisted jet.
Components , and have separations of mas at core distances from mas with a suggestion of increasing separation as core distance increases. Observed proper motions are () 1.75 and () 1.71 mas yr-1 (Gómez, Marscher, & Alberdi, 1999; Gómez et al., 2001), and we use an average proper motion of 1.73 mas yr-1 for these components as representative of motion of the helical twist. The relatively constant spacing and motion along with a “saturated” component intensity structure beyond 2 mas suggests that the motion and spacing of these components with , where 1 mas yr-1 c, should be associated with a saturated helical twist in the high frequency regime (Hardee, 2003). Here high frequency is relative to the fastest growing or “resonant” frequency of the Kelvin-Helmholtz unstable helical twist.
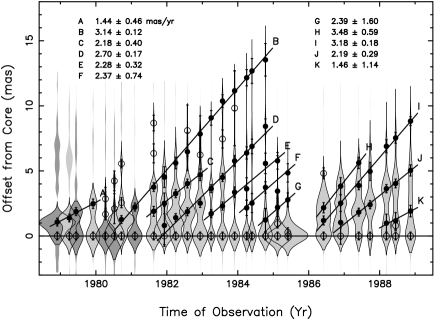
Non-helical components can move faster than the helical components. For example, in Gómez et al. (2001) fast moving components between and (e.g., and in Figure 1) show motions from 2.17 to 2.48 mas yr-1. A wide variety of motions, from mas yr-1 are found by Walker et al. (2001) at 5 and 10.7 GHz out to 14 mas from the core and are shown along with estimated errors in Figure 2. An average motion associated with fast moving components might be mas yr-1. Here this estimate lies between the 2.17 mas yr-1 from Gómez et al. (2001); Walker et al. (2001) and the 3.47 mas yr-1 from Walker et al. (2001) and represents a simple proper motion average of components B to J in Figure 2. The resulting apparent superluminal motion, , might be assumed to correspond to the flow speed and constrains the viewing angle to less than .
Interestingly, component has a proper motion, 1.83 mas yr-1, similar to prominent southern components, and spacing between and is similar to the spacing between , and . Component appeared in 1998 after a strong outburst in December 1997 (Gómez et al., 2001; Marscher et al., 2002). Thus, component should not necessarily be related to the helical components , and assumed formed by projection of the helical pattern. Also component is not clearly on the southern edge of the jet. Thus, we do not now identify as a helical component. It will be interesting to see if in future it behaves like , and . Such a scenario might occur if a non-uniform outflow is precessed and components trigger/merge with the overall helical twist. In this case component shocks can lead to a shock along the leading edge of the helical twist.
Components , and , interpreted as structures triggered by passage down the jet of a shock associated with component (Gómez et al., 2001), have motions 0.27, 0.40, and 0.49 mas yr-1 respectively, and the separation of these components increases from to . Acceleration and increasing spacing occurs naturally for pinch body mode components triggered near to the resonant frequency as the pinches transition from the resonant to the high frequency regime by virtue of jet expansion, e.g., Agudo et al. (2001). Alternatively these components could be associated with the helical twist. Here again acceleration and increasing spacing results from a change in helical wave speed as the twist transitions from the low or resonant frequency regime to the high frequency regime by virtue of jet expansion (Hardee, 2003). In either case the proper motion of the component nearest to the core with 0.6 could represent motion of pinching or helical twisting in the resonant or low frequency regime. We note here, and address this issue in §3.1, that the proper motion of pinch body mode components or “helical ” components associated with the helical surface (twist) mode are similar in the resonant and high frequency regimes. Thus, the identification of these innermost components either with pinches or helical twist can give a similar final modeling result.

Inspection of images in Gómez et al. (2000, 2001) shows that the jet is bent to the north inside 10 mas with a position angle change on the order of , although most of this change appears to occur beyond 2 mas from the core. At an assumed viewing angle of , this apparent change coresponds to a intrinsic change of . The apparent and intrisic bending angles corresponding to this position angle change are somewhat larger, i.e., the change in angle, , defined by a vector tangent to the jet is greater than the change in position angle, , defined by the vector from the core to a point on the curved jet. An intrinsic bending angle of say , even if all bending were to occur in the innermost 2 mas could not account for the observed acceleration. Provided radian, the change in motion and jet bending to the north cannot account for the observed acceleration from , component , to , component , and falls far short of an acceleration to , component .
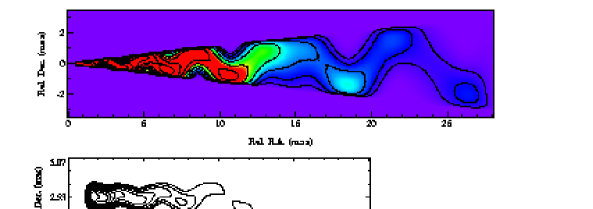
Jet structure out to mas is revealed by the total intensity maps in Figure 3. The observational details for these previously unpublished images are given in Appendix A. Here we identify the first four components with , and . In Figure 3 intensity contours between , and indicate a helical morphology like that suggested by Gómez et al. (1998) and again with a suggestion of increasing spacing (typical spacing mas) as core distance increases. Between 10 and 15 mas there is a discontinuity in the regular pattern of components. If we interpret the outermost structure in terms of a helical pattern then the wavelength has shown an abrupt increase to mas. This increase in helical component spacing is also accompanied by an apparent increase in the proper motions of components where component motions beyond about 15 mas from the core determined from 1.7 GHz multiepoch images are between 2.5 and 3.1 mas yr-1 (Walker et al., 2001). This would imply an increase in observed helical wave speed from to .
A 1.7 GHz image shown in Figure 4 shows structure between 30 - 80 mas that is qualitatively similar in appearance to the helical morphology inside 30 mas. Note the prominent components are again on the southern side of the jet and note a curved path in intensity contours between 50 - 80 mas from the core.
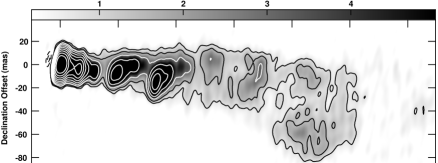
Here we see an indication of a component spacing jump from 15 mas between 35 - 50 mas from the core to 30 mas between 50 - 80 mas from the core. Beyond the slowly moving component, , at 80 mas, the jet character changes significantly. This image and unpublished 5 GHz images suggest spacing jumps by factors of two as core distance increases. At least approximately helical component spacing makes a transition from an apparent 3.5 mas spacing within 10 mas from the core to 30 mas by 80 mas from the core. The implied increase in helical component spacing, approximately proportional to the jet radius, would require a systematic linear increase in flow speed as a function of core distance if it was a flow speed effect. On the other hand, this increasing component spacing may be representative of excitation of multiple harmonic helical frequencies and with lower frequencies supplanting higher frequencies at larger core distance.
It is from the analysis of the wavelength and motion of helical structure along with the motion associated with the jet flow that we expect to constrain, through our modeling, the macroscopic properties of the jet and surrounding medium.
3 Modeling Helical Structures
Comparison between theoretical predictions and numerical simulations indicates that helical structures must be operating near to the linear regime if jets are to remain highly collimated. In the non-linear regime helical jet surface distortion at resonant or longer wavelengths leads to mass entrainment that can disrupt highly collimated flow and can lead to the formation of an extended velocity shear layer. Note however, that helical surface distortion at wavelengths much shorter than resonant may be able to reach a non-linear saturation without disrupting highly collimated flow, e.g., Xu, Hardee, & Stone (2000). Even when formally weakly non-linear, normal mode structures can be satisfactoriy modeled using the linearized fluid equations (Hardee et al., 1998; Hardee & Hughes, 2003). In the linear or weakly non-linear regime moving helical structures and accompanying flow fields found from the linearized RHD equations behave in predictable ways and the resulting behavior can lead to estimates of sound speeds from observed proper motions. In what follows we show in detail how to use the observed proper motions of features in the inner 30 mas of the 3C 120 jet to obtain the first order consistent flow field associated with the helical structure, produce pseudo-synchrotron intensity images appropriate to adiabatic compressions associated with helical structure, and most importantly constrain the parameter regime in which the jet must operate.
3.1 Moving Helical Patterns
The linearized RHD equations show that a helical twist is Kelvin-Helmholtz unstable and propagates at a wave speed dependent on jet speed, sound speeds, and on the frequency of the wave relative to a “resonant” or maximally unstable frequency, . For sufficiently supersonic flow, i.e., and , the resonant frequency is where is the jet radius and is the sound speed in jet or external medium. In general, solution of the wave dispersion relation is necessary to compute the wave speed and wavelength when the wave frequency is within an order of magnitude of . Along an expanding jet decreases and solution of the dispersion relation is needed to follow the development of a helical wave of constant frequency as it is advected along the jet from the low to the high frequency regime.
At frequencies more than an order of magnitude below () the wave speed is given by
| (1) |
and at high frequencies when the wave speed is given by
| (2) |
In equations (1) & (2) is the Lorentz factor, , and the sound speed , where is the adiabatic index. The density, , and pressure, , are measured in the proper fluid frames, and since pressure balance has been assumed is an enthalpy ratio if the adiabatic indices are the same inside and outside the jet.
The apparent helical wavelength in the observer frame is related to the intrinsic wavelength by where is the apparent wave speed, and the observed wavelength can be greater or less than the intrinsic wavelength depending on wave speed and viewing angle . In general, change in the observed wavelength is amplified relative to change in the intrinsic wavelength with
| (3) |
In equation (3) is the intrinsic distance to the core where is the observed distance. If the wave speed is relatively low at low frequencies, i.e., , then the speed increases until it reaches the value given by equation (2) at high frequencies. In this case a helical wave advected along an expanding jet can appear to increase in wavelength approximately proportional to as the wave speed increases. If there is a minimum in the wave speed near to the resonant frequency and there can still be significant change in the observed wavelength.
Equation (1) can be rewritten to give the sound speed ratio in terms of the observed flow speed, wave speed () and viewing angle as
| (4) |
Equation (2) can be rewritten to give the jet sound speed in terms of the observed flow speed, wave speed () and viewing angle as
| (5) |
Equation (3) can be rewritten to give the intrinsic wavelength in terms of the observed wave speed, wavelength and viewing angle as
| (6) |
In equations (4 - 6) is the apparent super or subluminal flow or wave speed, and we have used . Provided , the superluminal case considered here, a lower limit to the jet sound speed
| (7) |
can be found from equation (5) for . As the viewing angle increases the sound speed increases and in the limit a maximum viewing angle
| (8) |
is obtained from equation (5) where we have used , , and assumed . It can be shown that the supersonic limit, , guarantees that and . As the less restrictive is recovered from equation (8).
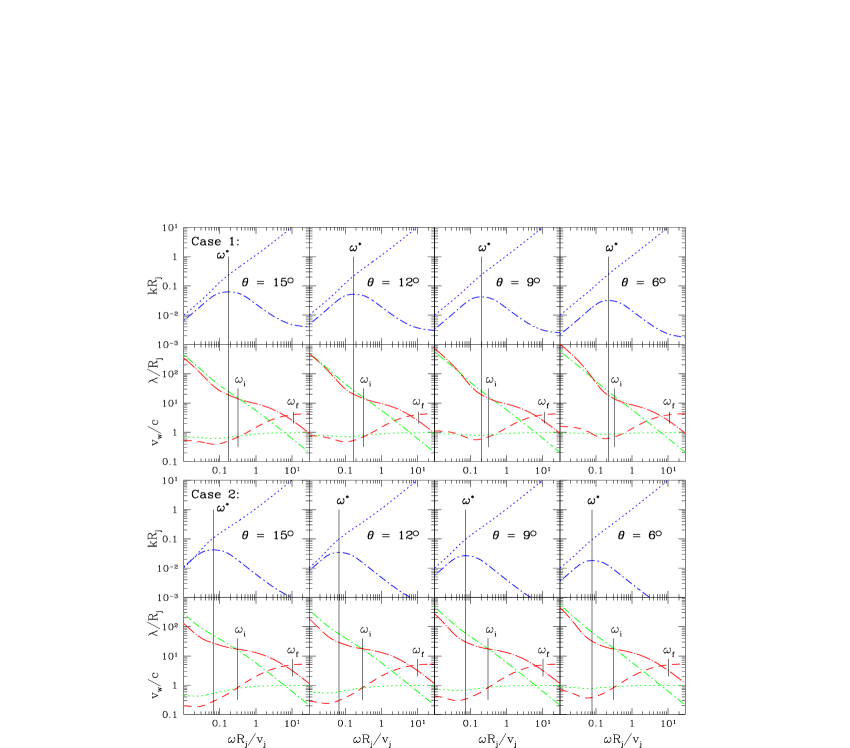
Given that the observed prominent “helical” component proper motions in the inner 3C 120 jet are well defined, the largest uncertainty in the modeling process lies in the assumed flow speed which could be as small as from the observed proper motions of 2.3 mas yr-1 found between components and at 43 GHz (Gómez et al., 2001) or as large as from the largest observed proper motion of 3.4 mas yr-1 at 5 GHz (Walker et al., 2001). The section of the jet that we consider also clearly contains regions of different component spacing and motion. Thus, we are faced with the possibility of flow acceleration and changing sound speeds along the jet. Initially we shall consider two cases. In both cases let us assume but otherwise (appropriate to inside 10 mas) or (appropriate to outside 10 mas). Here we are identifying the subluminal motions of the innermost observed components in the 3C 120 jet with a minimum helical wave speed. Equations (4) and (5) then provide preliminary estimates of the sound speeds and Figure 5 shows how and vary as a function of viewing angle, , and observed flow speed, .

Examination of Figure 5 indicates that the external sound speed would lie within the range and the internal sound speed for . Values are and or factors 2 - 3 times lower for . Equations (7) and (8) with and suggest that the viewing angle is and we will assume that represents the largest possible viewing angle. The fact that implied sound speeds are lower for the higher assumed wave speed beyond 10 mas suggests a jet cooled by expansion.
When the observed spatial change in wave motion and wavelength imply a helical wave with frequency within an order of magnitude of resonance, the full wave dispersion relation must be used to fit the observed wave motion and wavelength, and to estimate sound speeds. In our initial modeling we will follow the assumption that the jet can be modeled as an isothermal constant speed expansion with isothermal external medium. For viewing angles , and we have considered two different cases that bracket the likely flow and sound speed range. In both cases we consider the portion of the jet where the jet radius ranges from mas mas ( pc pc), the observed distance ranges from mas mas, and the observed half-opening angle radian.
For Case 1 we assume a flow speed with:
-
•
The observed wave speed at mas and at mas.
-
•
At mas, the observed helical wavelength is mas.
Here the observed wave speed ranges from typical of the proper motions of the innermost components ( @ mas) and ( @ mas), but does not achieve the proper motion of the “helical” components () for mas or the proper motion of the “helical” components for mas (). Additionally, the predicted wavelength for mas is somewhat less than the observed wavelength. At least approximately this case is representative of the jet close to the core.
For Case 2 we assume a flow speed with:
-
•
The observed wave speed at mas and at mas.
-
•
At mas, the observed helical wavelength is mas.
Here the observed wave speed must begin somewhat above that of the typical proper motions of the innermost components () in order to achieve the typical proper motion of the “helical” components () for mas, and to nearly achieve the faster proper motion of “helical” components () for mas. Here the predicted wavelength is somewhat larger than the observed wavelength for mas.
The above set of constraints along with the preliminary estimates of allowed sound speeds, e.g., Figure 5, gets us into the correct region of parameter space. In general, we first obtain an estimate for the jet sound speed by fitting the wavelength and wave speed at mas. Here, where the wavelength is in the short wavelength and high frequency regime, the wave speed is nearly independent of the external sound speed and primarily depends on the jet speed and the jet sound speed. Typically this requires 10 or more trials at a single viewing angle. Note that we also obtain at this location and with and known we obtain the angular frequency . Subsequently we find the external sound speed that would yield the wave speed at mas and given our estimate of the jet sound speed. Here the angular frequency, , of the wave is conserved but is reduced relative to by the smaller jet radius. A few additional trials may be necessary as the value for the external sound speed modifies slightly the required jet sound speed and value of . The resulting estimates for the sound speeds will be accurate on the 10% level, i.e., 10% differences provide a similar satisfactory fit. Computing time is minimal, basically solving the dispersion relation for different values of the sound speed, but the non-linear nature of the dispersion relation near to resonance makes this a procedure that would be difficult to automate.
Figure 6 shows a sample of the dispersion relation solutions that best satisfy the set of conditions above along with the intrinsic and observed wavelengths and wave speeds and Table 1 contains the associated parameters.
| 1: | 2: | ||||||||||
|---|---|---|---|---|---|---|---|---|---|---|---|
| 15° | 0.0271 | — | 0.9910 | 7.47 | 0.460 | 0.095 | — | 0.9943 | 9.37 | 0.400 | 0.040 |
| 12° | 0.0218 | — | 0.9874 | 6.31 | 0.330 | 0.110 | — | 0.9900 | 7.09 | 0.250 | 0.045 |
| 9° | 0.0164 | — | 0.9864 | 6.09 | 0.260 | 0.130 | — | 0.9885 | 6.61 | 0.180 | 0.050 |
| 6° | 0.0109 | — | 0.9882 | 6.53 | 0.210 | 0.150 | — | 0.9895 | 6.92 | 0.130 | 0.055 |
| 3° | 0.0055 | — | 0.9927 | 8.29 | 0.150 | 0.170 | — | 0.9935 | 8.78 | 0.090 | 0.065 |
For Case 1 the observed wave speed, , corresponds to the wave speed at frequency . The implied angular frequency is radian/sec for a periodicity of about 2 years. The jet sound speed is lower than would be suggested by eq. (5) in order to achieve at mas where as the jet expands by a factor over the modeled region. The frequency is above “resonance” and thus the value for the external sound speed, found from exact solution to the dispersion relation, varies from about 10% less to 40% more than is found using eqs. (4) & (5) as viewing angle decreases from 15° to 6°. We note that the indicated external sound speed at the 3° viewing angle would need to be to give . The fact that we cannot obtain an external sound speed estimate consistent with the required subluminal motions at ° and the observed subluminal acceleration would suggest that °. However, both observational errors and uncertainties in the interpretation of features makes a firm lower limit to the viewing angle unlikely.
For Case 2 the observed wave speed, , corresponds to the wave speed at frequency . The implied angular frequency remains radian/sec for a periodicity of about 2 years. The jet sound speed is slightly lower than would be suggested by eq. (5) in order to achieve at mas where . The frequency is above “resonance” and and thus the value for the external sound speed, found from exact solution to the dispersion relation, varies from about 30% less to 15% more than is found using eqs. (4) & (5) as viewing angle decreases from 15° to 6°. For this parameter set can be obtained at all viewing angles and no lower limit to the viewing angle is implied by the observed subluminal acceleration.
In the above we have assumed that the subluminal motions of the innermost 3C 120 jet components would be representative of the helical wave speed. This would not be true if the helical wave was in the low frequency limit at this location because low frequency propagation of helical surface and pinch body modes can be very different. However, we find that the helical wave at this location is somewhat above resonance. A normal mode analysis shows that wave propagation at or above the resonant frequency for pinch body modes and for helical twist modes is approximately the same (Hardee, 2000). Since our estimate is based on a helical wave with initial frequency above resonance, there will be only modest difference in the estimated external sound speed if the subluminal component motions are modeled as pinch body mode structures. The variation in external sound speed from this initial position has little influence on our results. This is because the modeled helical structure primarily lies in the high frequency regime where wave speed is nearly independent of the external sound speed or its variation.
3.2 Modeling Helically Twisted Fluid Flow
As a helical twist is Kelvin-Helmholtz unstable, the displacement amplitude of the jet surface grows according to
| (9) |
where is the displacement amplitude at and is the spatial growth length. Growth at the predicted linear growth rates has been verified in the “linear” regime by non-relativistic simulations (Stone, Xu, & Hardee, 2000; Xu, Hardee, & Stone, 2000) and by relativistic simulations (Perucho et al., 2004). The magnitude of accompanying velocity and pressure fluctuations grows according to , and for constant jet expansion
| (10) |
where . For the growth length is given by
| () |
At the minimum growth length
| () |
is somewhat larger than a straight extrapolation of the low frequency result to the resonant frequency. At frequencies the growth length rapidly increases with
| () |
where . At higher frequencies the growth rate can plateau depending on jet and sound speeds. The dependence of the growth length on wave frequency relative to means that a maximum in occurs on an expanding jet when . Note that the jet half opening angle, , must be less than the relativistic Mach angle, , for self-consistency. Equation (10) reflects this self-consistency in that as and no growth in pressure or velocity fluctuation is predicted.
Figure 7 shows how pressure and velocity fluctuations grow for a viewing angle of 12°. The 1D cuts are made at locations and at . Thus, is a radial velocity and is a toroidal velocity component.
Calculation of the pressure and velocity structure has used expressions given in Hardee (2000). The spread in radial velocity from jet center to jet surface indicates jet expansion and there is considerably more fluctuation near jet center than at the jet surface. Uniform across the jet indicates uniform sideways motion of the jet. The axial velocity shows more fluctuation at the jet surface than near the jet center. For all angles we have allowed the growth of perturbations from some initial amplitude at position up to a saturation amplitude assumed equal to the maximum allowed by the linear analysis, i.e., . For all viewing angles and for both parameter sets we find that an initial amplitude can be chosen such that saturation is achieved without imposing an arbitrary decline in the growth rate at high frequency. Thus, we find that saturation can occur naturally as a result of decline in the growth rate at high frequency combined with jet expansion at constant opening angle. For Case 1 parameters where , increases before declining but for Case 2 parameters where , declines. Nevertheless, the initial velocity and pressure perturbation at mas that can lead to saturation is very small. In general, for a given pressure fluctuation, velocity fluctuations are reduced for lower values of the jet sound speed and higher values of the Lorentz factor, i.e., higher relativistic Mach number . A saturation amplitude of corresponds to flow with helical pitch at about half the relativistic Mach angle. For saturated helical waves with displacement of the jet surface .
3.3 Modeling Helical Intensity Morphology
In intensity modeling we do not attempt to reproduce details within the jet or the exact positioning of “helical” components. Line of sight images are constructed assuming that a pseudo-synchrotron emissivity at fixed frequency can be written as
| (12) |
where is the angle of the magnetic field to the line of sight and is the Doppler boost factor for fluid flowing with speed at angle to the line of sight. The theoretically computed flow fields are used to achieve correct inclusion of Doppler boosting effects on intensity variations. The magnetic field strength is assumed to decline and fluctuate as appropriate to a disordered magnetic field. This form for the pseudo-synchrotron emissivity is one way to calculate intensities when the synchrotron emitting particles are not explicitly tracked (Clarke, Norman, & Burns, 1989), and when radiative losses and acceleration processes are not included. Jones, Ryu, & Engel (1999) have shown that pseudo-synchrotron intensities computed this way are not too different from synchrotron intensities that include radiative losses and shock acceleration processes, and so can provide an acceptable image of jet structure.
In our intensity modeling we assume that the magnetic pressure is negligible and the jet expands at fixed opening angle. In what follows we will model the jet assuming isothermal constant speed expansion, i.e., conserve energy flux, and that the sound speed ratio, is constant. Here the jet Mach number, , remains constant and the external Mach number, , also remains constant with the jet in pressure balance with an external cocoon medium. Along the conical constant velocity isothermal jet the particle number density and pressure decline . For the 3C 120 jet we use where .
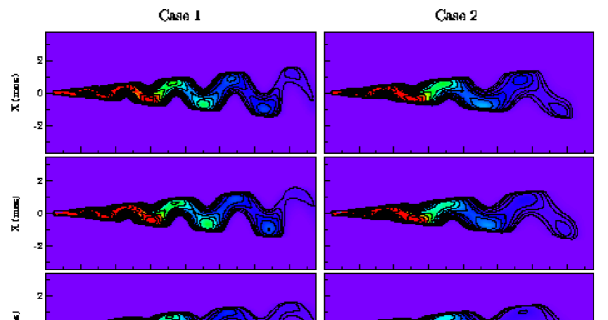
Figure 8 shows the resulting pseudo-synchrotron intensity images for four viewing angles. Here the intrinsic jet becomes longer as the viewing angle decreases so that the images represent the observed projected jet. All light travel time effects and Doppler boosting effects are included. The brightest radio emission traces the path of the helically twisted high pressure ridge which effectively lies within the conical jet’s surface. The helical pitch of the high pressure ridge is decoupled from the helical pitch of the flow primarily as a result of rapid wave motion when , and the intrinsic flow pitch angle is less than would be inferred from the intrinsic helical pitch of the high pressure ridge. Line of sight effects mean that the brightest regions will be on the south (lower) side of the jet where the high pressure ridge approaches closer to the line of sight and increased somewhat by increased Doppler boosting. On the north (upper) side of the jet the pressure ridge is stretched by projection and the brightness is decreased somewhat because of reduced Doppler boosting. The similarity in appearance for the different viewing angles occurs because the flow field and Doppler boost factor exhibit less angular variation at the smaller viewing angles. This reduced angular flow variation is a result of the lower jet sound speed and higher Lorentz factor required at the smaller viewing angles for the observed flow speed.
Helical component formation is enhanced at the shorter wavelengths of Case 1 and is a combination of projection and enhanced Doppler boosting. However, our intensity variations which are the result of projected adiabatic compressions show knot interknot variation less than a factor of 4. This is less than the variation indicated by the 5 GHz images (Figure 3), and considerably less variation than indicated by the 22 GHz and 43 GHz images (Figure 1). This result suggests that compressions resulting in the “helical” component formation in the 3C 120 jet are not adiabatic. A secondary brightening on the northern side of the jet between the brighter southern components is a result of projection effects and relativistic aberration associated with motion of the ribbon like high pressure region. At the smaller viewing angles the flow angle relative to the line of sight is sufficiently increased at this location to reduce Doppler boosting and reduce this secondary peak. The fact that the 22 GHz intensity structure indicates a secondary brightening on the northern side between helical components suggests that the 3C 120 jet lies at larger viewing angles.
4 Multiple Helical Frequencies and Adiabatic Expansion
The jump in component spacing seen in the 5 GHz images (Figure 4) cannot be reproduced by a simple increase in observed wavelength of a helical twist of single frequency. We have investigated a combination of harmonic frequencies, , for the isothermal jet expansion model and also for an adiabatic jet expansion model in which flow acceleration occurs. In what follows we restrict our attention to the single viewing angle of 12°.
For a single frequency excited by precession of the central engine the behavior of a helical twist is predictable over many orders of magnitude of jet expansion. Difficulties arise if multiple frequencies are excited. The largest uncertainty in dealing with multiple frequencies lies in the interaction between multiple frequencies associated with the same wave mode. Numerical simulations have shown that the faster growing higher order normal modes (elliptical, triangular etc.) saturate, do not slow the growth of a helical mode wave, and decline in amplitude as the longer wavelength helical twist grows (Hardee, Clarke & Rosen, 1997). Another simulation shows that pinch mode waves show abrupt change to longer wavelength on a conically expanding axisymmetric jet (Agudo et al., 2001). Therefore we follow the assumption that a high frequency saturated wave will decline in amplitude as a lower frequency wave grows as specified by the linear theory.
4.1 Isothermal Expansion Model
We use the isothermal jet parameters of Case 2 as we are interested in structure beyond 10 mas and consider and at mas. This choice of frequencies provides the closest approximation to the wavelengths evident in 43, 22, and 5 GHz images (Figs. 1 & 4).
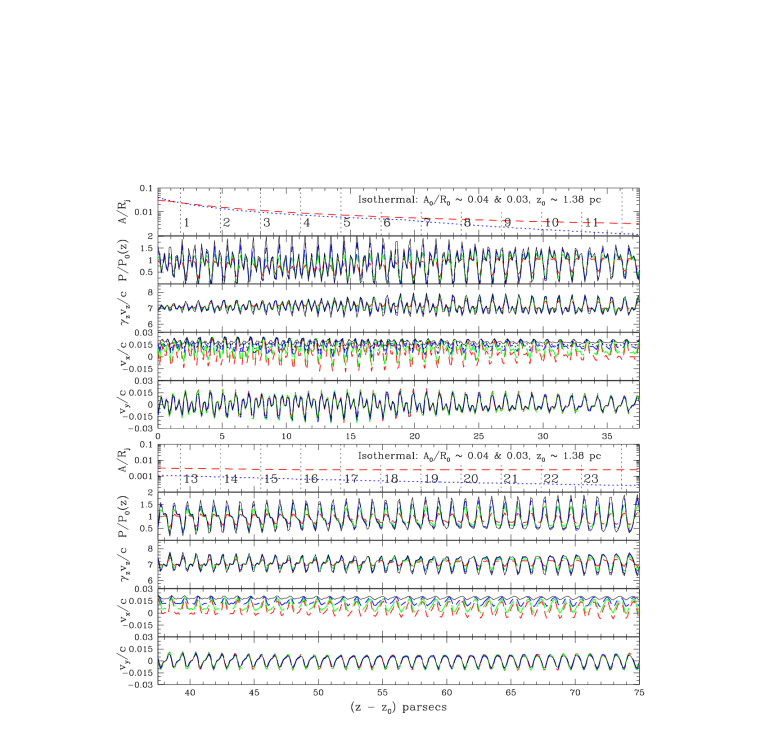
The initial wave amplitudes, and , have been chosen so that the lower frequency grows without constraint and as specified by the linear theory. The high and low frequency waves are allowed to grow at small core distances as specified by the linear theory until the combined amplitudes are saturated. At larger distances the high frequency wave is damped as the low frequency wave continues to grow as specified by the linear theory in order to keep pressure fluctuations within the “linear” limit. This damping is ad hoc as the linear equations used here provide no mechanism for damping. The wave amplitudes along with the accompanying pressure and velocity fluctuations are shown in Figure 9. In this self-consistent calculation the initial low frequency amplitude achieves pressure fluctuations of about 80% of saturation at large core distances.
A pseudo-synchrotron intensity image for the isothermally expanding jet that corresponds to the fluctuations shown in Figure 9 is shown in Figure 10. This image shows modest helical components at the longer wavelength, mas when mas, but with the less than maximal short wavelength amplitude the modest helical components that are evident when mas in Figure 8 do not appear. In part the lack of significant helical components is a result of both this choice of viewing angle and the lower jet sound speed required by Case 2, i.e., higher relativistic Mach number reduces differential Doppler boosting effects. The higher frequency wavelength shows steady wavelength increase and mas when mas. It is clear that the basic 3C 120 jet helical structure and motion can be reproduced in this fashion and a larger or smaller viewing angle can recover modest helical components in the inner 10 mas.
However, on the 3C 120 jet the higher frequency must saturate close to the core while still allowing the lower frequency to saturate farther from the core as the higher frequency is damped. This requires that the higher frequency have a larger initial growth rate than the lower frequency and this is not the case for an isothermal expansion model with and at mas. Of course, the correct ordering of growth rates will be the situation closer to the core. Nevertheless, the high frequency wave must be damped too close to the core and the low frequency wave does not reach saturation for our best fit isothermal expansion model.
4.2 Adiabatic Expansion Model
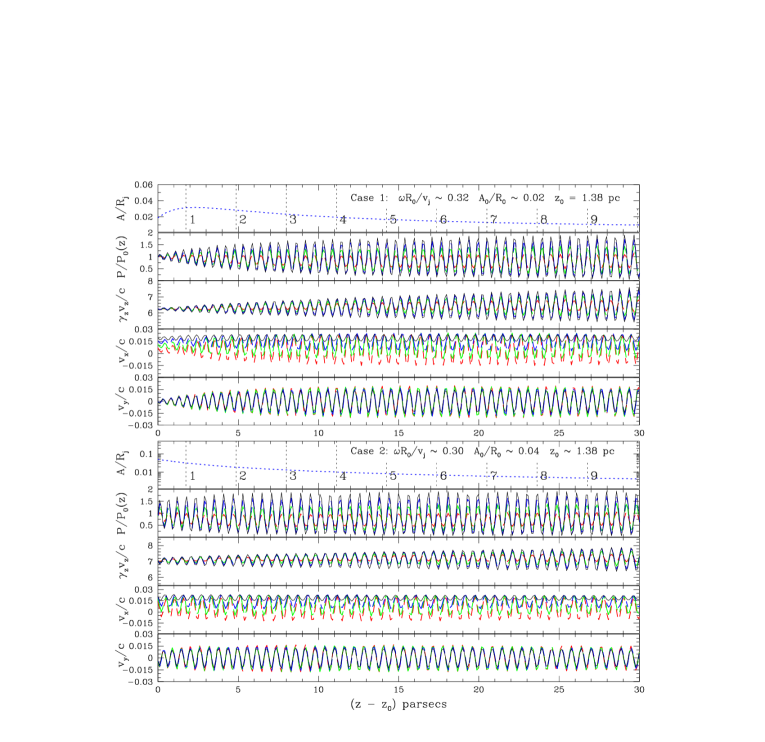
The rapid initial growth in wave amplitude for the Case 1 isothermal expansion model assumed to represent conditions nearer to the core and the higher wave speeds for the Case 2 isothermal expansion model assumed to represent conditions farther from the core suggests that a combination of jet sound speed decline and jet acceleration could reproduce the observed wavelength and proper motion behavior of helical components along the inner 30 mas of the 3C 120 jet. Here we might assume that the conditions associated with Case 1 are representative of the innermost 2 mas of the observed jet. To test this hypothesis we have constructed a self-consistent adiabatic expansion model for a viewing angle of 12° with parameters varying as indicated in Figure 11.

To produce this model we have used the adiabatic wind equation
| (13) |
along with the continuity equation
| (14) |
and
| (15) |
where with appropriate to a mixture of hot electrons and colder baryons (Synge, 1957), and to give at mas and with . In the above, constant jet expansion at fixed opening angle is assumed, i.e., .
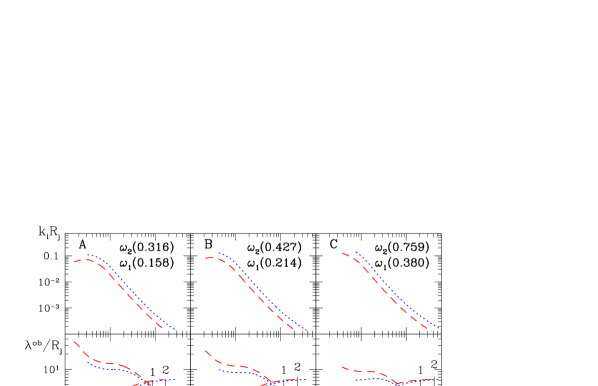
Along the adiabatically expanding jet the growth and wavelength of helical frequencies must be tracked explicitly as conditions in the jet and in the external medium change. In calculations the sound speed ratio , which gives at mas, will be assumed to remain fixed as declines. There is no particular physical reason for this choice but results are only weakly dependent on this assumption. An illustration of the growth rate, observed wave speed and observed wavelength for three different initial harmonic frequency pairs, is shown in Figure 12. All cases begin at mas ( pc) where pc and . The position mas ( pc) is indicated by vertical lines in the figure and corresponds to . The three panels span the possible frequency range that will reproduce the observed wave speed and wavelength behavior between the initial and final position. Case C begins with the high frequency at mas and is approximately the highest frequency for which . In particular, case B with and provides the best overall fit to the observed wavelengths and wave speeds. On the adiabatically expanding jet the high initial sound speeds and relatively low initial Lorentz factor put initially and for mas.
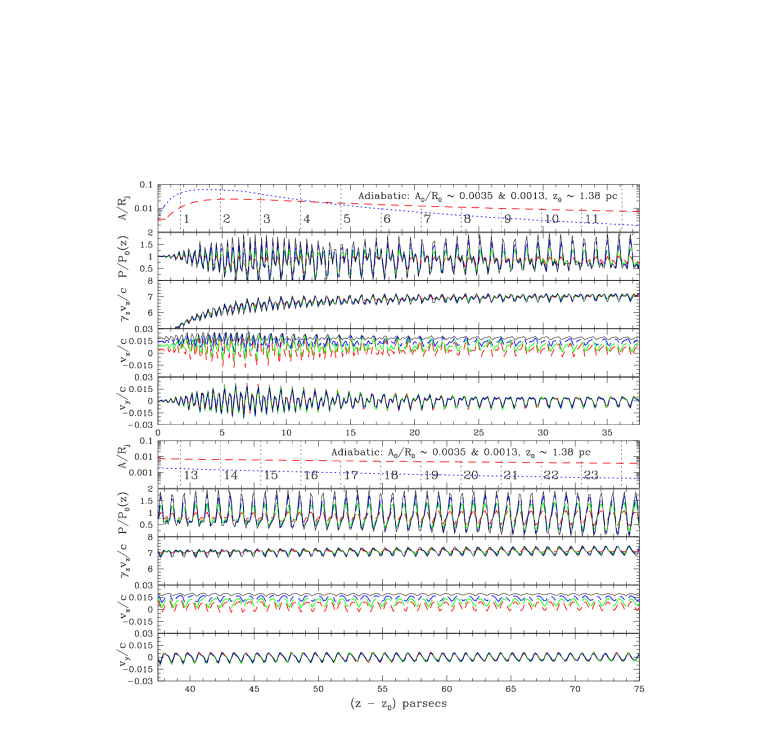
Wave growth and damping for case B along with the accompanying pressure and velocity fluctuations is shown in Figure 13. The higher frequency with initial amplitude is damped as the more slowly growing low frequency wave is allowed to grow freely from its initial amplitude, . Amplitude growth here should be compared to that shown in Figure 7 for high frequency growth near to the core and isothermal expansion, and, in particular, to Figure 9 for the development of a harmonic frequency pair on an isothermally expanding jet. Here initial amplitudes can be very small as the initial growth rates are high and reaches saturation quickly. Amplitude growth is consistent with high frequency growth to saturation subsequently supplanted at larger distance by a more slowly growing lower frequency. Reduced velocity fluctuation at larger core distance compared to the isothermal model for maximal pressure fluctuation is a result of high Lorentz factor and low jet sound speed, i.e., high relativistic Mach number . Overall, this dynamical result is more consistent with the required behavior of rapid high frequency growth followed by subsequent damping as the lower frequency grows to saturation.
A pseudo-synchrotron intensity image for the adiabatically expanding jet is shown in Figure 14. The apparent wave speed and wavelength undergoes a much more rapid initial increase than the isothermal Case 2 (Figure 8) from wavelength mas at mas to mas when mas. No additional wavelength or wave speed change for the higher frequency wave occurs beyond about 5 mas from the core. The low frequency wave dominates with mas when mas. The apparent wavelength and wave speed of the adiabatic model fits the observed wavelength and motions in the inner 30 mas of the 3C 120 jet somewhat better than the isothermal model. However, here the intensity falls much more rapidly than is observed on the 3C 120 jet. While neither model produces significant helical components at mas, the adiabatic jet shows no evidence for even modest southern helical components at mas even though the viewing angle is identical to the isothermal intensity image in Figure 10. The lack of helical components results from projection effects associated with relativistic aberration and a reduction in differential Doppler boosting.
Here the helical pattern is viewed at an angle rad when mas (see Figure 11). This has the effect of producing northern “helical” knots at 14 and 22 mas. This implies that the jet is at a viewing angle less than 12°. Differential Doppler boosting is reduced because the relativistic Mach number rises and transverse velocity fluctuation declines (see Figure 13).
4.3 An Optimized Isothermal Image
Constraints on our modeling are relaxed somewhat if much less acceleration in pattern speed is required, i.e., from about when mas to about when mas. In this case the jet can be closer to isothermal than our present results suggest, although some sound speed decline and accompanying jet acceleration are still required. Such a result proves more consistent with the observed 5 GHz intensity decline along the jet which is about a factor of 3000 (see Figure 3). In order to make better comparison with the observed radio intensities we have constructed a maximal pseudo-synchrotron intensity image based on the isothermal Case 2 harmonic frequency pair. This theoretical image along with images smoothed by Gaussian beams appropriate to 22 and 5 Ghz is shown in Figure 15.
In constructing the theoretical intensity image we have arbitrarily fixed the amplitude of the lower frequency at , i.e., achieves saturation at mas and allowed to decline while maintaining saturation of the harmonic combination. When mas velocity and pressure fluctuations are similar to the Case 2 viewing angle image shown in Figure 8. This maximizes the fluctuations at both small and larger scales.
The 5 GHz image in Figure 15 shows a steeper intensity decline than seen in the observations. Some of this difference can be explained by core absorption at 5 GHz not included in the Figure 15 image. Thus, the typical intensity decline as indicated by images at 5 GHz is on the order of isothermal. This result when combined with the somewhat better fit to overall dynamics and pattern speed provided by the adiabatic model suggests decoupling between macroscopic heating of the jet fluid as a whole, less than isothermal, and microscopic energization of the radiating electrons, at least isothermal. However, it is clear that adiabatic compressions are insufficient to give the observed helical components and the knot interknot variation observed (particularly at the higher 22 and 43 GHz frequencies). Different viewing angle can result in somewhat higher knot interknot intensity ratios at least in the innermost short wavelength region but not enough. Note that only viewing angles less than 12° are allowed as larger angles are ruled out by relativistic aberration effects. Thus, if helical components are entirely the result of projection and Doppler boosting they are not adiabatic compressions. The implication is that the leading edge of the helical pattern is a shock compression. Note that in this case the intensity might scale approximately with the jet density even if macroscopic heating is insufficient to make the jet fluid isothermal. We might also expect the intensity to be more ribbon like than the existing adiabatic compression as the pressure profile would be strongly peaked near to the jet surface. Furthermore, differential Doppler boosting effects may be enhanced by a flow field more aligned with the shock face, i.e., helical flow pitch more closely coupled to the intrinsic pitch of the helical shocked pressure and density enhancement.
5 Summary & Discussion
We have assumed that prominent components at mas are associated with a projected helical twist. These “helical” components indicate the wavelength and motion of the helical twist. Nearly constant spacing, mas, and similar motion, , of prominent components along with a “saturated” component intensity structure between mas suggests that the motion of these components could be associated with a saturated helical wave in the high frequency regime. Between mas a discontinuity in the regular pattern of components occurs and between mas the component spacing indicates a potential helical pattern with a twist wavelength mas, or about twice the wavelength inside 10 mas. The increase in component spacing is accompanied by an apparent increase in the motion of components to . Non-helical components outline a curved path in intensity contours between helical components and their motion is assumed indicative of the flow speed .
In general wave growth, wavelengths, and wave motions are consistent with jet expansion that lies somewhere between adiabatic and isothermal but closer to adiabatic. Saturation can occur naturally on the expanding jet as a consequence of jet expansion and declining growth rate of helical waves at frequencies above resonance. Modeling the observed component spacing and motion as a helical twist from 2 - 30 mas requires two harmonic twist frequencies. The higher frequency has a period of years. A typical intrinsic wavelength of the superluminally moving helical twist produced by the two frequencies is six times the jet radius. Declining jet sound speed accompanied by modest jet acceleration provides the appropriate conditions for growth of multiple frequencies. Still it is necessary to assume a damping mechanism for the high frequency wave that allows the low frequency wave to grow to saturation.
Modeling of the helical twist at the viewing angle that has been extensively considered here, suggests a decline in jet sound speed from at mas from the core to at mas from the core accompanied by some acceleration in the jet flow from Lorentz factor to . At mas is obtained in the limit . The initial sound speed estimate at mas from the core increases to at a maximum possible viewing angle of . At the larger viewing angle, higher typical Lorentz factor is required but additional jet acceleration also occurs. Thus, the initial Lorentz factor would not be too much higher than for the 12° viewing angle. However, viewing angles larger than 12° can be ruled out. At larger viewing angles relativistic aberration produces northern instead of southern “helical” knots when for mas. At smaller viewing angle the initial sound speed is less and less flow acceleration would occur. At a viewing angle of 6° the jet sound speed might be about half of the estimates at 12°, and the typical Lorentz factor would be comparable but with less variation along the jet. For mas the flow Lorentz factor is in the range for viewing angles .
Subluminal component motion at mas provides an estimate of the sound speed in the cocoon medium outside the jet. The subluminal component motion requires an external (cocoon) sound speed at mas that is relatively independent of the viewing angle. The value depends on the Lorentz factor at this location. A lower Lorentz factor requires a higher external sound speed but less than the jet sound speed by a factor 1.5 - 5 depending on viewing angle. We cannot be more accurate as only the innermost mas of the jet provides any significant information on slow moving pattern speeds. This estimate was made by assuming that the innermost subluminal components were associated with the helical twist. However, similar results will be obtained if the components are modeled as trailing pinch structures triggered by passage of a shock down the jet (Agudo et al., 2001; Gómez et al., 2001). The combination of jet expansion, jet acceleration and sound speed decline implied by our results automatically guarantees that components associated with normal modes will show rapid acceleration and increased spacing at mas. More modest increase in speeds and spacing occurs at larger core distance.
We cannot determine how the external cocoon sound speed might vary with core distance from the observations considered here. Basically any determination of the change in external sound speed requires information on low frequency or resonant wave motion far from the core and here we see only high frequency waves (far above resonance) far from the core. Note that the present values for the external sound speed and an assumed adiabatic decline are consistent with a hot slow wind around a high speed hotter jet. Such a picture may be reasonable at the parsec to tens of parsec scales that we consider here. A wind with outflow speeds of a few tenths of lightspeed influences normal mode dynamics and increases the transverse velocity fluctuation produced by a saturated pressure fluctuation, e.g., Hardee & Hughes (2003). This effect would enhance differential Doppler boosting, possibly to significant levels.
In earlier work Walker et al. (2001) showed that a flow helical pitch comparable to the intrinsic helical pitch implied by the observations can result in too much knot interknot intensity variation as a result of differential Doppler boosting. In this case differential Doppler boosting depended strongly on the viewing angle and thus knot interknot intensity variation could be used to constrain the viewing angle. Unfortunately, the present modeling of intensities as adiabatic compressions does not deliver sufficient helical projection plus differential Doppler boosting to produce the observed knot interknot intensity variations at any allowed viewing angle. Here our first order accurate flow field helical pitch is strongly decoupled and much less than the intrinsic helical pitch of the pressure and density enhancement. Differential Doppler boosting could be enhanced by a significant wind around the jet. Alternatively the apparent decoupling between the macroscopic fluid properties implied by an accelerating cooling jet and the microscopic radiating particle properties implied by an isothermal decline in the intensity can be taken to indicate the presence of a shock along the leading edge of the helix. The presence of a shock would more nearly align the flow field parallel to the shock face and enhance differential Doppler effects. The investigation of these possible effects is beyond the scope of this paper.
Finally our dynamical modeling implies that macroscopic viscosity and heating are relatively low along this jet, at least when compared to the energization requirements of the radiating electrons implied by our intensity modeling. A low macroscopic viscosity is consistent with the requirement that a relatively sharp velocity discontinuity between jet and cocoon must be present in order for high frequency short intrinsic wavelength helical patterns to exist. The requirement of sharp velocity discontinuity indicates a relatively low rate of mass entrainment. Broad velocity shear, indicative of higher macroscopic viscosity and mass entrainment, would eliminate coherent structures based on short normal mode wavelengths, e.g., Birkinshaw (1991). Note however, that a shear layer increasing in thickness proportionally to the jet radius may be one reason for a growing lower frequency wave supplanting a higher frequency wave. The higher frequency shorter intrinsic wavelength would be damped as the jet expands and the shear layer grows in thickness while the lower frequency longer intrinsic wavelength could continue to grow.
Appendix A Observations at 5 GHz
The 5 GHz images presented in Figure 2 are based on global VLBI observations of 3C 120 made on 1999 February 11 (1999.11) and on 1999 September 21 (1999.72). The data are from the ground stations involved in Halca orbiting VLBI observations. The data were recorded in 2 baseband channels of 16 MHz each using an array, in February, of 19 antennas; the Very Long Baseline Array (VLBA — 10 antennas), the phased Very Large Array, the Green Bank 140 foot, and 7 antennas of the European VLBI Network (Effelsberg, Jodrell Bank, Medicina, Noto, Onsala, Westerbork, and Sheshan). In September, the array was somewhat smaller with Green Bank, Onsala, Noto, and Sheshan not included.
Correlation was done on the VLBA correlator and data reduction was done in AIPS. The gain normalization during self calibration was restricted to the VLBA antennas. The flux density scale is good to around 5%. A bandpass calibration was done to help achieve high dynamic range by minimizing closure errors. Many iterations of self calibration and imaging were required because of the complexity of the source — much of the structure is outside the windows displayed in this paper. The final off-source rms noise levels were 49 and 41 Jy beam-1 for the February and September images respectively. On-source errors, as usual, are expected to be significantly higher.
We thank John Benson of NRAO for his significant contributions to the processing of these observations. The eventual main publication of these observations will show structures on significantly larger scales than those displayed here. They also will include the much higher resolution images based on the Halca spacecraft data.
References
- Agudo et al. (2001) Agudo, I., Gómez, J.L., Martí, J.M., Ibáñez, J.M., Marscher, A.P., Alberdi, A., Aloy, M.A., & Hardee, P.E. 2001, ApJ, 549, L183
- Aloy et al. (1999b) Aloy, M.-A., Ibáñez, J.-M., Martí, J.-M., Gómez, J.-L., & Müller, E. 1999, ApJ, 523, L125
- Aloy et al. (1999a) Aloy, M.-A., Ibáñez, J.-M., Martí, J.-M., & Müller, E. 1999a, ApJS, 122, 151
- Aloy et al. (2000) Aloy, M.-A., Gómez, J.-L., Ibáñez, J.-M., Martí, J.-M., & Müller, E. 2000, ApJ, 528, L85
- Aloy et al. (2003) Aloy, M., Martí, J., Gómez, J., Agudo, I., Müller, E., & Ibáñez, J. 2003, ApJ, 585, L109
- Baldwin et al. (1980) Baldwin, J.A., Carswell, R.F., Wampler, E.J., Smith, H.E., Burbidge, E.M., & Boksenberg, A. 1980, ApJ, 236, 388
- Birkinshaw (1991) Birkinshaw, M. 1991, MNRAS, 252, 505
- Clarke, Norman, & Burns (1989) Clarke, D.A., Norman, M.L., & Burns, J.O. 1989, ApJ, 342, 700
- Duncan & Hughes (1994) Duncan, G.C., & Hughes, P.A. 1994, ApJ, 436, L119
- Falle & Komissarov (1996) Falle, S.A.E.G., & Komissarov, S.S. 1996, MNRAS, 278, 586
- Gómez et al. (1997) Gómez, J. L., Martí, J.-M., Marscher, A.P., Ibáñez, J.-M., & Alberdi, A. 1997, ApJ, 482, L33
- Gómez et al. (1998) Gómez, J.L., Marscher, A.P., Alberdi, A., Martí, J.M., & Ibáñez, J.M. 1998, ApJ, 499, 221
- Gómez, Marscher, & Alberdi (1999) Gómez, J.L., Marscher, A.P., & Alberdi, A. 1999, ApJ, 521, L29
- Gómez et al. (2000) Gómez, J.L., Marscher, A.P., Alberdi, A., Jorstad, S.G., & Garcia-Miró, C. 2000, Science, 289, 2317
- Gómez et al. (2001) Gómez, J.L., Marscher, A.P., Alberdi, A., Jorstad, S.G., & Agudo, I. 2001, ApJ, 561, 161
- Hardee (1987) Hardee, P.E. 1987, ApJ, 318, 78
- Hardee (2000) Hardee, P.E. 2000, ApJ, 533, 176
- Hardee (2003) Hardee, P.E. 2003, ApJ, 597, 798
- Hardee, Clarke & Rosen (1997) Hardee, P.E., Clarke, D.A., & Rosen, A. 1997, ApJ, 485, 533
- Hardee & Hughes (2003) Hardee, P.E., & Hughes, P.A. 2003, ApJ, 583, 116
- Hardee et al. (2001) Hardee, P.E., Hughes, P.A., Rosen, A., & Gomez, E. 2001, ApJ, 555, 744
- Hardee et al. (1998) Hardee, P.E., Rosen, A., Hughes, P.A., & Duncan, G.C. 1998, ApJ, 500, 599
- Hughes et al. (2002) Hughes, P.A., Miller, M.A., & Duncan, G.C. 2002, ApJ, 572, 713
- Jones, Ryu, & Engel (1999) Jones, T.W., Ryu, D., & Engel, A. 1999, ApJ, 512, 105
- Koide, Nishikawa, & Mutel (1996) Koide, S., Nishikawa, K.-I., & Mutel, R.L. 1996, ApJ, 463, L71
- Lobanov, Hardee, & Eilek (2003) Lobanov, A., Hardee, P., & Eilek, J. 2003, The Physics of Relativistic Jets in the CHANDRA and XMM Era, New Science Reviews, 47, 629
- Lobanov & Zensus (2001) Lobanov, A.P., & Zensus, J.A. 2001, Science, 294, 128
- Marscher et al. (2002) Marscher, A.P., Jorstad, S.G., Gómez, J.L., Aller, M.F., Teräsranta, H., Lister, M.L., & Stirling, A.M. 2002, Nature, 412, 625
- Martí, Müller, & Ibáñez (1994) Martí, Müller, & Ibáñez 1994, A&A, 281, L9
- Perucho et al. (2004) Perucho, M., Hanasz, M., Martí, J.M., & Sol, H. 2004, A&A, in press
- Steffen et al. (1995) Steffen, W., Zensus, J.A., Krichbaum, T.P., Witzel, A., & Qian, S.J. 1995, A&A, 302, 335
- Stone, Xu, & Hardee (2000) Stone, J.M., Xu, J., & Hardee, P.E. 1997, ApJ, 483, 136
- Synge (1957) Synge, J.L. 1957, The Relativistic Gas, (Amsterdam:North-Holland)
- Walker, Benson, & Unwin (1987) Walker, R.C., Benson, J.B., & Unwin, S.C. 1987, ApJ, 316, 546
- Walker et al. (2001) Walker, R.C., Benson, J.B., Unwin, S.C., Lystrup, M.B., Hunter, T.R., Pilbratt, G., & Hardee, P.E. 2001, ApJ, 556, 756
- Xu, Hardee, & Stone (2000) Xu, J., Hardee, P.E., & Stone, J.M. 2000, ApJ, 543, 161