A Change in the Physical State of Carinae?11affiliation: This research is part of the Hubble Space Telescope Treasury Project for Eta Carinae, supported by grants GO-9420 and GO-9973 from the Space Telescope Science Institute, which is operated by the Association of Universities for Research in Astronomy, Inc., under NASA contract NAS5-26555.
Abstract
During Car’s spectroscopic event in mid-2003, the stellar wind’s bright H and H emission lines temporarily had a distinctive shape unlike that reported on any previous occasion, and particularly unlike the 1997–98 event. Evidently the structure of the wind changed between 1997 and 2003. Combining this with other evidence, we suspect that the star may now be passing through a rapid stage in its recovery from the Great Eruption seen 160 years ago. In any case the data indicate that successive spectroscopic events differ, and the hydrogen line profiles are quantitative clues to the abnormal structure of the wind during a spectroscopic event.
1 INTRODUCTION
Systematic spectral variations are clues to the nature of Car — our most observable very massive star dangerously close to the Eddington limit, and the site of a prototype “supernova impostor” eruption seen about 160 years ago. On several occasions between 1945 and 1990 the general excitation or ionization decreased for a few months, in the stellar wind and also in slow-moving ejecta located within 1000 AU of the star (see Zanella et al. (1984); Davidson & Humphreys (1997); Damineli et al. (1999); Davidson et al. (1999a); and other refs. cited therein). Prompted by a fresh example observed in 1992, Damineli (1996) noticed that these events recur in a 5.5-year cycle which had also appeared in photometry (Whitelock et al., 1994). The next two spectroscopic events occurred near 1998.0 and 2003.5, close to the predicted times.
As noted in Section 5 below, at least three rival scenarios may explain an event of this type. The star may eject a shell, possibly triggered by a hypothetical companion star in a 5.5-year orbit; the excitation of our side of the wind may temporarily decrease when a hot secondary star moves to the far side of its orbit; UV radiation from a hot companion may become engulfed in the primary wind near periastron; or some mixture of these effects may occur. Unfortunately no quantitative model has been developed, and one can imagine other possibilities. A strange detail, highly relevant to the discussion in this paper, is that the 5.5-year cycle probably did not exist before the 1940’s – at least not in its present form; see Section 5 below and references cited there.
Suitable data on these events were scarce until recently. Ground-based spectroscopy of the star is seriously contaminated by diffuse ejecta located at radii 0.2″ – 2″; and, so far as we know, no long-term, spatially consistent ground-based observations of a broad wavelength range were attempted. The Hubble Space Telescope (HST) can attain the required high spatial resolution, but was used for spectroscopy of Car on only a few occasions from 1991 to 2001 – fortunately including part of the 1997–98 event (see below). The fund of available data greatly improved during 2002–03, when we obtained numerous HST observations using the Space Telescope Imaging Spectrograph (STIS) as part of a Hubble Treasury Project to observe the 2003.5 event (Davidson et al., 2002).
Here we report a particularly striking result: H and H, the brightest observable emission lines in the stellar wind, briefly developed unusual velocity profiles which were quite different from their appearance during the previous event in 1997–98. This development, combined with other circumstances noted in Sections 4 and 5 below, leads us to suspect that Car may now be passing through an unusually rapid phase in its recovery from the 19th-century Great Eruption. Independent of this conjecture, our data show that the 5.5-year cycle is not a straightforward clocklike affair; while the emission-line behavior reported here is essential for modeling the spectroscopic event. Parallel ground-based observations of the polar-latitude spectrum reflected by the “Homunculus” ejecta-nebula will be described in a companion paper by Weis et al. (2005).
2 THE OBSERVATIONS
In this paper the name Car denotes only the central star and its wind, excluding ejecta at radii larger than 0.1″ or about 200 AU. During 1998–2003 we observed it with the HST/STIS/CCD on 21 occasions, about half of them during 2003. Table 1 lists the observation dates specifically mentioned in this paper; for more information see http://etacar.umn.edu, and/or the HST archives at http://stsci.edu. The spectroscopic cycle has period = 2023 7 d 5.54 y, based on photometry, spectroscopic variations, and X-ray observations (Feast et al., 2001; Whitelock et al., 2004; Damineli et al., 2000; Corcoran, 2004). Since the circumstellar extinction has diminished rapidly in recent years, causing a dramatic increase in the star’s apparent brightness (Davidson et al., 1999b; Martin and Koppelman, 2004), we measure emission line profiles relative to the underlying continuum. Lines and continuum all originate in the opaque stellar wind, not at the star’s surface (Davidson, 1987; Davidson et al., 1995; Davidson & Humphreys, 1997; Hillier et al., 2001).
Each spectrum discussed below represents essentially a 0.1″ 0.15″ spatial sample: the pixel size was about 0.05″, the slit width was about 2 CCD columns, each extraction sampled about 3 CCD rows, and the spectral resolution was roughly 40 km s-1. (Here we omit some technicalities that have little effect on the main results.) For the bright H and H lines we use only data with integration times less than 1 s and 20 s respectively, short enough to avoid saturation of any CCD pixels; and we have verified that in fact none were saturated. Other instrument parameters and our non-standard reduction techniques, inessential for this paper and too complex to describe briefly, can be found at http://etacar.umn.edu and will be reviewed in a series of later, more detailed papers. Doppler velocities quoted below are all heliocentric.
3 BEHAVIOR OF THE HYDROGEN EMISSION LINES
Figure 1 shows how H, the brightest observable feature, varied during 1998–2003. The conspicuous absorption near km s-1 must occur far outside the stellar wind, since it appears in STIS data across much of the inner Homunculus Nebula. Its central wavelength varies with position, in a way that differs substantially from the net Doppler shift of the star’s spectrum reflected by dust in the expanding ejecta. This absorption feature fluctuates in strength and confused earlier ground-based observations; see Fig. 4 in Davidson et al. (1999a), Fig. 2 in McGregor et al. (1999), or Fig. 4 in Humphreys, Davidson, & Smith (2002). Unfortunately it masks part of the intrinsic line profile.
Apart from the extraneous narrow absorption, during the 1997–98 spectroscopic event H resembled a conventional stellar-wind emission feature with a rounded peak, P Cyg absorption around km s-1, and extended wings probably due to Thomson scattering (Fig. 1a). Hillier et al. (2001) described a wind model that accounted for the early-1998 spectrum fairly well; see also Davidson et al. (1999a). By 1999, however, P Cyg absorption had almost disappeared along our line of sight to the star (Fig. 1b). Meanwhile the P Cyg feature remained prominent at polar latitudes, observed via reflection in the southeast Homunculus lobe (Smith et al., 2003). Most likely this difference indicates that the stellar wind between events is denser near the poles than it is at lower latitudes. If so, then Car’s photosphere, located in its wind, usually has a prolate shape (see also van Boekel et al. (2003)) – except, perhaps, during a spectroscopic event. The line profile varied with no clear trend or pattern during 1999–2002 (Fig. 1b). Naturally we expected H to resemble its early-1998 form during the 2003.5 event.
Fig. 1c shows that in fact it behaved quite differently.
Our 2003.51 and 2003.58 observations bracketed the time when
5.54 years had elapsed since the earliest STIS data;
in order to simplify the figure we omit the 2003.51 profile,
which closely resembled 2003.58 but was slightly higher.
Comparing the 2003.58 data to 1998.00, one finds that —
The line center at 2003.58 had a remarkably flat top
with ,
only about half the relative height seen in 1998.
The long-wavelength wing in 2003 was about 30% lower
than in 1998. (Due to the Thomson scattering process, this is
expected to be relatively insensitive to the viewing direction.)
The short-wavelength side and the P Cyg feature behaved
more or less the same in 2003 as they had in 1998 – except, perhaps,
that P Cyg absorption appeared deeper at 2003.58 than it
did at 1998.00.
The total H equivalent width at 2003.58 was
550 Å, compared to 880 Å at 1998.00 – nearly a 40% decrease.
In summary, the flux temporarily decreased at Doppler
velocities around zero during the 2003 spectroscopic event, but
not in the preceding one.
The 2003.37 and 2003.72 curves in Fig. 1c illustrate a more subtle trend that occurred around the time of the event. Several weeks before 2003.5 the maximum flux occurred at negative Doppler velocities; then, between 2003.5 and 2003.7, the top of the profile tilted smoothly so that afterward the maximum was on the positive-velocity side. If one were to measure the line centroid during the entire 5.5-year cycle (somehow allowing for the extraneous absorption near km s-1), then a systematic fluctuation would appear, resembling those shown in Damineli et al. (1997) and Damineli et al. (2000); but this involves complex variations in the line shape, and does not represent a classical orbital velocity curve. (See also Davidson (1997, 1999); Davidson et al. (2000) and other refs. cited therein.) We shall return to this point in Section 5 below.
By 2003.88 the H profile had recovered to a more normal appearance (Fig. 1d), strongly suggesting that the flat top was related to the spectroscopic event.111 Later STIS observations in March 2004 showed a profile much like 2003.88, but slightly stronger. We are not aware of any observation of a flat-topped H profile in previous direct spectroscopy of Car, including ground-based data obtained during the weeks preceding the 1998.0 STIS observations (see McGregor et al. (1999)). Broad flat-topped line shapes can be seen, however, in some ground-based observations of the southeast Homunculus lobe, reflecting a polar view of the wind (Rivinius et al., 2001; Weis et al., 2005).
A line profile of this type is not, per se, very surprising. It is well known that an idealized, optically thin expanding shell produces rectangular line shapes, and the “optically thin” proviso is not very strict; a flat-topped profile occurs whenever the observed emission represents the vicinity of a quasi-spherical expanding surface. This situation can arise in an ejected shell, or, alternatively, near a localized abrupt gradient in ionization, excitation, or (as an anonymous reviewer suggests) continuum opacity. Flat-topped line profiles can also result from very different configurations, e.g. from a pair of oppositely-directed polar flows viewed at an oblique angle. In this paper we do not advocate any one model in particular. Rather, we wish to emphasize a basic puzzle and surprise: Flat-topped hydrogen line profiles characterized the 2003 spectroscopic event but not the preceding one in 1997-98.
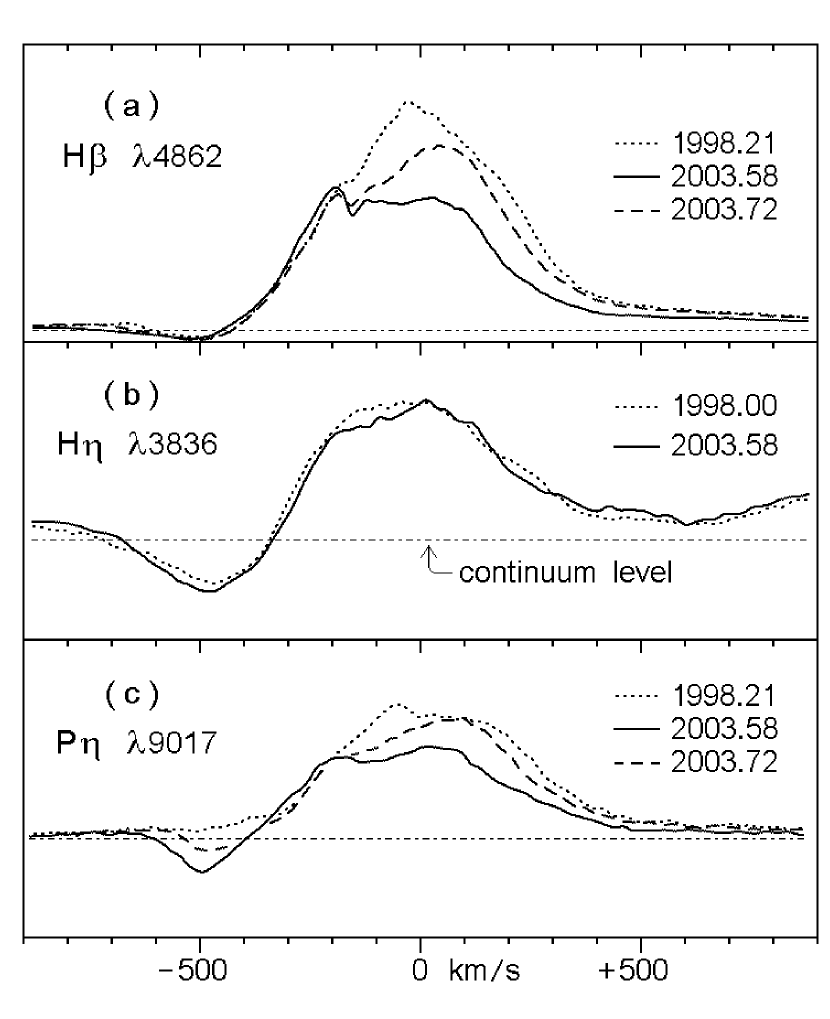
Figure 2 shows three other hydrogen lines in 1998 and 2003. H and P behaved qualitatively like H. In the 2003.58 data H had a flat top at about , while its extraneous absorption near km s-1 was weak because this line has a smaller oscillator strength than H. On the other hand H, the high-order Balmer line which is least confused with adjoining features, did not show much difference between 1998.00 and 2003.58; on both occasions it resembled a compromise between the 1998 (high-peaked) and the 2003 (flat-topped) shapes seen in H and H. In wind models like that described by Hillier et al. (2001), H originates at smaller radii than do H and H. The Paschen lines are somewhat more difficult to interpret in this object (Davidson et al., 2000). Emission lines of Fe II and He I varied in more complex ways, beyond the scope of this paper.
On three occasions before the STIS became available, the HST’s Faint Object Spectrograph (FOS) was used to obtain spectra of Car with spatial resolution better than 0.3″ (Davidson et al., 1995; Humphreys et al., 1999). Since H was too bright to observe with the FOS, Table 2 lists the equivalent width of H from 1991 to 2003. By a significant margin, the smallest observed values occurred during the 2003 event.
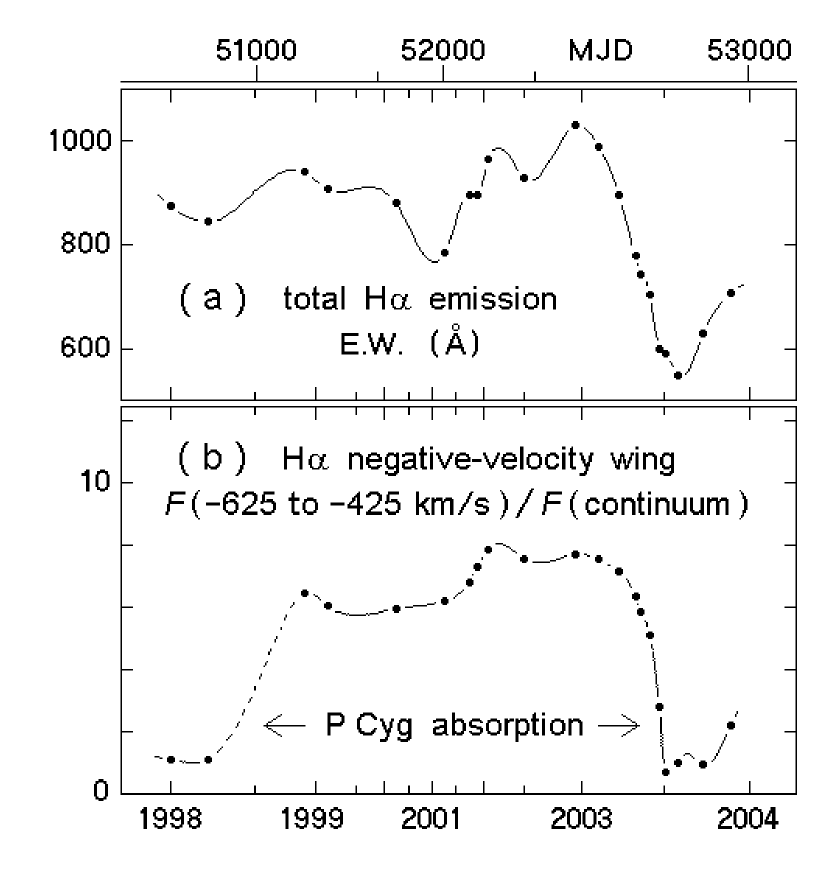
Figure 3 shows how the total H emission and its P Cyg absorption
varied with time. The 2003 event provided the following clues regarding
H and H:
Some developments occurred rapidly. For instance,
as P Cyg absorption deepened, the H flux at Doppler velocities
near km s-1 declined from
to in 21 days, and then fell to
only in the next 12 days.
Other characteristics appeared earlier
and developed more gradually. The decrease in
total H emission was well underway at 2003.24,
three months before the rapid stage of the event.
(Note the smooth turnovers soon after 2003.0
in both parts of Fig. 3.)
The P Cyg absorption feature did not vanish as abruptly
as it had deepened; it remained substantial five months after
the rapid phase mentioned above. (In Fig. 1d, compare
2003.88 to 2003.12 at velocities around km s-1).
The FOS and STIS data suggest, albeit uncertainly,
that H and H may tend to be brightest between
1.5 and 0.5 years before an event.
Some of these remarks have parallels in other reported observations, such as near-infrared photometry (Whitelock et al., 2004), helium line strengths seen in ground-based data (Damineli et al., 1999), and the X-ray flux (Corcoran, 2004). Spectroscopy of the type reported here is especially valuable, however, because it is more specific; it samples larger numbers of observables and structural parameters of the wind than X-rays or photometry do. (Photometry, moreover, is affected by varying circumstellar extinction, while the observable 2–10 keV X-rays probably represent only the hottest parts of a localized shock structure, almost independent of the large-scale wind.)
In summary, we have found an element of paradox in the 1998–2003 spectroscopic cycle: the H profile was least flat-topped during the 1997–98 event, but then was most flat-topped during the 2003 event (Fig. 1). Since it partially recovered after 2003.7, this is not simply a long-term trend.
4 RECENT ABNORMALITIES
Whenever moderate changes are seen in Car, one is tempted to ascribe them to routine LBV-style outbursts and fluctuations like those reviewed by Humphreys & Davidson (1994). In this case, however, two circumstances make that view unappealing.
First, the minimum intensity and maximum flattening of H coincided perfectly with the mid-2003 spectroscopic event (Figs. 1c and 3). If the previous event in 1997–98 had not been observed, we would now assume that this behavior is merely a detail of the 5.5-year cycle. In fact, however, the earlier STIS data and ground-based spectroscopy reported by McGregor et al. (1999) show that no similar development occurred in 1997–98. Other emission lines also differed between 1998.0 and 2003.5, but they are more complex and will be discussed in a later, more detailed paper. Admittedly each spectroscopic event may be sensitive to irregular underlying LBV-like fluctuations, but a second anomaly also occurred during the same period: Car has exhibited unusual photometric behavior since 1997.
In 1998 and again in 2003, the star’s apparent brightness increased at an extraordinary rate and did not appreciably subside later (Davidson et al., 1999b; Martin and Koppelman, 2004; Whitelock et al., 2004). Two facts indicate that this was not merely a normal aspect of the 5.5-year cycle. First, it coincided with the most extreme rise in the ground-based photometric record of the past 50 years (see remarks in next paragraph). Second, the central star has brightened by a factor too large to have occurred repeatedly before 1998; if it continues at the rate observed with STIS, then after only two or three more 5.5-year periods the star will appear nearly as bright as it did 200 years ago, when there was little circumstellar extinction.222 This remark should not be construed as a prediction, though such a development is quite possible. Our point is that the recent brightening was, indeed, a major development.
Some authors – Sterken et al. (1999); van Genderen et al. (2003); Whitelock et al. (2004) – interpret the recent brightening as a relatively ordinary phenenon, perhaps a normal “LBV S Dor phase,” but such a view is difficult to sustain even if one ignores the HST photometry. It is true that ground-based photometry showed one or two earlier examples of rapid brightening, especially around 1981 when the Homunculus brightened by 0.3 magnitude at visual wavelengths. In some published figures, the 1981 episode appears more conspicuous than the 1998–99 increase merely because it had more data points; see Fig. 2b in Davidson et al. (1999b) and Fig. 7 in Martin and Koppelman (2004). However, soon after 1981 the brightness subsided by nearly the same amount, so there was no departure from the longer-term trend line. The 1996–2004 visual-wavelength record shows a larger increase, while – more important – the brightness has not returned to “normal.” In 2003 it was still almost 0.3 magnitude above the average 1952–1992 trend line. This has not been an ordinary LBV or S Dor eruption, since the spectrum has not changed appropriately. Moreover, the above statements refer mainly to the Homunculus, while our HST photometry of the central star shows a far more dramatic increase since 1997 (see below). This must be a recent development, not a continuation of a long-term trend, since an extrapolation of the 1997–2003 rate of change back to about 1985 would “predict” that the central star should have been fainter than the Weigelt condensations at that time, contrary to speckle observations reported by Weigelt & Ebersberger (1986) and Hofmann & Weigelt (1988). In other words, the rate must have accelerated sometime in the 1990’s. Altogether, then, Car’s brightening since 1997 has not been like anything else in the modern photometric record. Something similar may have occurred in 1938–1952 (de Vaucouleurs & Eggen, 1952; O’Connell, 1956), but not more recently.
Some interpretive details are essential. During 1998–2003 the apparent red-wavelength brightness of the central star tripled according to HST/STIS observations (Martin and Koppelman, 2004), and the visual-wavelength increase was probably larger. Since the star is close to the Eddington limit and has shown only moderate spectral changes, this development cannot have been entirely an intrinsic brightening; it must have included a rapid decrease of the circumstellar extinction. For reasons noted by Davidson et al. (1999b), this almost surely indicates a real decrease in the amount of dust near the star ( AU), and not, e.g., movement of a dusty condensation that intercepts our line of sight. Either existing dust was destroyed, or the dust formation rate decreased in the mass outflow a few hundred AU from the star, or both. Plausible causes involve changes in the stellar wind and/or its emergent radiation field. Therefore it is not easy to explain the recent brightening without invoking some change in the star itself.
5 IMPLICATIONS
Thus, two concurrent developments – a striking difference between the 1998.0 and 2003.5 spectroscopic events, and the unprecedented brightening in 1998–2003 – lead us to suspect that Car’s outer layers have recently changed at an unusually rapid rate. This possibility is consistent with certain earlier peculiarities in the historical record, and with the physical state of the object.
This star’s thermal and rotational structure has been gradually recovering from the Great Eruption that occurred in the 1840’s (Davidson & Humphreys, 1997; Humphreys, Davidson, & Smith, 1999; Davidson, 2000; Humphreys, Davidson, & Smith, 2002; Smith et al., 2003). One might assume that today, 160 years after the eruption, the star has approached a quasi-steady state, and that the long-term photometric brightening is caused only by expansion of dusty ejecta. But such a guess appears to be incorrect: a pronounced systematic He I 10830 decrease observed since 1980 (Damineli et al., 1999), the spectroscopy reported in this paper, and other factors all indicate that the structure of the wind continues to evolve. Therefore, presumably, so does the outer structure of the star, and the overall timescale seems theoretically reasonable (Maeder, 2005). Lacking exact models for the readjustment process, we should not be very surprised if the luminosity, radius, and wind parameters occasionally exhibit abnormal rates of change. Humphreys, Davidson, & Smith (1999) and Humphreys (2005a) have noted that four remarkable episodes – the Great Eruption, the second eruption in the 1890’s, a mysterious photometric-spectroscopic change during the 1940’s (see below), and the recent brightening – were separated by roughly 50-year intervals. Even if this timescale proves illusory, the developments just named were clearly real.
For example, evidence indicates that the present-day form of the 5.5-year cycle first appeared sometime in the 1940’s. Feast et al. (2001) have found that spectrograms from the years 1899–1919 show no sign of He I emission at the level now usually observed in Car, and Humphreys (2005b) has extended the same statement to 1941 based on spectrograms in the Harvard plate collection. Apparently, during that entire period the stellar wind was in its “low-excitation” state, now seen only during a spectroscopic event. A high-excitation state appeared, however, sometime before the early 1950’s (Gaviola, 1953). Meanwhile the photometric behavior changed dramatically during the same era. Following about 40 years of near-constant apparent magnitude, Car brightened significantly between 1938 and 1941 (O’Connell, 1956); then de Vaucouleurs & Eggen (1952) observed an extremely rapid jump, after which the consistent photometric trend of 1952–1992 began. Therefore the photometric trend and the spectroscopic state both changed conspicuously in an interval of less than 15 years. The role of that episode in the current binary vs. single-star puzzle is unclear, but a change in the observed stellar wind almost certainly occurred. Most likely the mass-loss rate was substantially larger before 1938, or at least a lower-density zone at low latitudes (Smith et al., 2003) did not exist then. The 1938–52 change may have been the stage of recovery when the surface rotation rate had spun up to a rate sufficient for the polar and equatorial wind zones to separate. Regardless of the precise explanation, the record of those years suggests that a new and roughly analogous development might occur again.
Certain ground-based observations support the idea that a rapid development is now underway. During the past 20 years the He I 10830 emission has shown a clear secular trend toward lower intensity (Damineli et al., 1999); indeed those authors’ Figure 2 seems to foretell a culmination of the trend in the near future. Some parameters of the 5.5-year cycle in near-IR photometry (Whitelock et al., 1994) may also show progressive tendencies, admittedly less definite than the He I 10830 behavior.
In summary: The STIS spectroscopy reported in this paper, HST and other photometry, Damineli’s He I 10830 observations, the 1938–52 precedent, and additional factors together inspire our suspicion that Car is now in an usually rapid stage of its post-eruption thermal and rotational recovery. We do not claim to have proven this conjecture, and quantitative models are obviously needed; but the qualitative hypothesis appears coherent, plausible, and interesting.
Without theoretical models far beyond the scope of this paper, one cannot make a detailed forecast. The star may become more stable during the next 10 or 20 years, as it probably was before the year 1700, perhaps with a decreased mass-loss rate. Less likely, the wind might instead increase, as it did between 1750 and 1830 (Davidson & Humphreys, 1997; Humphreys, Davidson, & Smith, 2002). In either case we should not be surprised if the latitude structure discussed by Smith et al. (2003) evolves on the same time scale, related to the surface rotation rate. Assertions like these are not qualitatively new, but we suggest that the relevant time scale may currently be only 10 or 20 years rather than more than 40 years as usually assumed in the past. Even if the rate of brightening abates somewhat from its recent average, by about the year 2020 the central star will have become brighter than the Homunculus Nebula and their total will be of 4th apparent visual magnitude – in other words, to the unaided eye Car will appear much as it did to Halley more than three centuries ago.
Independent of the conjecture expressed above, the HST/STIS data reported in Section 3 provide valuable information on the nature of a spectroscopic event, unmatched by any existing ground-based data. The H profile seen in mid-2003 is difficult to interpret because it represents a complex morphology, not necessarily spherical. The main difference between the 1998.0 and 2003.5 profiles (Fig. 1) is that material with Doppler velocities near zero, either slow-moving gas or else mass flow near the plane of the sky, became less conspicuous during the 2003 event. The absence of a central line peak accounts for most of the decrease in total emission.
Several rival explanations of Car’s spectroscopic events
are available:
Each event may be primarily a mass-ejection episode
a là Zanella et al. (1984), or at least a global disturbance
in the wind geometry. The ejection morphology may be shell-like or
toroidal, and the event may be triggered by the close approach of
a hypothetical companion star – although the latter detail is
not a necessary part of this scenario.
Alternatively, temporary spectroscopic changes of the
same type may result if a hot secondary star moves behind the primary
wind, so that its UV photons cannot excite the side of the
wind that faces us. (This is not, properly speaking, an
eclipse, since the hypothetical secondary star does not directly
contribute much to the brightness at any time.)
Or, perhaps, the excitation and ionization of visible
parts of the primary wind may decrease when a hot secondary
star’s ultraviolet photons become engulfed, near periastron,
in the primary’s dense inner wind.
Other possibilities may exist but these are the most obvious.
They are merely ideas, not models; none of
them is straightforward, none of them has been calculated, and they
are not mutually exclusive (Davidson, 1999). Unfortunately the observations
reported here do not provide an immediate, simple qualitative test,
As we noted in Section 3, flat-topped emission lines seem especially
natural in an expanding shell; but this remark does not
prove the other two ideas wrong. Instead of advocating a particular
scenario, here we draw attention to two points: (1) The line profiles
and flux variations observed with STIS provide essential constraints
for realistic models, and (2) one must ask why the 1997-98 event
did not exhibit the same emission-line behavior.
Several other aspects of our data merit consideration. For instance, the line peak shifted from negative to positive velocities during the 2003 event – e.g., compare 2003.37 to 2003.72 in Fig. 1c. In a binary-star model this may be a clue to the orbit orientation. In almost every proposed binary scenario, the 5.5-year orbit is highly eccentric () and a spectroscopic event occurs near periastron. Suppose the major axis is roughly perpendicular to our line of sight, and in mid-2003 the hot companion star was near periastron and moving away from us. In that case, before and after periastron it would have tended to excite material, respectively, on our side of the primary wind and then on the other side – emphasizing negative and then positive velocities as observed. The same arrangement can account for the fact that H P Cyg absorption, the X-ray flux, and some other observables change rapidly just before the event reaches its maximum, and recover more gradually afterward. This orbit orientation has been advocated by Ishibashi (2001) and Davidson (2002) regarding the X-ray behavior, but it is quite different from that proposed by, e.g., Damineli et al. (2000) and Pittard & Corcoran (2002). Caveat: Like most discussions of binary models for Car, these remarks are highly speculative and one can easily invent alternatives (Davidson, 1999).
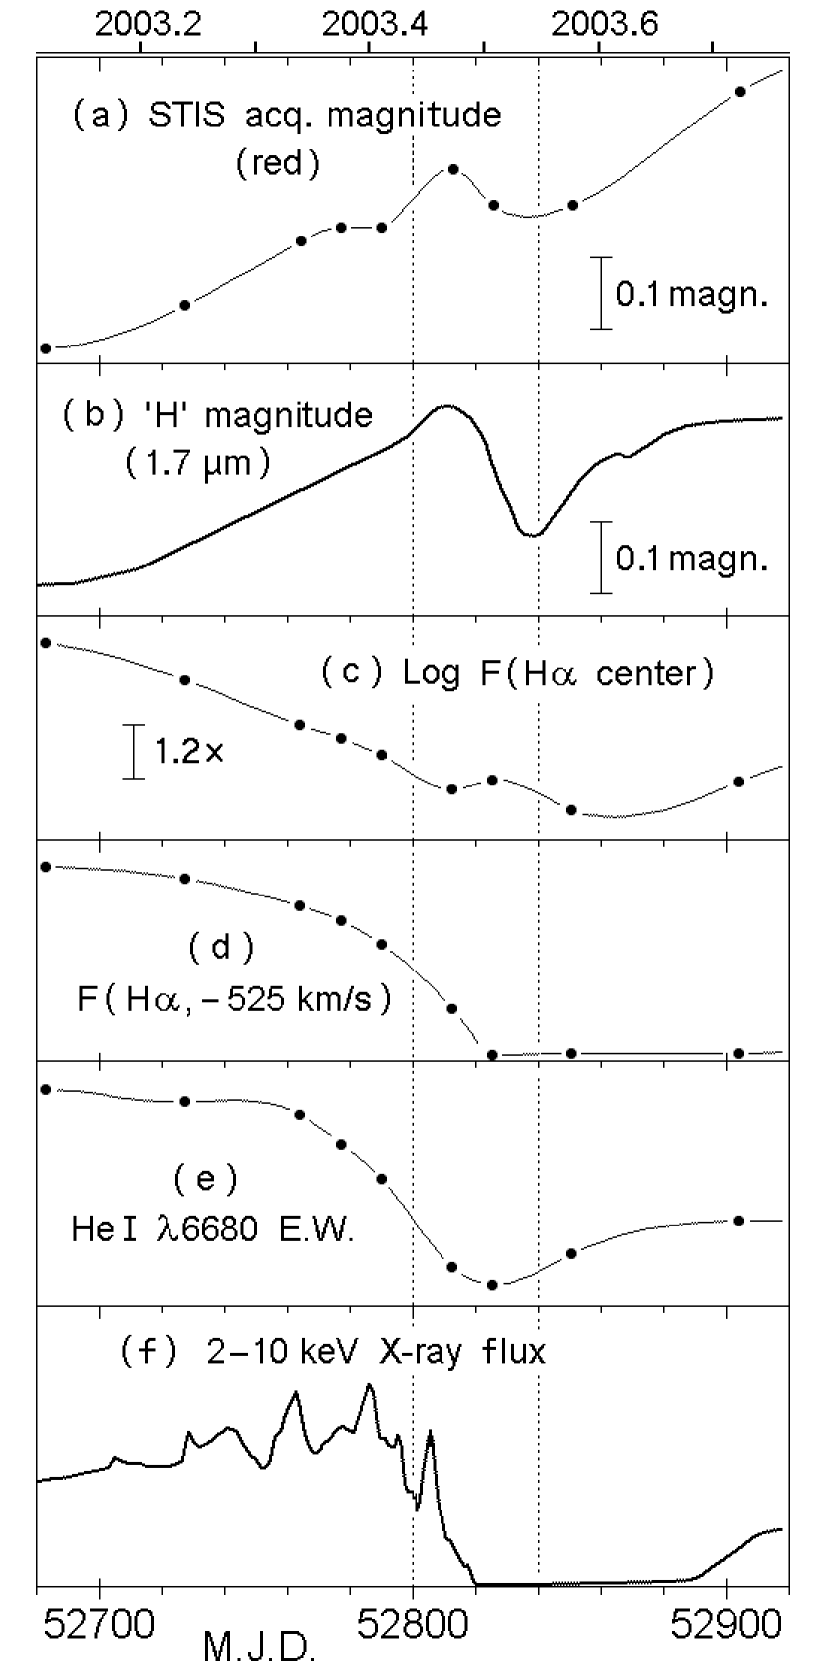
The hydrogen lines help to define accurately when the 2003 event occurred. Figure 4 shows the behavior of six observables representing Car’s wind; evidently the best time-markers for the event were the near-infrared flux333 If we use ground-based photometry for this purpose, then near-IR wavelengths seem better than visual wavelengths, being somewhat less dominated by light reflected in the Homunculus. (Fig. 4b), the H P Cyg absorption (Fig. 4d), and perhaps the He I 6680 flux (Fig. 4e). The X-ray flux also changed rapidly (Fig. 4f), but in an erratic manner that did not match the curve seen in late 1997 (Corcoran, 2004). The final deepening of the P Cyg feature occurred close to MJD = 52820, several days before the midpoint of the H-band photometric drop reported by Whitelock et al. (2004) – i.e., at the beginning of July 2003 with an uncertainty of only a few days. Unfortunately, it is not clear that comparable observations will be attempted during the next event in early 2009. The HST/STIS will not be available then, while, ironically, ground-based work is also becoming more difficult due to the shortage of appropriate small telescopes. On the other hand, if the central star continues to grow in brightness relative to the Homunculus Nebula, adequate visual-wavelength spectroscopy of it will become feasible with ground-based equipment.
Figures 3 and 4 suggest two characteristic time-scales for an event: 100–200 d for some parameters, and 5–20 d for the most rapid changes. The former might be the quadrature-to-periastron time for an eccentric binary orbit, or the star’s rotation period, or the thermal/dynamical timescale for growth of an instability in Car’s outer layers. The latter, shorter timescale seems a “natural” value for a disturbance in the wind: 500 km s-1 10 d 3 AU, which is the order-of-magnitude characteristic size for the inner wind and also for the periastron of an eccentric binary orbit with a 5.5-year period. The star’s dynamical timescale is also of the same order of magnitude.
We emphasize again that our main point is practically model-independent: The 1997-98 and 2003 events differed in respects which probably indicate a serious change in the stellar wind structure. The detailed line profiles will be valuable for constraining models, but that, in a sense, will be a second-order application of the data. The complex behavior of He I, Fe II, and other spectral features of the stellar wind observed with HST/STIS, as well as spectroscopy of ejecta at radii 0.1″, will be reported in a series of future papers. Finally, we caution that all observations and most comments in this paper refer only to our direct view of the star. Reflection in the Homunculus Nebula allows an indirect “polar” view of Car, with potentially different emission line profiles. A preliminary report on that view, employing the ground-based VLT/UVES instrument, will be given in a companion paper by Weis et al. (2005).
— — —
Acknowledgements
We are grateful to Beth Perriello at STScI for extensive assistance in planning the Treasury Project observations, and to Matt Gray and Michael Koppelman at the University of Minnesota for helping with non-routine steps in the data preparation and analysis. We thank an anonymous reviewer for drawing our attention to several points where the original version of this paper was insufficiently clear.
The HST Treasury Project for Eta Carinae is supported by NASA funding from STScI (programs GO-9420 and GO-9973), and in this paper we have employed HST data from several earlier GO and GTO programs. Treasury Project CoI’s who did not participate in this particular paper are S. Johansson, N. Walborn, M. Bautista, and H. Hartman.
References
-
Corcoran (2004)
Corcoran, M.F. 2004, priv. comm., and
http://lheawww.gsfc.nasa.gov/users/
corcoran/eta_car/etacar_rxte_lightcurve. - Damineli (1996) Damineli, A. 1996, ApJ, 460, L49
- Damineli et al. (1997) Damineli, A., Conti, P.S., & Lopes, D.F. 1997, New Astronomy, 2, 107
- Damineli et al. (1999) Damineli, A., Stahl, O., Wolf, B., & Kaufer, A. 1999, in Eta Carinae at the Millennium, ASP Conf. Ser. 179 (ed. J.A. Morse, R.M. Humphreys, & A. Damineli), p. 221
- Damineli et al. (2000) Damineli, A., Kaufer, A., Wolf, Bernhard, Stahl, O., Lopes, D.F., & de Araújo, F.X. 2000, ApJ, 528, L101
- Davidson (1987) Davidson, K. 1987, ApJ, 317, 760
- Davidson et al. (1995) Davidson, K., Ebbets, D., Weigelt, G., Humphreys, R.M., Hajian, A.R., Walborn, N.R., & Rosa, M. 1995, AJ, 109, 1784
- Davidson (1997) Davidson, K. 1997, New Astronomy, 2, 387
- Davidson & Humphreys (1997) Davidson, K., & Humphreys, R.M. 1997, ARA&A, 35, 1
- Davidson (1999) Davidson, K. 1999, in Eta Carinae at the Millennium, ASP Conf. Ser. 179 (ed. J.A. Morse, R.M. Humphreys, & A. Damineli), p. 304
- Davidson et al. (1999a) Davidson, K., Ishibashi, K., Gull, T.R., & Humphreys, R.M. 1999a, in Eta Carinae at the Millennium, ASP Conf. Ser. 179 (ed. J.A. Morse, R.M. Humphreys, & A. Damineli), p. 227
- Davidson et al. (1999b) Davidson, K., Gull, T.R., Humphreys, R.M., Ishibashi, K., Whitelock, P., Berdnikov, L., McGregor, P.J., Metcalfe, T., Polomski, E., & Hamuy, M. 1999b, AJ, 118, 1777
- Davidson (2000) Davidson, K. 2000, in Cosmic Explosions, AIP Conf. Proc. 522 (ed. S.S. Holt & W.W. Zhang), p. 421
- Davidson et al. (2000) Davidson, K., Ishibashi, K., Gull, T.R., Humphreys, R.M. & Smith, N. 2000, ApJ, 530, L107
- Davidson (2002) Davidson, K., in X-rays at Sharp Focus: Chandra Science Symposium, ASP Conf. Ser. 262 (ed. E.M. Schlegel & S.D. Vrtilek), p. 267
-
Davidson et al. (2002)
Davidson, K., Gull, T.R.,
Ishibashi, K., Hillier, J., Humphreys, R., & the Eta Car Team 2002,
STScI Newsletter, 19, no. 2 (Spring 2002), p. 1; available
at http://sco.stsci.edu/newsletter/PDF/
2002/spring_02.pdf. - de Vaucouleurs & Eggen (1952) de Vaucouleurs, G., & Eggen, O.J. 1952, PASP, 64, 185
- Feast et al. (2001) Feast, M., Whitelock, P., & Marang, F. 2001, MNRAS, 322, 741
- Gaviola (1953) Gaviola, E. 1953, ApJ, 118, 234
- Gull et al. (1999) Gull, T.R., Ishibashi, K., & Davidson, K. 1999, in Eta Carinae at the Millennium, ASP Conf. Ser. 179 (ed. J.A. Morse, R.M. Humphreys, & A. Damineli), p. 144
- Hillier et al. (2001) Hillier, D.J., Davidson, K., Ishibashi, K., Gull, T. 2001, ApJ, 553, 837
- Hofmann & Weigelt (1988) Hoffman, K.-H., & Weigelt, G. 1988, A&A, 203, L21
- Humphreys (2005a) Humphreys, R.M. 2005, in The Fate of the Most Massive Stars, ASP Conf. Ser. — (ed. R.M. Humphreys & K. Stanek), p. 14 (in press)
- Humphreys (2005b) Humphreys, R.M. 2005, in The Fate of the Most Massive Stars, ASP Conf. Ser. — (ed. R.M. Humphreys & K. Stanek), p. 110 (in press)
- Humphreys & Davidson (1994) Humphreys, R.M., & Davidson, K. 1999, PASP, 106, 1025
- Humphreys et al. (1999) Humphreys, R.M., and the HST-FOS Team 1999, in Eta Carinae at the Millennium, ASP Conf. Ser. 179 (ed. J.A. Morse, R.M. Humphreys, & A. Damineli), p. 107
- Humphreys, Davidson, & Smith (1999) Humphreys, R.M., Davidson, K., & Smith, N. 1999, PASP, 111, 1124
- Humphreys, Davidson, & Smith (2002) Humphreys, R.M., Davidson, K., & Smith, N. 2002, in Exotic Stars as Challenges to Evolution, ASP Conf. Ser. 279 (ed. C.A. Tout & W. Van Hamme), p. 79
- Ishibashi (2001) Ishibashi, K. 2001, in Eta Carinae & Other Mysterious Stars…, ASP Conf. Ser. 242 (ed. T. Gull, S. Johannson, & K. Davidson), p. 53
- Martin and Koppelman (2004) Martin, J., & Koppelman, M. 2004, AJ, 127, 2352
- Maeder (2005) Maeder, A. 2005, in The Fate of the Most Massive Stars, ASP Conf. Ser. — (ed. R.M. Humphreys & K. Stanek), p. 146 (in press)
- McGregor et al. (1999) McGregor, P.J., Rathbone, J.M., & Humphreys, R.M. 1999, in Eta Carinae at the Millennium, ASP Conf. Ser. 179 (ed. J.A. Morse, R.M. Humphreys, & A. Damineli), p. 236
- O’Connell (1956) O’Connell, D.J.K. 1956, Vistas in Astronomy, 2, 1165
- Pittard & Corcoran (2002) Pittard, J.M., & Corcoran, M.F., A&A, 383, 636
- Rivinius et al. (2001) Rivinius, T., Wolf, B., Stahl, O., & Kaufer, A., in Eta Carinae & Other Mysterious Stars, ASP Conf. Ser. 242 (ed. T. Gull, S. Johansson, & K. Davidson), p. 29
- Smith et al. (2003) Smith, N., Davidson, K., Gull, T.R., & Ishibashi, K. 2003, ApJ, 586, 432
- Weis et al. (2005) Weis, K., Stahl, O., Bomans, D.J., Davidson, K., Gull, T.R., & Humphreys, R.M. 2005, AJ, in press
- Sterken et al. (1999) Sterken, C., Freyhammer, L., Arentoft, T., & van Genderen, A.M. 1999, A&A, 346, L33
- van Boekel et al. (2003) van Boekel, R., Kervella, P., Schöller, M., Herbst, T., Brandner, W., de Koter, A., Waters, L.B.F.M., Hillier, D.J., Paresce, F., Lenzen, R., & Lagrange, A.-M. 2003, A&A, 410, L37
- van Genderen et al. (2003) van Genderen, A.M., Sterken, C., Allen, W.H., & Liller, W. 2003, A&A, 412, L25
- Weigelt & Ebersberger (1986) Weigelt, G., & Ebersberger, J. 1986, A&A, 163, L5
- Whitelock et al. (1994) Whitelock, P.A., Feast, M.W., Koen, C., Roberts, G., & Carter, B.S. 1994, MNRAS, 270, 364
- Whitelock et al. (2004) Whitelock, P.A., Feast, M.W., Marang, F., & Breedt, E. 2004, MNRAS, in press
- Zanella et al. (1984) Zanella, R., Wolf, B., & Stahl, O. 1984, A&A, 137, 79
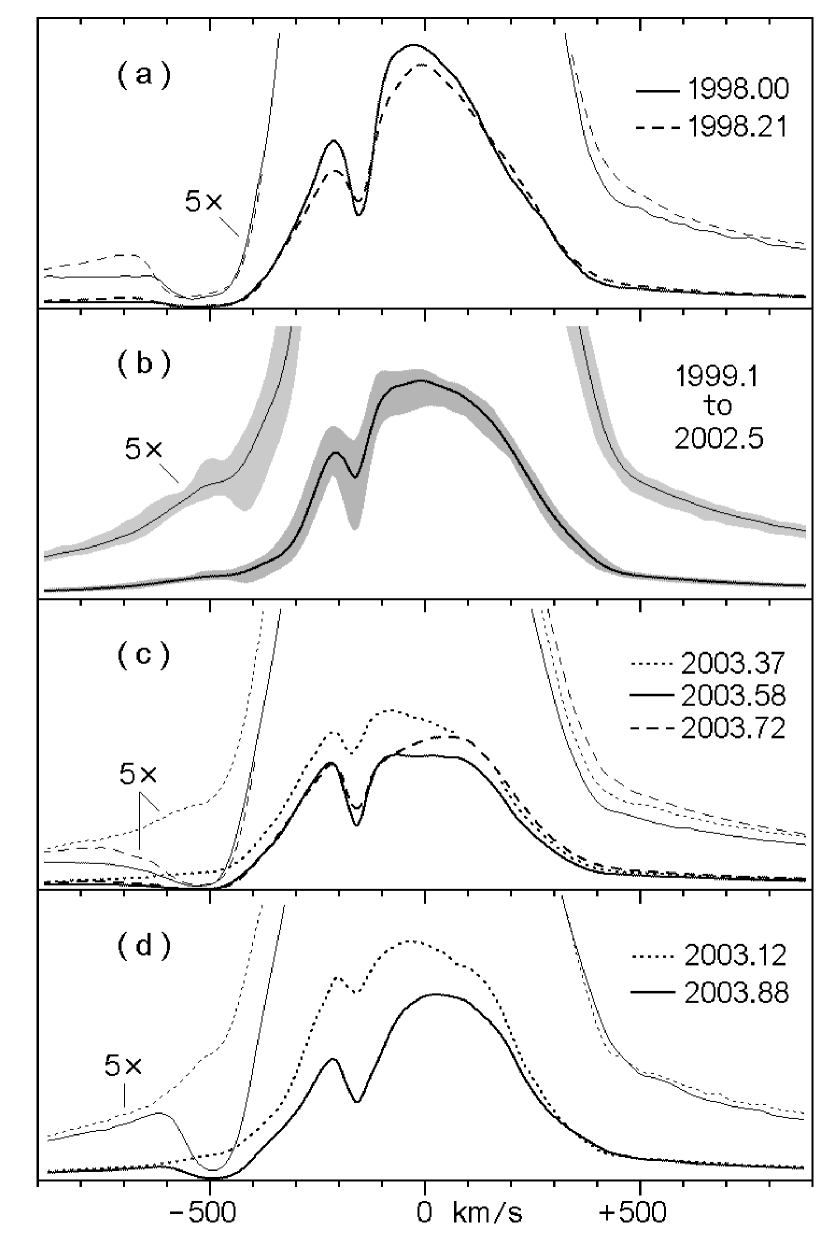
Profile of Car’s stellar-wind H emission line during 1998–2003. The bottom of each subfigure is at zero flux, while the top represents for the main curves or for lighter curves marked “”; we refer to the average continuum in the wavelength range 6740–6800 Å. Subfigure 1b shows the average and the envelope of six observations in 1999–2002, the less active portion of the 5.5-year spectroscopic cycle. As noted in the text, the prominent absorption near km s-1 occurs far outside the stellar wind. These curves have not been smoothed; the statistical noise level is relatively small.
Profiles of the Balmer (2–4), Balmer (2–9), and Paschen (3–10) emision lines near the 1998 and 2003.5 events. H and the Paschen lines were not observed with STIS at 1998.00, because insufficient HST time was available on that occasion. The top boundary represents a flux of in subfigure 2a and in 2b and 2c.
(a) Equivalent width of H emission and (b) average flux in the wavelength interval where H P Cyg absorption occurs, as functions of time. The time scale is systematically distorted in order to show the 1998 and 2003 events more clearly. Data points are connected by spline interpolations as an aid to viewing the progression; the important mid-1998 interval is, therefore, merely conjectural.
Observables of the stellar wind that can be used as time-markers for the 2003.5 spectroscopic event. (a) The red-wavelength brightness observed with the HST/STIS (Martin and Koppelman, 2004); (b) the near-IR, “free-free” continuum brightness (Whitelock et al., 2004); (c) flux at the H peak; (d) flux at the average wavelength of P Cyg absorption; (e) equivalent width of the He I 6680 emission line; (f) X-ray flux observed with the RXTE satellite (Corcoran, 2004). Subfigures (a) and (c)–(e) are based on our HST/STIS observations. (a)–(c) are logarithmic plots while (d)–(f) are linear with zero level at the bottom of each subfigure. Two light vertical lines mark convenient reference times, MJD 52800 and 52840.
| Calendar date | Year number | MJDbbModified Julian Day = (Julian Day Number) 2400000.5. | Phasecc Relative phase in the spectroscopic cycle, assuming = 2023 d = 5.54 y and arbitrarily adopting zeropoint = MJD 50800 1997.96. Some other authors have used nearly the same , which, however, does not represent any known physical reference point in the cycle. | Slit P.A. |
|---|---|---|---|---|
| 1998/01/01 | 1998.00 | 50814 | 0.007 | 260° |
| 1998/03/19 | 1998.21 | 50891 | 0.045 | 328° |
| 2003/02/12 | 2003.12 | 52683 | 0.931 | 303° |
| 2003/05/17 | 2003.37 | 52776 | 0.977 | 38° |
| 2003/07/05 | 2003.51 | 52825 | 1.001 | 69° |
| 2003/08/01 | 2003.58 | 52852 | 1.014 | 105° |
| 2003/09/22 | 2003.72 | 52904 | 1.040 | 153° |
| 2003/11/17 | 2003.88 | 52961 | 1.068 | 218° |
| Date | E.W. (Å)bbfootnotemark: | Instrument |
|---|---|---|
| 1991.62 | 194 | FOS |
| 1996.51 | 239 | FOS |
| 1997.10 | 197 | FOS |
| 1998.21 | 188 | STIS |
| 2002.05 | 211 | STIS |
| 2002.51 | 202 | STIS |
| 2003.37 | 163 | STIS |
| 2003.51 | 122 | STIS |
| 2003.58 | 114 | STIS |
| 2003.72 | 151 | STIS |
| 2003.88 | 176 | STIS |