Spin temperatures and covering factors for H i 21-cm absorption in damped Lyman- systems
Abstract
We investigate the practice of assigning high spin temperatures to damped Lyman- absorption systems (DLAs) not detected in H i 21-cm absorption. In particular, Kanekar & Chengalur (2003) have attributed the mix of 21-cm detections and non-detections in low redshift () DLAs to a mix of spin temperatures, while the non-detections at high redshift were attributed to high spin temperatures. Below , where some of the DLA host galaxy morphologies are known, we find that 21-cm absorption is normally detected towards large radio sources when the absorber is known to be associated with a large intermediate (spiral) galaxy. Furthermore, at these redshifts, only one of the six 21-cm non-detections has an optical identification and these DLAs tend to lie along the sight-lines to the largest background radio continuum sources. For these and many of the high redshift DLAs occulting large radio continua, we therefore expect covering factors of less than the assumed/estimated value of unity. This would have the effect of introducing a range of spin temperatures considerably narrower than the current range of K, while still supporting the hypothesis that the high redshift DLA sample comprises a larger proportion of compact galaxies than the low redshift sample.
keywords:
quasars: absorption lines – cosmology: observations – cosmology: early Universe – galaxies: ISM1 Introduction
Despite their relative paucity, the highest column density absorption systems, damped Lyman- systems (where ), are an important component of the high redshift () Universe since they account for most of the neutral gas available for star formation (e.g. Lanzetta et al., 1991). The H i 21-cm hyperfine transition can provide an alternative and complementary view of DLAs. Presuming that the 21-cm and Lyman- absorption arise in the same cloud complexes (Dickey & Lockman, 1990)111Where the 21-cm and Lyman- absorption trace the cold and total neutral hydrogen, respectively., the column density [] of the absorbing gas in a homogeneous cloud is related to the velocity integrated optical depth, where , of the 21-cm line via (Wolfe & Burbidge, 1975):
| (1) |
where [K] is the spin temperature, is the depth of the line (or r.m.s. noise in the case of a non-detection) and and the flux density and covering factor of the background continuum source, respectively.
As summarised by Wolfe (1980), 21-cm absorption line studies can face some difficulties compared with optical work: (1) in blind surveys the bandwidth of radio receiver/backend combinations only allows small redshift intervals to be searched for H i absorption; (2) terrestrial interference can be severe below 1.4 GHz; (3) if the spin temperature of the absorbing gas is high or if the background source size exceeds that of the absorption cloud(s), then the apparent optical depth can be considerably overestimated. Despite these technical difficulties, 21-cm studies of DLAs have provided information about the physical conditions of absorbers, including the kinematics, temperature and velocity distribution of the gas.
One unresolved question concerns the typical size and structure of DLAs, with models ranging from large, rapidly rotating proto-disks (e.g. Prochaska & Wolfe 1997) to small, merging sub-galactic systems (e.g. Haehnelt, Steinmetz & Rauch 1998). Direct imaging by various groups (e.g. Le Brun et al., 1997; Rao et al., 2003; Chen & Lanzetta, 2003) of the low- DLA host-galaxies reveals a mix of spirals, dwarf and low surface brightness (LSB) galaxies. This ‘mixed morphology’ picture of DLA host-galaxies appears to be reflected in the nearby Universe in a recent 21-cm emission study (Ryan-Weber, Webster & Staveley-Smith, 2003).
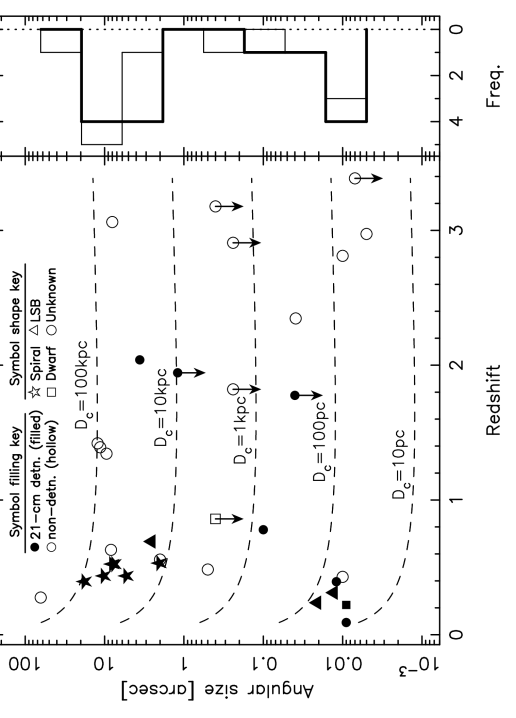
From a survey of 10 sources, in conjunction with the available literature, Kanekar & Chengalur (2003, hereafter KC03) find both detections and non-detections of 21-cm absorption in DLAs at , whereas the high- results are almost exclusively non-detections (Fig. 1, top).

Additionally, many of the DLAs have host-galaxy identifications from optical imaging, given in Table 1. By combining the 21-cm optical depth with the total H i column density from optical spectroscopy covering the damped Lyman- line, KC03 find low spin temperatures ( K), which are typical of the Milky Way and local spirals (Dickey & Lockman, 1990), in all cases where the absorber was identified as a spiral (Fig. 1). Furthermore, all DLAs at with temperatures K were found to be associated with dwarf or LSBs and KC03 interpreted the non-detections at high- () as DLAs with high . They therefore advocate a picture where the DLA host-galaxy population is dominated by the warmer dwarfs and LSBs at high- and evolves to include a higher proportion of spirals at low-, thus satisfying one expectation of hierarchical galaxy formation scenarios. However, in many of these studies, particularly at high redshift, the covering factor, , of the background continuum is often assumed to be unity (Fig. 1, bottom – see also Table 1.). Since plays an equal rôle as in relating the column density to the observed optical depth profile, it is important to consider the robustness of this assumption, which is the aim of this article.
2 Factors affecting the detection of 21-cm absorption
2.1 Previous 21-cm absorption searches
In Table 1 we summarise the previously published 21-cm searches to which we add the 3 non-detections detailed in Appendix A. The optical depths are quoted for various resolutions between 0.6 and 17 .
| QSO | ID | Ref. | |||||||||
| 0235+164 | 0.7/0.5 | 3B+1 | – | 1† | 100 | 21.7 | 0.52385 | S | 0.940 | 2 | |
| 0248+430 | 0.2/0.2/0.1/0.1 | 4 | – | 1∗ | – | – | 0.394 | U | 1.31 | 1.0 | 22 |
| 0458–020 | 0.3–3.1 | 2B | 25 | 1–0.28† | 21.7 | 2.03945 | U | 2.286 | 3 | 7 | |
| 0738+313 | 0.04 | 1 | 8 | 1† | 1100 | 20.8 | 0.2212 | D | 0.635 | 1.9 | 14 |
| … | 0.25 | 2 | 4 | 0.98† | 800 | 21.2 | 0.0912 | U | … | 2.2 | 19 |
| 0809+483a | 0.024 | 2B | 35 | – | – | 20.2 | 0.4369 | S | 0.871 | 19.0 | 5 |
| 0827+243 | 0.007 | 1 | 50 | 0.67† | 300 | 20.3 | 0.5247 | S | 0.939 | 0.9 | 20 |
| 0952+179 | 0.013 | 1 | 8 | 0.25† | 2000 | 21.3 | 0.2378 | L | 1.472 | 1.4 | 20 |
| 1127–145 | 0.06,0.09 | 4B+1 | 42 | 1,1† | 1000,910 | 21.7 | 0.3127 | L | 1.187 | 5.3,6.2 | 14,18 |
| 1157+014 | 0.05–0.2 | 1 | 42 | 0.25–1† | – | 21.8 | 1.94362 | L | 1.986 | 0.80 | 4 |
| 1229–021 | 0.05 | 2B | 5 | 0.43† | – | 20.8 | 0.39498 | S | 1.045 | 2.2 | 6,13 |
| 1243–072 | 0.07 | 1 | 14 | 1∗ | – | – | 0.4367 | S | 1.286 | 0.48 | 22 |
| 1328+307b | 0.11 | 1 | 8 | 0.2† | 100 | 21.3 | 0.692154 | S | 0.849 | 19.0 | 1 |
| 1331+170 | 0.02 | 1 | 22 | 1∗ | 980 | 21.2 | 1.77642 | U | 2.084 | 0.61 | 3 |
| 1413+135c | 0.3 | 1 | 18 | † | – | – | 0.24671 | S | 0.24671 | 1.25 | 8 |
| 1629+120 | 0.039 | 2B | 40 | 1† | 20–310 | 20.7 | 0.5318 | S | 1.795 | 2.35 | 23 |
| 2351+456 | 0.32 | 1 | 53 | – | – | – | 0.779452 | U | 1.9864 | 2.0 | 24 |
| 0118–272 | – | – | 0.5† | 20.3 | 0.5579 | U | 0.559 | 1.1 | 20 | ||
| 0201+113 | 0.09,0.04,d | 1 | 9,23,– | 1† | 21.3 | 3.386 | U | 3.610 | 0.35 | 11,12 | |
| 0215+015 | – | – | 1† | 19.9 | 1.3439 | U | 1.715 | 0.92 | 23 | ||
| 0335–122 | – | – | 20.8 | 3.178 | U | 3.442 | 0.68 | 23 | |||
| 0336–017 | – | – | 1∗ | 21.2 | 3.0619 | U | 3.197 | 0.94 | 23 | ||
| 0432–440 | – | – | – | – | – | 20.8 | 2.297 | U | 2.649 | – | 25 |
| 0438–436 | – | – | – | – | 20.8 | 2.347 | U | 2.852 | – | 25 | |
| 0439–433 | – | – | 1∗ | 20.0 | 0.10097 | U | 0.593 | 0.33 | 21 | ||
| 0454+039 | – | – | 0.28† | – | 20.7 | 0.8596 | D | 1.345 | 0.44 | 6 | |
| 0528–250 | – | – | 1∗ | 21.3 | 2.8112 | U | 2.779 | 0.14 | 10 | ||
| 0537–286 | – | – | 1† | 20.3 | 2.974 | U | 3.104 | 1.1 | 23 | ||
| 0906+430e | – | – | – | – | – | 0.63 | U | 0.670 | 6.14 | 17 | |
| 0957+561A | – | – | – | – | 20.3 | 1.391 | U | 1.413 | 0.59 | 23 | |
| 1225+317 | – | – | 0.11† | – | – | 1.821g | U | 2.219 | 0.35 | 6 | |
| 1228–113 | – | – | – | – | – | 20.6 | 2.193 | U | 3.528 | – | 25 |
| 1354–107 | – | – | 1∗ | 20.8 | 2.996 | U | 3.006 | 0.12 | 23 | ||
| 1354+258 | – | – | – | – | 21.5 | 1.4205 | U | 2.006 | 0.30 | 23 | |
| 1451–375 | – | – | 1∗ | 20.1 | 0.2761 | U | 0.314 | 3.8h | 18 | ||
| 2128–123 | – | – | 19.4 | 0.4298 | U | 0.501 | 1.9 | 23 | |||
| 2223–052i | – | – | 0.44j | 20.9 | 0.4842 | U | 1.4040 | 8.0h | 18 | ||
| 2342+342 | – | – | 1∗ | 21.3 | 2.9084 | U | 3.053 | 0.31 | 23 |
Notes: a3C196, b3C286, cincluded by KC03, but since no Lyman- absorption has been detected in this associated system we shall exclude it from our analysis, dalso, Briggs et al. (1997) detected 21-cm absorption with the WSRT but not the VLA; as with the current consensus (e.g. Wolfe, Gawiser & Prochaska 2003) we shall consider this a non-detection, e3C216 (although not detected in the Lyman- line nor Mg ii 2796/2803 Å doublet, the UV spectrum of Wills et al. (1995) suggests a possible DLA), fthese upper limits are not quoted in KC03 since the low core radio fluxes reduce the optical depth sensitivity as well as implying a low covering factor in both cases, gobserved at , hflux density estimated from neighbouring frequencies (see http://www.phys.unsw.edu.au/sjc/dla/), i3C446, jalthough is quoted by KC03 we find this to be 0.44 from Chengalur & Kanekar (2000).
References: (1) Brown & Roberts (1973), (2) Roberts et al. (1976), (3) Wolfe & Davis (1979), (4) Wolfe et al. (1981), (5) Brown & Mitchell (1983), (6) Briggs & Wolfe (1983), (7) Wolfe et al. (1985), (8) Carilli et al. (1992), (9) Lanzetta et al. (1995), (10) Carilli et al. (1996), (11) de Bruyn et al. (1996), (12) Kanekar & Chengalur (1997), (13) Briggs (1999), (14) Lane et al. (1998), (15) Rao & Turnshek (1998), (16) Chengalur & Kanekar (1999), (17) Pihlström et al. (1999), (18) Chengalur & Kanekar (2000), (19) Lane et al. 2000, (20) Kanekar & Chengalur (2001), (21) Kanekar et al. (2001), (22) Lane & Briggs (2001), (23) KC03, (24) Darling et al. (2004), (25) This paper (see Appendix A).
As discussed in detail by Curran et al. (2002a), the choice of resolution affects the upper limit to the optical depth obtained and so we normalise these to 3 , a fairly typical resolution for the DLAs detected in 21-cm absorption. In the table we also give the covering factors used to determine the spin temperature in each of the previous searches. Where no high resolution radio images are available for both the background source and absorber, it is common practice to assume that the absorber completely covers the continuum source (e.g. Lane & Briggs 2001), although in some cases the covering factor is estimated as the ratio of the compact unresolved component’s flux to the total radio flux (e.g. Briggs & Wolfe 1983). A good example of this method is given by Lane et al. (2000), where the constancy of the 21-cm absorption profile in the DLA over the partially resolved core of 0738+313 gives an estimate of . As Briggs & Wolfe (1983) mention, however, even though this method provides information on the background source structure, it provides none on the size of the absorbing region222The effect of background source size is clearly demonstrated, for instance, in absorption studies of PSR B1849+00 (Stanimirovic et al., 2003).. The only way to unambiguously determine the covering factor is by mapping both the source and the absorbing gas at high angular resolution, which is challenging due to the very high sensitivities required.
2.2 Column density and background flux biases
In order to check that the non-detection of 21-cm absorption in DLAs is not the result of lower atomic hydrogen column densities, we plot

the velocity integrated optical depth against column density in Fig. 2. We use this rather than the peak optical depth as this provides a better representation of the strength of the line. For a single cloud in thermodynamic equilibrium, the spin temperature of the gas can be estimated from the kinetic temperature according to (e.g. Lane & Briggs 2001) and this has been used by KC03 in order to derive spin temperatures and line-widths which are self consistent. However, in the absence of detailed knowledge of the covering factor, it is impossible to assign a specific spin temperature to the system. We therefore assume a FWHM of 20 (the mean value of the detections) for the non-detections (Table 1). From the table see that the FWHM can range from 4 to 50 , each of which would not cause too large a deviation from our chosen value of 20 on the log plots. This is confirmed by the fact that using the peak rather than velocity integrated optical depths gives similar qualitative results in Figs. 2 and 3.
Although the column densities for the non-detections are generally lower, they appear to have been searched to correspondingly lower optical depth limits. To check this, in Fig. 3

we show the distribution of the velocity integrated optical depth modified according to the column density of each DLA: In the optically thin regime () equation 1 reduces to333As seen from Table 1, this is a reasonable assumption providing that is not small. For the assumption is not valid, although it supports the argument that .
| (2) |
and from Table 1 we see that this is applicable () to all but two systems, 0235+164 and 0458–020. With this approximation we can introduce a linear correction to the optical depth in order to account for the range of column densities exhibited by the DLA sample. Here we correct the optical depth by a factor of , where is nominally defined as the limiting column density of a DLA. This has the effect of putting the data points on an equal footing on the ordinate, i.e. for a given optical depth limit we account for the fact that a non-detected system of low column density has not been searched for as deeply as one of higher column density. From Fig. 3 we see, not surprisingly, that detections tend to occur towards higher flux densities, although the samples are not mutually exclusive. For the modified peak optical depths the overlap is more pronounced than in Fig. 3, and for both samples . Equation 2 therefore suggests similar values of (over a 2 order of magnitude range) for the detections and non-detections. We discuss the possible contributions of and in the following section.
2.3 Spin temperatures and covering factors
From Section 2.2 it appears that neither the column density nor background flux (providing they are sufficiently high) are the main factors in determining whether a DLA is detected in 21-cm absorption. As previously discussed, the popular consensus is the wide range of estimated spin temperatures (possibly K) in DLAs. In view that the equally influential covering factor is often assumed to be unity, we note the following:
- 1.
-
2.
The presence of H2 in 0528–020 (Levshakov & Varshalovich, 1985) suggests that the gas is relatively cold with K (Srianand & Petitjean 1998), cf. K from a 21-cm non-detection (Carilli et al. 1996). This of course could be the result of different sight-lines being probed as well as the possibility the absorption is not due to a single cloud. This is known to be a complex situation with (Table 1), suggesting an infalling system rather than a simple intervener, although it is one of the cases where a covering factor of unity is assumed. This is a valid assumption, however, if the absorbing material has an extent of pc.444From the radio continuum size of (see Table 2) at ( km s-1 Mpc-1, ).
Note that a similar situation is found towards 0738+313, where K, cf. K in both absorbers (Lane et al., 2000; Kanekar et al., 2001). As seen from the absorption profiles towards the 1.3 GHz VLBA image (figure 2 of Lane et al. 2000), although overall is large, the coverage towards the north appears to be considerably less than towards the south-east. This suggests that the absorber extends to pc and pc in these respective directions. A lower coverage in the northerly direction could possibly reduce the spin temperature estimates to closer to the kinetic temperature values, although the two-phase gas model suggested by Lane et al. (2000) offers an alternate explanation. In this model, the deep, narrow absorption lines give the temperature of the cold gas, and the much wider weaker line giving the warm gas temperature. These models are discussed further at the end of this section.
-
3.
For the DLAs in which 21-cm absorption has been detected there appears to be little correlation between spin temperature and line-width. However, these are complex, multi-component systems characterised by a single velocity integrated optical depth and considering the possibility of both narrow/cold and wide/warm components in the profile (above), the lack of correlation is not surprising. Such simplification does however demonstrate the possible pitfalls in estimating line-widths for the non-detections (Section 2.2).
All 21-cm absorption detections occur in lower redshift () DLAs (see Fig. 4) and KC03 attribute this
to these having a mix of both low and high spin temperatures (Fig. 1, top), while the higher redshift DLAs generally have high spin temperatures. This may imply that the more distant DLA sample consists of a particular class of object. However, due to their large distances, none of the high redshift 21-cm sample have hosts which have been optically identified and indeed only one of the non-detections has an optical identification (Fig. 1, bottom). Therefore, we have insufficient information with which to determine the DLA host morphology and thus the likely covering factor. From this and the above points, we cannot rule out that perhaps the inferred (high) spin temperatures are an artifact of an overestimate of the covering factor.
One way to address this issue is to estimate how the expected size of the intervening absorber compares to that of the background continuum: In Table 2 we show the results from high resolution radio images for the sources searched555Note that the continuum source sizes estimated by KC03 from the spectral energy distributions (SEDs) agree qualitatively with the results in the table. Specifically, the flat SEDs for 0215+015, 0335–122 & 2342+342 suggest compact sources. For the remainder of their sources they use the ratio of the unresolved component’s flux (Section 2.1) to estimate the covering factor and, in order to avoid erroneous spin temperature estimates, exclude from further analysis the two sources (0957+561 & 1354+258) where this is expected to be low.
| QSO | Ref | VLBI | Ref | VLA | Ref | Comments [Ref] | |
| 0235+164 | 7.5 | 16 | CJ | 25 | T | 16 | VLBI (5 GHz)/VLA (2 GHz) triple + extra strong component |
| 0248+430 | 0.012 | 22 | T | 22 | U | 1 | VLBI (1.6 GHz) weak core + 2 strong lobes or a CJ structure, |
| outer J stronger than inner/VLA (5 GHz) | |||||||
| 0458–020 | 3.6 | 38 | CJ | 30 | CDom | 38 | VLBI (5 GHz)/VLA (5 GHz) core + weaker lobes |
| (2 component, 1.4 GHz VLA [11]) | |||||||
| 0738+313 | 0.009 | 29 | CJ/T | 29 | T | 16 | VLBI (5 GHz)/VLA (1.6 GHz) triple, FRI like (core strongest) |
| 0809+483 | 5.27 | 3 | – | – | D | 3 | VLA (5 GHz) FRII like (strong lobes), as MERLIN 408 MHz [23] |
| 0827+243 | 8.00 | 17 | CJ | 39 | D | 17 | VLBA (2 & 8 GHz)/VLA (1.4 GHz) FRII like |
| 0952+179 | 0.021 | 39 | T | 39 | – | – | VLBA (2 & 8 GHz) either CJ or C-J-CJ (one side stronger) |
| 1127–145 | 0.013 | 24 | CJ | 24 | U | 1 | VLBI/VLA (1.4 & 5 GHz) |
| 1157+014 | 6 | – | – | U | 6 | VLA (5 GHz) | |
| 1229–021 | 17.76 | 4 | – | – | T | 4 | VLA standard triple, C + 2 weaker lobes |
| 1243–072 | 10.17 | 5 | CJ | 39 | T | 5 | VLBA (2 & 8 GHz)/VLA standard triple, core is dominant |
| 1328+307 | 2.57 | 14 | CJ | 39 | CDom | 14 | VLBA (2 & 8 GHz)/VLA (1.5 GHz) strong core + weaker component |
| 1331+170 | 9,31 | CJ | 41 | U | 9 | VLBA (2 & 8 GHz)/VLA (5GHz) | |
| 1413+135∗ | 0.040 | 20 | CJ | 20 | U | 1 | VLBI CJ + 2 more extended components on each side, core stronger |
| VLA (5 GHz) | |||||||
| 1629+120 | 2.025 | 15 | D | 32 | T | 15 | VLBI (2 GHz) EVN/VLA 3 strong components, possibly FRII |
| 2351+456 | 0.03 | 22 | CJ | 22 | U | 1 | VLBI (1.7 GHz) strong 20–30 mas core + one weaker 100 mas jet |
| 0118–272 | 2.0 | 1 | T/mul | 34 | T/mul | 2 | VLBI (5 GHz) core + extended |
| VLA (5 GHz) at least 3 components, complex | |||||||
| 0201+113 | 32 | C | 32 | CDom | 12 | Core + weak extended (1% of total 21-cm flux within [12]) | |
| 0215+015 | 9.45 | 7 | C | 27 | T | 7 | VLBA (2 & 8 GHz)/ VLA (5 GHz) FRI, core dominated |
| 0335–122 | 11 | C | 41 | U | 11 | VLBI (2 GHz)/VLA (1.4 GHz) | |
| 0336–017 | 8.0 | 37 | CJ | 18 | T | 37 | VLBI (5 GHz) unresolved/VLA (5 GHz) FRI, core dominated |
| 0432–440∗ | – | – | – | – | – | – | – |
| 0438–436 | 0.039 | 35 | D | 35 | U | 1 | VLBI (5 GHz)/VLA (1 & 5 GHz) |
| 0439–433 | – | – | – | – | – | – | – |
| 0454+039 | 11 | CJ | 41 | U | 11 | VLBA (2 & 8 GHz)/VLA (1 & 5 GHz) | |
| 0528–250 | 0.010 | 40 | C | 40 | U | 1 | VLBI (5 GHz)/VLA (1 & 5 GHz) |
| 0537–286 | 0.005 | 40 | CJ | 40 | – | – | VLBA (2 & 8 GHz) |
| 0906+430 | 8.3 | 14 | CJ | 22 | T | 14 | VLBI (1.6 GHz) core strongest/VLA (1.4 GHz) core strongest |
| 0957+561 | 11.36 | 28 | CJ | 21 | T? | 28 | VLBI (5 GHz)/VLA (5 GHz) lensed, looks like CLL core strongest |
| 1225+317 | 8 | C | 41 | U | 8 | VLA (2 GHz) possibly CJ/VLA (5 GHz) | |
| 1228–113∗ | 0.01 | 41 | CJ | 41 | – | – | VLBA (2 & 8 GHz)/VLA: no map, |
| may have flux on larger than VLBI scales | |||||||
| 1354–107 | – | – | – | – | – | – | – |
| 1354+258 | 12.24 | 15 | – | – | T | 15 | VLA (5 GHz) FRI like, core dominates |
| 1451–375 | 63.79 | 33 | CJ | 39 | T | 33 | VLBA (5 GHz)/VLA (1.4 GHz) FRI like, core dominates |
| 2128–123 | 0.010 | 26 | CJ | 26 | U | 1 | VLBA (2 & 8 GHz)/VLA (1 & 5 GHz) |
| 2223–052 | 0.5 | 13 | CJ | 40 | U | 4 | VLBA (2 & 8 GHz)/VLA (1.4 GHz) |
| 2342+342 | 36 | – | – | U | 36 | VLA (8 GHz) |
Key VLBI morphology: CJ–core-jet morphology (most flux in core), D–double (2 lobes, no core visible), C–core, T–triple (core plus two lobes), mul = multiple components (). N.B. it is not always possible to determine the core in the VLBI images.
Key VLA morphology: U–unresolved, T–triple, usually the morphology is either FRI like (most flux in core) or FRII like (most flux in lobes), D–double, usually FRII like (core may be too faint), CDom–core dominated, usually a very strong core plus some fainter emission (some may look like very weak lobes). ∗Note that these are included in order to provide a comprehensive list but not included in the analysis (Fig. 4) – 1413+135 is an associated system and the limits for 0432–440 and 1228–113 are poor (Appendix A)
References: (1) Ulvestad et al. (1981), (2) Perley (1982), (3) Schilizzi et al. (1982), (4) Hintzen et al. (1983), (5) Gower & Hutchings (1984), (6) Stocke et al. (1984), (7) Antonucci & Ulvestad (1985), (8) Rogora et al. (1987), (9) Barthel et al. (1988), (10) Briggs et al. (1989), (11) Neff & Hutchings (1990), (12) Stanghellini et al. (1990), (13) Fejes et al. (1992), (14) van Breugel et al. (1992), (15) Lonsdale et al. (1993), (16) Murphy et al. (1993), (17) Price et al. (1993), (18) Gurvits et al. (1994), (19) Lister et al. (1994), (20) Perlman et al. (1994), (21) Campbell et al. (1995), (22) Polatidis et al. (1995), (23) Reid et al. (1995), (24) Bondi et al. (1996), (25) Chu et al. (1996), (26) Fey et al. (1996), (27) Fey & Charlot (1997), (28) Harvanek et al. (1997), (29) Stanghellini et al. (1997), (30) Shen et al. (1997), (31) Browne et al. (1998), (32) Dallacasa et al. (1998), (33) Saikia et al. (1998), (34) Shen et al. (1998), (35) Tingay et al. (1998), (36) Wilkinson et al. (1998), (37) Reid et al. (1999), (38) Barthel et al. (2000), (39) Fey & Charlot (2000), (40) Fomalont et al. (2000), (41) Beasley et al. (2002).
and in Fig. 4 we show the radio source size/absorption redshift distribution compared with various absorber sizes, Dc. Although we are uncertain which of these apply to a “typical” DLA (e.g. Briggs et al. 1989; Churchill & Charlton 1999; Chengalur & Kanekar 2002), the bimodal distribution of the continuum source sizes (particularly for the detections) itself may be indicative of a strong covering factor influence: Using the absorber host optical identifications for this sample we see a clear correlation between galaxy type and radio source size, where the spirals trace the upper segment () of the distribution and the compact galaxies appear to be associated with the smaller radio sources (). The fact that absorption is detected only towards the extended continuum sources when occulted by a large galaxy strongly suggests that the covering factor is a key issue. Toward the smaller continuum sources we would also expect spirals (together with compact galaxies) since the covering factor would also be large. This is not observed. KC03 do note that some of the identifications may be uncertain but, consulting the literature (e.g. Rao et al. 2003), we find similar identifications, although the morphology of the DLA towards 0738+313 is unclear (Cohen, 2001) (this has therefore been flagged as unknown in Figs. 1, 4 and 5). The lower segment of the low redshift bimodal distribution therefore consists of 3 dwarf/LSBs and 3 unknowns666Excluding the unknown at & (2351+456). The continuum size applies to the total extent, although the strong core flux originates within (Polatidis et al., 1995) placing this closer to the other sources in this segment.. That is, in this group there are as many compact as there are unidentified morphologies, though the latter could well turn out to be larger galaxies. Regarding the bimodal distribution, the binary probability of finding 6 out of 6 spiral galaxies towards sources of angular extent and 3 (or more) out of 4 non-spirals at is just 0.5 per cent. Thus, it would seem there is some evidence to suggest a non-negligible covering factor effect in the current sample.
Furthermore, as mentioned above, all but one of the non-detections at low redshift have yet to be identified optically, which excludes us from estimating a probable coverage, as done for the majority of the detections. However, in Fig. 4 we note that the low redshift DLAs not detected in 21-cm tend to occult the largest background sources. In fact 6 of these are located in the upper segment of the bimodal distribution, compared to only one in the lower segment777If applying the cut-off this becomes 7 versus 3.. This strongly suggests that the low redshift non-detections may be mainly due to inadequate coverage.
However, we emphasise one possible caveat to the above argument. Several of the larger () background sources have complex morphologies, and in fact for 6 of the non-detections (0215+015, 0336–017, 0906+430, 0957+561, 1354+258 & 1451–375) these may be core dominated (Table 2). The fact that there is no information on the core flux at the redshifted 21-cm frequency888These should, however, still provide a reasonable measure of the lower frequency source size (e.g. Fejes et al. 1992). nor on the extent of the absorbing gas means that we cannot unambiguously attribute the non-detections purely to low covering factors, although the smallest continuum source size is at GHz.
One way to estimate the extent of the absorber required to fully cover the source is via the Compton limit of the emitting region, which places a lower limit on the size of the emitting region according to the upper limit of 1012 K for the brightness temperature (e.g. Rantakyrö et al. 2003). Wolfe, Gawiser & Prochaska (2003) apply this to 0201+113, where mas (Table 2), to obtain a minimum extent of 4.9 mas (or 35 pc at for km s-1 Mpc-1, and ). Applying this to the rest of the 21-cm sample gives 0.7–16 mas (or 1–130 pc at ), all of which are small in comparison to . The results of Wolfe, Gawiser & Prochaska (2003) are interesting, however, since the extent of 0201+113 set by the Compton limit is very close to that set by the radio observations at 1.6 GHz ( mas2, Hodges et al. 1984; Stanghellini et al. 1990). From studies of the bolometric background radiation in DLAs, Wolfe, Prochaska & Gawiser (2003) find that these absorbers consist mainly of the cold neutral medium (CNM, where K and ) rather than the warm neutral medium (WNM, K and ). This supports our argument for lower covering factors and hence lower spin temperatures in DLAs, although based on the high covering factor towards 0738+313 (Section 2.1), Lane et al. (2000); Kanekar et al. (2001) suggest a two phase gas model dominated by the WNM () in both absorbers. This is consistent with the WNM+CNM mix in nearby dwarfs (Young et al., 2001, 2003), where such low metallicity systems are expected to reflect conditions in the early Universe, with the values of [O/H] to solar (e.g. Lipovetsky et al. 1999; Lee et al. 2002) spanning the range of typical DLA metallicities up to (Prochaska et al., 2003; Curran et al., 2004). However, even with the warm gas contribution, the mean harmonic mean spin temperatures of K towards 0738+313 still lie in the “cool DLA”, low redshift regime (Figs. 1 & 5, below).
In 0201+113 Wolfe, Gawiser & Prochaska (2003) find the CNM density to be and, by assuming that the total H i column density comprises several CNM (21-cm absorbing) clouds of column densities , they obtain an estimate of pc for each CNM cloud. While this argument has the draw-back that the total H i column density in the CNM phase must be estimated, it leads to a range of possibilities for 0201+113, the two extremes of which are:
-
1.
The 10 pc 21-cm absorbing clouds are aligned with the line-of-sight towards the pc (at ) background continuum, so that the coverage is low but the total column density is high.
-
2.
The clouds are distributed with little overlap, giving high coverage but a low effective column density.
Having and could account for the 21-cm non-detections, while permitting a large fraction of CNM gas (Wolfe, Gawiser & Prochaska 2003). This emphasises how equation 1 can at best only provide a column density weighted mean harmonic spin temperature from a complex of clouds of various column densities, velocity dispersions and covering factors.
3 Conclusions
Upon a review of the literature, we suggest that less-than-complete covering factors may be at least partly responsible for the non-detection of 21-cm absorption in many DLAs. Although it is as important as the spin temperature in determining the column density of the absorber, the covering factor is at best estimated from insufficient data, and, more often than not, simply assumed to be unity. This assumption is prevalent in the high redshift cases, where high spin temperatures are claimed to be dominant, despite their being no DLA host identifications at .
Although all detections of 21-cm absorption occur at , nearly half of those searched at these redshifts remain undetected, thus giving an apparent mix of both low and high spin temperatures for this sample. However, of these non-detections, per cent of the absorbers occult large background radio sources (), thus increasing the likelihood of . Furthermore, 21-cm absorption tends to be detected:
-
1.
Towards large background sources () only when the DLA is known to be associated with a large galaxy.
-
2.
Towards compact sources () when the DLA is associated with an LSB or dwarf galaxy.
Naturally, we would also expect detections where the absorber is associated with a large spiral occulting a compact background continuum, thereby providing large coverage. However, this is not observed. Of the 6 detections towards small background sources, 3 of the hosts are unidentified, thus not ruling out the possibility of an approximately equal mix of large and compact DLA hosts.
From the observed bolometric background, Wolfe, Gawiser & Prochaska (2003) propose that the 21-cm absorbing CNM is a major component of DLAs. They suggest that this is comprised of several lower column density clouds which may exhibit a large total column density but low covering factor when aligned along the line-of-sight or, conversely, low individual cloud column densities and a large covering factor, where overlap along the line-of-sight is minimal. Therefore, when attributing the non-detection of 21-cm absorption in DLAs to the effects of the covering factor (or spin temperature), we should bear in mind that the total H i column density may not provide a reliable estimate of the column density of the CNM along the line-of-sight to the background continuum. Further complications arise from the fact that insufficient detail is known about the flux contributions from the various components of the background continuum illuminating the DLA. The high resolution maps are at different frequencies than that of redshifted 21-cm and, if the components are extended, spectral indices may vary across them, making estimates of the effective continuum size at the appropriate frequency difficult. It is clear that high resolution observations at the appropriate frequencies are required in order to fully address this issue. Combining these with the absorption profiles at various locations over the background continuum (as in Lane et al. 2000) will give far better estimates of the covering factor.
Despite the above caveats, our analysis suggests that the covering factor may play an important rôle, thereby significantly lowering the spin temperature estimates of the DLAs for which the covering factors have been assumed (i.e. most of the non-detections) and perhaps it would be more prudent to use versus absorption redshift (Fig. 5) rather than just , for an

unknown value of . The figure does in fact show that the values of span similar ranges for both the detections and non-detections with the spirals (stars) being more concentrated towards the low (and ) regime999Note however that the spread along the ordinate is considerably wider than in Fig. 1 (top): Over 1.2 dex in cf. 0.3 in . Arguably this is mainly influenced by 1229–021 at [0.39, 3.32] but also applies when we, as KC03, include the associated system 1413+135 at [0.25, 3.28]. (although, as stated previously, the majority of host identifications are unknown). This is apparently consistent with the interpretation of low spin temperatures in these objects (KC03), but also with high coverage by spirals, a possibility strongly suggested by the work presented here.
The lowering of covering factor estimates would introduce more uniformity to the spin temperatures of DLAs, while still supporting the hypothesis that large galaxies dominate the low redshift population (Baker et al., 2000) with dwarf galaxies constituting more of the high redshift population (Lanfranchi & Friaça, 2003). That is, unlike KC03 who suggest that this is evident through increased spin temperatures at high redshift, we hypothesize that the absorption cross-sections of compact galaxies at these redshifts simply lack the extent to effectively cover the background radio continua.
Acknowledgments
We wish to thank the referee, Wendy Lane, whose helpful comments improved the manuscript. Also, Matthew Whiting, Chris Blake, Rob Beswick, Nissim Kanekar, Fredrik Rantakyrö, Sara Ellison and Panayiotis Tzanavaris for their helpful input and comments. We also wish to thank the John Templeton Foundation for supporting this work. SJC gratefully acknowledges receipt of a UNSW NS Global Fellowship and MTM is grateful to PPARC for support at the IoA under the observational rolling grant. This research has made use of the NASA/IPAC Extragalactic Database (NED) which is operated by the Jet Propulsion Laboratory, California Institute of Technology, under contract with the National Aeronautics and Space Administration.
References
- Antonucci & Ulvestad (1985) Antonucci R. R. J., Ulvestad J. S., 1985, ApJ, 294, 158
- Baker et al. (2000) Baker A. C., Mathlin G. P., Churches D. K., Edmunds M. G., 2000, in Favata F., Kaas A., Wilson A., eds, Star Formation from the Small to the Large Scale, Vol.45 of ESA SP The Chemical Evolution of the Universe. Noordwijk, p. 21
- Barthel et al. (1988) Barthel P. D., Miley G. K., Schilizzi R. T., Lonsdale C. J., 1988, A&AS, 73, 515
- Barthel et al. (2000) Barthel P. D., Vestergaard M., Lonsdale C. J., 2000, A&A, 354, 7
- Beasley et al. (2002) Beasley A. J., Gordon D., Peck A. B., Petrov L., MacMillan D. S., Fomalont E. B., Ma C., 2002, ApJS, 141, 13
- Bondi et al. (1996) Bondi M., et al., 1996, A&A, 308, 415
- Briggs (1999) Briggs F. H., 1999, in Carilli C., Radford S., Menton K., Langston G., eds, Highly Redshifted Radio Lines Redshifted 21cm Line Absorption by Intervening Galaxies. ASP Conf. Ser., p. 16
- Briggs et al. (1997) Briggs F. H., Brinks E., Wolfe A. M., 1997, AJ, 113, 467
- Briggs & Wolfe (1983) Briggs F. H., Wolfe A. M., 1983, ApJ, 268, 76
- Briggs et al. (1989) Briggs F. H., Wolfe A. M., Liszt H. S., Davis M. M., Turner K. L., 1989, ApJ, 341, 650
- Brown & Mitchell (1983) Brown R. L., Mitchell K. J., 1983, ApJ, 264, 87
- Brown & Roberts (1973) Brown R. L., Roberts M. S., 1973, ApJ, 184, L7
- Browne et al. (1998) Browne I. W. A., Wilkinson P. N., Patnaik A. R., Wrobel J. M., 1998, MNRAS, 293, 257
- Campbell et al. (1995) Campbell R. M., Lehar J., Corey B. E., Shapiro I. I., Falco E. E., 1995, AJ, 110, 2566
- Carilli et al. (1996) Carilli C. L., Lane W., de Bruyn A. G., Braun R., Miley G. K., 1996, AJ, 111, 1830
- Carilli et al. (1992) Carilli C. L., Perlman E. S., Stocke J. T., 1992, ApJ, 400, L13
- Chen & Lanzetta (2003) Chen H.-W., Lanzetta K. M., 2003, ApJ, 597, 706
- Chengalur & Kanekar (1999) Chengalur J. N., Kanekar N., 1999, MNRAS, 302, L29
- Chengalur & Kanekar (2000) Chengalur J. N., Kanekar N., 2000, MNRAS, 318, 303
- Chengalur & Kanekar (2002) Chengalur J. N., Kanekar N., 2002, A&A, 388, 383
- Chu et al. (1996) Chu L. B., Bååth F. T., Rantakyrö F. J., Zhang H. S., Nicholson G., 1996, A&A, 307, 15
- Churchill & Charlton (1999) Churchill C. W., Charlton J. C., 1999, AJ, 118, 59
- Cohen (2001) Cohen J. G., 2001, AJ, 121, 1275
- Curran et al. (2002) Curran S. J., Murphy M. T., Webb J. K., Rantakyrö F., Johansson L. E. B., Nikolić S., 2002a, A&A, 394, 763
- Curran et al. (2002) Curran S. J., Webb J. K., Murphy M. T., Bandiera R., Corbelli E., Flambaum V. V., 2002b, PASA, 19, 455
- Curran et al. (2004) Curran S. J., Webb J. K., Murphy M. T., Carswell R. F., 2004, MNRAS, 351, L24
- Dallacasa et al. (1998) Dallacasa D., Bondi M., Alef W., Mantovani F., 1998, A&AS, 129, 219
- Darling et al. (2004) Darling J., Giovanelli R., Haynes M. P., Bower G. C., Bolatto A. D., 2004, ApJ, 613, L101
- de Bruyn et al. (1996) de Bruyn A. G., O’Dea C. P., Baum S. A., 1996, A&A, 305, 450
- Dickey & Lockman (1990) Dickey J. M., Lockman F. J., 1990, ARA&A, 28, 215
- Ellison et al. (2001) Ellison S. L., Yan L., Hook I. M., Pettini M., Wall J. V., Shaver P., 2001, A&A, 379, 393
- Fejes et al. (1992) Fejes I., Porcas R. W., Akujor C. E., 1992, A&A, 257, 459
- Fey & Charlot (1997) Fey A. L., Charlot P., 1997, ApJS, 111, 95
- Fey & Charlot (2000) Fey A. L., Charlot P., 2000, ApJS, 128, 17
- Fey et al. (1996) Fey A. L., Clegg A. W., Fomalont E. B., 1996, ApJS, 105, 299
- Fomalont et al. (2000) Fomalont E. B., Frey S., Paragi Z., Gurvits L. I., Scott W. K., Taylor A. R., Edwards P. G., Hirabayashi H., 2000, ApJS, 131, 95
- Gower & Hutchings (1984) Gower A. C., Hutchings J. B., 1984, AJ, 89, 1658
- Gurvits et al. (1994) Gurvits L. I., Schilizzi R. T., Barthel P. D., Kardashev N. S., Kellermann K. I., Lobanov A. P., Pauliny-Toth I. I. K., Popov M. V., 1994, A&A, 291, 737
- Haehnelt et al. (1998) Haehnelt M. G., Steinmetz M., Rauch M., 1998, ApJ, 495, 647
- Harvanek et al. (1997) Harvanek M., Stocke J. T., Morse J. A., Rhee G., 1997, AJ, 114, 2240
- Hintzen et al. (1983) Hintzen P., Ulvestad J., Owen F., 1983, AJ, 88, 709
- Hodges et al. (1984) Hodges M. W., Mutel R. L., Phillips R. B., 1984, AJ, 89, 1327
- Kanekar & Chengalur (1997) Kanekar N., Chengalur J. N., 1997, MNRAS, 292, 831
- Kanekar & Chengalur (2001) Kanekar N., Chengalur J. N., 2001, A&A, 369, 42
- Kanekar & Chengalur (2003) Kanekar N., Chengalur J. N., 2003, A&A, 399, 857
- Kanekar et al. (2001) Kanekar N., Chengalur J. N., Subrahmanyan R., Petitjean P., 2001, A&A, 367, 46
- Kanekar et al. (2001) Kanekar N., Ghosh T., Chengalur J. N., 2001, A&A, 373, 394
- Lane et al. (1998) Lane W., Smette A., Briggs F. H., Rao S. M., Turnshek D. A., Meylan G., 1998, AJ, 116, 26
- Lane & Briggs (2001) Lane W. M., Briggs F. H., 2001, ApJ, 561, L27
- Lane et al. (2000) Lane W. M., Briggs F. H., Smette A., 2000, ApJ, 532, 146
- Lanfranchi & Friaça (2003) Lanfranchi G. A., Friaça A. C. S., 2003, MNRAS, 343, 481
- Lanzetta et al. (1995) Lanzetta K. M., Wolfe A. M., Turnshek D. A., 1995, ApJ, 440, 435
- Lanzetta et al. (1991) Lanzetta K. M., Wolfe A. M., Turnshek D. A., Lu L., McMahon R. G., Hazard C., 1991, ApJS, 77, 1
- Le Brun et al. (1997) Le Brun V., Bergeron J., Boissé P., Deharveng J. M., 1997, A&A, 321, 733
- Lee et al. (2002) Lee H., Grebel E. K., Hodge P. W., 2002, BAAS, 34, 1121
- Levshakov & Varshalovich (1985) Levshakov S. A., Varshalovich D. A., 1985, MNRAS, 212, 517
- Lipovetsky et al. (1999) Lipovetsky V. A., Chaffee F. H., Izotov Y. I., Foltz C. B., Kniazev A. Y., Hopp U., 1999, ApJ, 519, 177
- Lister et al. (1994) Lister M. L., Gower A. C., Hutchings J. B., 1994, AJ, 108, 821
- Lonsdale et al. (1993) Lonsdale C. J., Barthel P. D., Miley G. K., 1993, ApJS, 87, 63
- Murphy et al. (1993) Murphy D. W., Browne I. W. A., Perley R. A., 1993, MNRAS, 264, 298
- Neff & Hutchings (1990) Neff S. G., Hutchings J. B., 1990, AJ, 100, 1441
- Perley (1982) Perley R. A., 1982, AJ, 87, 859
- Perlman et al. (1994) Perlman E. S., Stocke J. T., Shaffer D. B., Carilli C. L., Ma C., 1994, ApJ, 424, L69
- Pihlström et al. (2003) Pihlström Y. M., Conway J. E., Vermeulen R. C., 2003, A&A, 404, 871
- Pihlström et al. (1999) Pihlström Y. M., Vermeulen R. C., Taylor G. B., Conway J. E., 1999, ApJ, 525, L13
- Polatidis et al. (1995) Polatidis A. G., Wilkinson P. N., Xu W., Readhead A. C. S., Pearson T. J., Taylor G. B., Vermeulen R. C., 1995, ApJS, 98, 1
- Price et al. (1993) Price R., Gower A. C., Hutchings J. B., Talon S., Duncan D., Ross G., 1993, ApJS, 86, 365
- Prochaska et al. (2003) Prochaska J. X., Gawiser E., Wolfe A. M., Castro S., Djorgovski S. G., 2003, ApJ, 595, L9
- Prochaska & Wolfe (1997) Prochaska J. X., Wolfe A. M., 1997, ApJ, 487, 73
- Rantakyrö et al. (2003) Rantakyrö F. T., Wiik K., Tornikoski M., Valtaoja E., Bååth L. B., 2003, A&A, 405, 473
- Rao et al. (2003) Rao S., Nestor D. B., Turnshek D., Lane W. M., Monier E. M., Bergeron J., 2003, ApJ, 595, 94
- Rao & Turnshek (1998) Rao S. M., Turnshek D. A., 1998, ApJ, 500, L115
- Reid et al. (1995) Reid A., Shone D. L., Akujor C. E., Browne I. W. A., Murphy D. W., Pedelty J., Rudnick L., Walsh D., 1995, A&AS, 110, 213
- Reid et al. (1999) Reid R. I., Kronberg P. P., Perley R. A., 1999, ApJS, 124, 285
- Roberts et al. (1976) Roberts M. S., Brown R. L., Brundage W. D., Rots A. H., Haynes M. P., Wolfe A. M., 1976, AJ, 81, 293
- Rogora et al. (1987) Rogora A., Padrielli L., de Ruiter H. R., 1987, A&AS, 67, 267
- Ryan-Weber et al. (2003) Ryan-Weber E. V., Webster R. L., Staveley-Smith L., 2003, MNRAS, 343, 1195
- Saikia et al. (1998) Saikia D. J., Holmes G. F., Kulkarni A. R., Salter C. J., Garrington S. T., 1998, MNRAS, 298, 877
- Schilizzi et al. (1982) Schilizzi R. T., Kapahi V. K., Neff S. G., 1982, JA&A, 3, 173
- Shen et al. (1997) Shen Z.-Q., Wan T.-S., Moran J. M., Jauncey D. L., Reynolds J. E., Tzioumis A. K., 1997, AJ, 114, 1999
- Shen et al. (1998) Shen Z.-Q., Wan T.-S., Moran J. M., Jauncey D. L., Reynolds J. E., Tzioumis A. K., 1998, AJ, 115, 1357
- Srianand & Petitjean (1998) Srianand R., Petitjean P., 1998, A&A, 335, 33
- Stanghellini et al. (1990) Stanghellini C., Baum S. A., O’Dea C. P., Morris G. B., 1990, A&A, 233, 379
- Stanghellini et al. (1997) Stanghellini C., O’Dea C. P., Baum S. A., Dallacasa D., Fanti R., Fanti C., 1997, A&A, 325, 943
- Stanimirovic et al. (2003) Stanimirovic S., Weisberg J. M., Dickey J. M., de la Fuente A., Devine K., Hedden A., Anderson S. B., 2003, in Magnetic Fields and Star Formation: Theory Versus Observations PSR B1849+00 probes the tiny-scale molecular gas? Kluwer
- Stocke et al. (1984) Stocke J. T., Foltz C. B., Weymann R. J., Christiansen W. A., 1984, ApJ, 280, 476
- Tingay et al. (1998) Tingay S. J., et al, 1998, ApJ, 497, 594
- Turnshek et al. (1989) Turnshek D. A., Wolfe A. M., Lanzetta K. M., Briggs F. H., Cohen R. D., Foltz C. B., Smith H. E., Wilkes B. J., 1989, ApJ, 344, 567
- Ulvestad et al. (1981) Ulvestad J., Johnston K., Perley R., Fomalont E., 1981, AJ, 86, 1010
- van Breugel et al. (1992) van Breugel W. J. M., Fanti C., Fanti R., Stanghellini C., Schilizzi R. T., Spencer R. E., 1992, A&A, 256, 56
- Vermeulen et al. (2003) Vermeulen R. C., et al., 2003, A&A, 404, 861
- Wilkinson et al. (1998) Wilkinson P. N., Browne I. W. A., Patnaik A. R., Wrobel J. M., Sorathia B., 1998, MNRAS, 300, 790
- Wills et al. (1995) Wills B. J., et al., 1995, ApJ, 447, 139
- Wolfe (1980) Wolfe A. M., 1980, Physica Scripta, 21, 744
- Wolfe et al. (1981) Wolfe A. M., Briggs F. H., Jauncey D. L., 1981, ApJ, 248, 460
- Wolfe et al. (1985) Wolfe A. M., Briggs F. H., Turnshek D. A., Davis M. M., Smith H. E., Cohen R. D., 1985, ApJ, 294, L67
- Wolfe & Burbidge (1975) Wolfe A. M., Burbidge G. R., 1975, ApJ, 200, 548
- Wolfe & Davis (1979) Wolfe A. M., Davis M. M., 1979, AJ, 84, 699
- Wolfe et al. (2003) Wolfe A. M., Gawiser E., Prochaska J. X., 2003, ApJ, 593, 235
- Wolfe et al. (2003) Wolfe A. M., Prochaska J. X., Gawiser E., 2003, ApJ, 593, 215
- Young et al. (2001) Young L. M., van Zee L., Dohm-Palmer R. C., Lo K. Y., 2001, in Hibbard J. E., R. M., van Gorkom J. H., eds, Gas and Galaxy Evolution Star Formation and the Interstellar Medium in Dwarf Galaxies. ASP Conf. Ser., Vol 240, San Francisco, p. 187
- Young et al. (2003) Young L. M., van Zee L., Lo K. Y., Dohm-Palmer R. C., Beierle M. E., 2003, ApJ, 592, 111
This paper has been typeset from a TeX/LaTeX file prepared by the author.
APPENDIX A
Our initial motivation for this work was a search for 21-cm absorption in DLAs with the Parkes radio telescope. From the September 2001 version of our catalogue of all known DLAs (Curran et al., 2002)101010A version of this catalogue is continually updated on-line and is available from http://www.phys.unsw.edu.au/sjc/dla we shortlisted those which are illuminated by radio-loud QSOs (i.e. those with a measured radio flux density Jy). From these, the DLAs with redshifts appropriate to the Parkes 70-cm receiver bandwidth (i.e. ) known to occult southern (∘) QSOs were selected (Table 3).
| QSO | ||||
|---|---|---|---|---|
| 0432–440c | 20.8 | 2.297 | 430.82 | 0.72 |
| 0438–436c | 20.8 | 2.347 | 424.38 | 8.10 |
| 0528–250b | 20.6 | 2.1410 | 452.65 | 0.14 |
| 1017+109b | 19.9 | 2.380 | 420.24 | 1.43 |
| 1021–006a,b | 19.6 | 2.398 | 418.01 | 0.50 |
| 1228–113c | 20.6 | 2.193 | 444.85 | 0.35 |
| 2136+141a | 19.8 | 2.134 | 453.22 | 0.76 |
Although there are 7 possible targets, we used the hours scheduled to concentrate on 3 of the 4 confirmed DLAs; 0432–440, 0438–436 & 1228–1131111111017+109, 1021–006 and 2136+141 are candidate DLAs which have yet to be confirmed using high resolution optical spectroscopy.. 0528–250 was excluded due to its relatively low flux density. The redshifts of these DLAs are known to within (Sara Ellison, private communication), corresponding to MHz ( ).
The observations were undertaken in January 2002 using the 70-cm receiver on the Parkes 64-m antenna. We used the AT conversion system with the multibeam correlator, giving a bandwidth of 8 MHz () over 2048 channels (i.e. a spectral dispersion of 2.8 per channel) and position switching with 1∘ beam throw. The weather was clear and dry giving system temperatures typically between 60 and 150 K. Although we restricted our observations to night time, we experienced severe radio-frequency interference (RFI) in this band. The RFI consisted primarily of sharp () ‘spikes’ and broad () ‘humps’. The humps in particular were found to shift in frequency between 120-s scans of the on- and off-source positions. Therefore, attempts to subtract the off-source scans from their corresponding on-source scans merely introduced strong RFI variations in the residual spectrum with characteristic length scales , i.e. the very scales typical of Hi 21-cm absorption lines in DLAs (see Table 2). The stronger spikes were also often accompanied by a powerful ‘ringing’ such that strong correlations between neighbouring channels could be seen to die away over scales. The data reduction was therefore carried out using software written specifically for the purpose of dealing with this RFI. The reduction steps are summarised as follows:
-
1.
The off-source scans were discarded and the on-source scans were low-pass filtered to provide a basic continuum shape which included the humps but ignored the spikes. The filtering scale was set so that absorption features could be recovered reliably. This continuum was then subtracted from the on-source scans leaving relatively flat residual spectra contaminated by the spikes.
-
2.
For each QSO, all contributing scans were corrected to the heliocentric frame and re-dispersed to a common frequency scale with a dispersion of .
-
3.
A error array was constructed for each re-dispersed scan based on the rms in a sliding 20-channel window and channels with fluxes deviating by more than were flagged and ignored in further reduction steps.
-
4.
Finally, the fluxes in corresponding channels in each scan were median filtered, values more than from the median rejected and the remaining values combined to form the weighted mean flux density and error arrays.
In Fig. 6 we show the resulting spectra for each DLA. It is
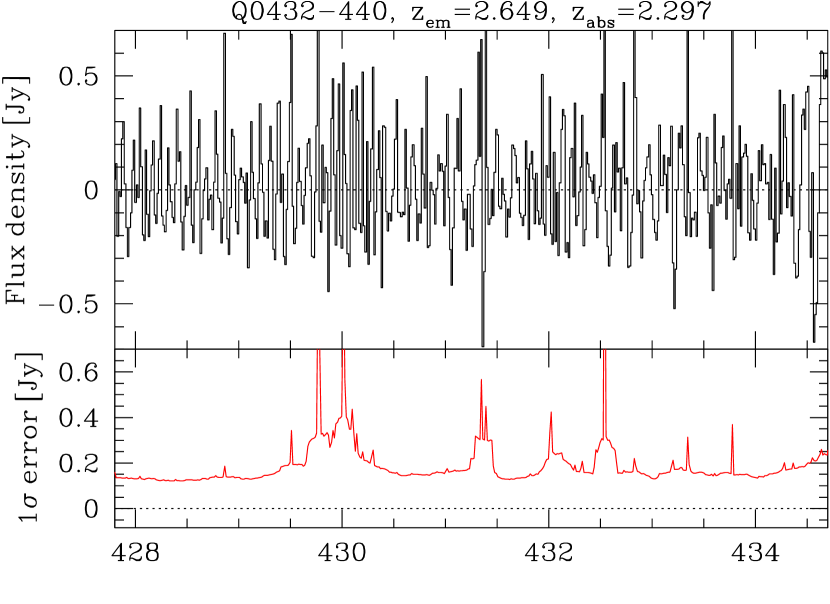
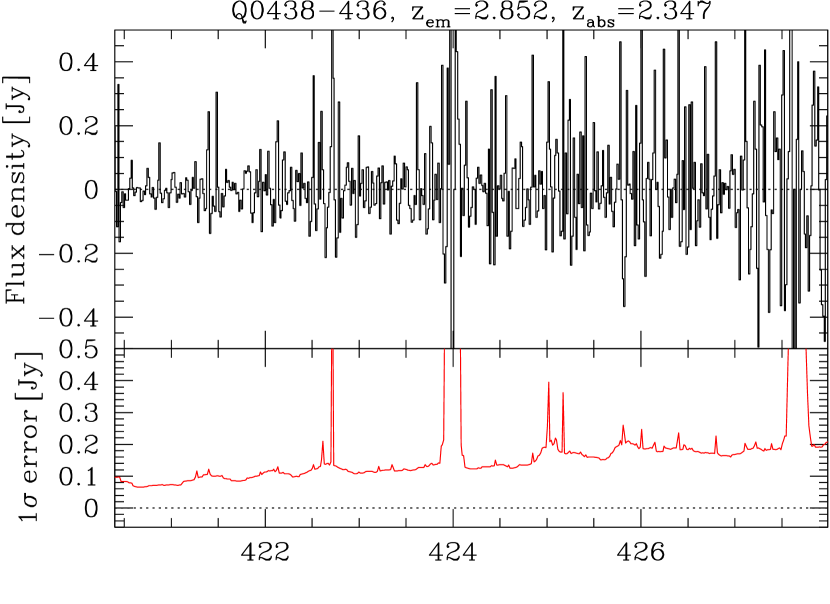
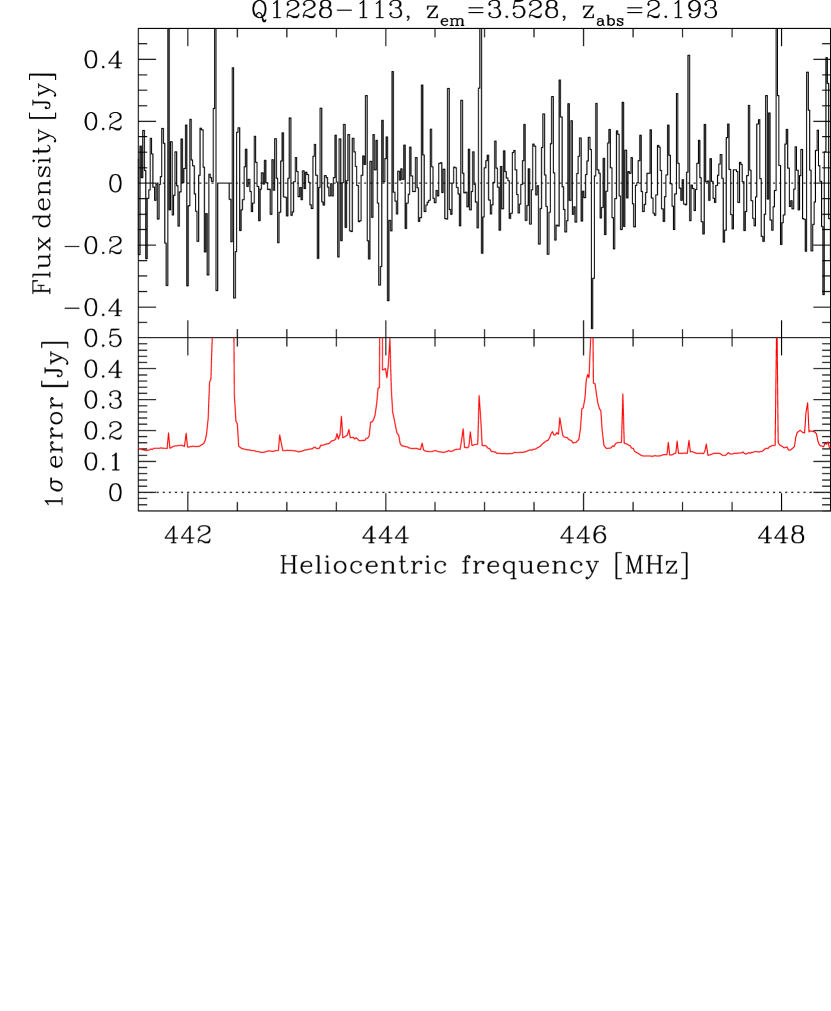
clear that there are no significant, convincing absorption features over the mitigated intervals covered by the spectra (which include the frequencies expected from the optical redshifts). Generally, the noise level is quite high, – (cf. the theoretical value of mJy per 10 channel) and some regions of the spectra were so severely affected by RFI that the errors are higher still. Where no reliable data could be gathered from any of the contributing scans, we have assigned a normalized flux density of zero and an effectively infinite error. Note also that the low-pass filter applied in stage (i) of the reduction procedure effectively prevents us from detecting absorption features with . The optical depth limits quoted in Table 1 for these sources must therefore carry these caveats.
Due to the severe RFI, no flux densities could be obtained for our sources. Using the values in Table 3, for Jy at 10 resolution we obtain no detection of the flux for either 0432–440 nor 1228–113 and for the optical depth of 21-cm absorption in the DLA towards 0438–436. From equation 2 and the column density of the Lyman- line (Table 1), this gives K , i.e. K per 3 channel or K for a FWHM of 20 (see Section 2.2).