SURFACE COMPOSITIONS OF R CORONAE BOREALIS STARS & EXTREME HELIUM STARS - SOME CONNECTIONS
Abstract
Abundances of R Coronae Borealis stars (RCBs) and Extreme Helium stars (EHes) are discussed. Recent estimates of the -process elements in hot extreme helium stars show enhancements of lighter -process elements (Y, Zr) relative to heavier -process elements, a characteristic shared by RCB stars. It also suggests that atleast some EHe stars went through an episode of -process element synthesis in their earlier evolution. A majority of RCB stars show a high 12C/13C ratio in their atmospheres. A recent analysis of the spectrum of minority RCB star V CrA, however, shows a lower value between 4 10. The implications of these results are discussed.
1 Introduction
It is a great pleasure to be able to participate in this celebration honouring Prof. David Lambert. I would like to convey to David greetings and best wishes from his numerous friends and admirers in India. It is almost a hundred years since Ludendorff discovered the absence of Balmer lines in the spectrum of the F type irregular variable R CrB, the first recognised hydrogen deficient star. About 35 years later, the first helium star was discovered by Popper. The basic problem about the origins of these stars, namely, a single (or double) star of intermediate mass becoming a high luminosity hydrogen deficient star, still remains a mystery. Presently, there are two principal hypotheses to account for their origins. The prime contender is the white dwarf merger scenario (or double degenerate, DD) in which a helium white dwarf secondary is accreted onto a CO (or He) white dwarf primary resulting in the ignition of a helium shell in the accreted envelope. The energy generated forces the star to expand to cool supergiant dimensions. The life time at this stage depends on the supply of helium in the shell and the mass of the envelope. The subsequent evolution would be like a canonical post-AGB contraction to the white dwarf track (Webbink 1984, Iben & Tutukov 1984, Saio & Jeffery 2000). The second scenario proposed is called the late thermal pulse (or final flash, FF), in which an AGB star in its final stages retains a helium shell of enough mass as to get ignited for a last time after it descends on to the white dwarf track. The final thermal pulse forces the star to become a cool supergiant for a second time. The subsequent evolution would again resemble the canonical post-AGB evolution of single stars (Iben et al. 1983). Presently, there are no decisive observational tests predicted to choose either one (or any other alternative) of the scenarios.
Several groups of hydrogen deficient stars have now been identified ranging from high luminosity (low surface gravity) cooler HdC stars, RCBs, EHes to low luminosity (high gravity) hot PG 1159 stars (see Jeffery 1996 for a display of various groups in the log , log plane). It is not clear how these various groups of hydrogen deficient stars are related to each other e.g., EHes and RCBs. Do they represent sucessive stages in evolution? Even some groups are further subdivided and show diversity in properties e.g., majority and minority RCBs which show [S/Fe], [Si/Fe] values of about 0.5 and much higher, respectively (Lambert & Rao 1994, Asplund et al. 2000). Do they suggest different paths of evolution? In the last few years, stars like Sakurai’s object and FG Sge provided us examples of stellar evolution in real time by turning from a normal star to hydrogen deficient born-again giant (Asplund et al. 1997, Gonzalez et al. 1998, Duerbec et al. 2002). How are these born-again giants related to RCBs are some of the intriguing questions that the theory of intermediate mass star evolution is unable to provide. In keeping with the theme of the conference,‘abundances as records of stellar evolution and nucleo- synthesis’, I would like to explore in this presentation the interrelationships of RCBs and EHes and also address some of the issues raised above by seeking clues from surface chemical compositions.
2 Properties
R Coronae Borealis (RCB) stars are carbon-rich, hydrogen-poor F-G supergiants that exhibit light fades of several magnitudes at irregular intervals due to circumstellar dust formation. They range in from 8000 to 4000 K. After Keenan & Barnbaum’s (1997) spectroscopic investigation even the cool so-called DY Per stars also seem to belong to this class, extending the to 3500 K. The effective gravities range from log = 0.5 to 1.5. The RCB population in the LMC provides the estimates of absolute magnitudes which range from 2.5 to 5 and corresponding luminosities log (L/) of 4.0 3.2 (Alcock et al. 2001). Presently known members in the Galaxy amount to about 35 including the 3 hot RCBs, about 21 are known in the LMC (including DY Per stars) and a lone one in the SMC (Alcock et al. 2001, Morgan et al. 2003). The distribution of the number of RCBs with respect to spectral type suggests a peak around F-G for Galactic ones whereas the LMC population shows a peak at much cooler temperatures. By scaling the LMC population of RCBs to the Galaxy, Alcock et al. estimate more than 3200 to be present in the galaxy most of them being cooler members. Any evolutionary schemes that are proposed to explain the origins should also be able to account for these numbers. The two evolutionary schemes that have been proposed (DD and FF) can account only partially for the estimated number of RCBs present in the Galaxy (Iben, Tutukov, Yungelson 1996). Extreme helium stars are mostly carbon rich, hydrogen poor A-B supergiants. Some of them show short period pulsations with a period of a few days. They range in from 32000 to 9000 K with log of 0.7 to 4.0 . The luminosities, log L/ ,are estimated to be about 4.4 to 3.0 (Saio & Jeffery 2000 ). Presently there are about 21 known members in the Galaxy and none in either LMC or SMC.
The Galactic distribution of both groups (RCB and EHe) suggests a bulge population (Jeffery et al. 1987) and might belong to the thick disk, although there are suggestions that a few of them might even be part of the halo (eg. U Aqr - Cottrell & Lawson 1998).
The first major study of the surface abundances of a larger number of RCBs by Lambert & Rao (1994) revealed that majority of the stars analysed (14 out of 18) showed similar patterns; particularly [Si/Fe] and [S/Fe]111the [] notation refers to log (i)⋆ log (i)⊙ are around 0.5 and a mild Fe deficiency relative to solar. The minority RCBs are marked by approximately solar Si and S abundances and a severe Fe deficiency (or a very high [Si/Fe], [S/Fe]). A similar classification by Fe abundance was also suggested for EHe stars (Heber 1986).
3 Spectral analyses
Before discussing the surface abundances it is appropriate to recall some of the uncertainities involved in arriving at these estimates. Most of the analyses are based on the line-blanketed, LTE atmospheric models computed at Uppsala by Asplund et al. (1997) for RCB stars of 8000 to 6000 K and at Armagh by Jeffery & Heber (1992), Jeffery, Woolf, Pollacco (2001) for EHes with 9000 K. The continuous opacity in the atmospheres of RCBs is controlled by the photoionization of C i from excited levels and the gas pressure is provided by helium. In estimating the mass fraction of elements, a crucial parameter needed for RCBs is the C/He ratio (the number density of carbon to helium), which can not be estimated from the spectrum directly (Rao & Lambert 1996, Asplund et al. 2000). This ratio in EHes, which can be directly estimated from the analysis of spectral lines (Jeffrey 1996, Pandey et al. 2001) has a mean value of 1%. It has been assumed in the analyses of RCBs that the same C/He of 1% holds. This value of C/He seems to be consistent with the metallicity expected from galactic distribution (Rao & Lambert 1996, Pandey et al. 2001). One of the surprising outcomes of the atmospheric analysis of RCBs is the so called ‘carbon problem’, as discussed in detail by Asplund et al. (2000)(first noticed by David Lambert). The carbon abundance estimated from the observed C i lines is four times less than the input carbon abundance for C/He, with less input the C/He ratio is very very small. Recently, based on the analysis of [C i] lines 9850Å and 8727Å, Pandey et al. (2004b) suggest that a chromosphere like temperature rise in the atmosphere might be able to account for the carbon problem. However it was realised by Asplund et al. (2000) that the abundance ratios are largely unaffected by the carbon problem (and the assumed C/He values). An of 5 has been assumed for all RCBs in arriving at the appropriate and log , although it is known that LMC RCBs show a range of values. As discussed by Pandey et al. (2001), the element which represents the initial metallicity of the stars is not clear, whether it is Fe or Si, S. A metallicity parameter M has been defined by Pandey et al. based on the Si, S abundances that represents initial Fe abundance. The observed Fe abundance might be affected by things other than the intial metallicity of the star. This property might even apply to hot RCB stars like DY Cen as well. The extreme Fe deficiency is suggested to be a result of the accretion of winnowed gas from dust (Jeffery & Heber 1993).
4 Abundance Patterns
The surface abundances of RCBs and EHes have been estimated by Asplund et al. (2000), Rao & Lambert (2003, 2004), Jeffery (1996), Pandey et al. (2001) and Pandey et al. (2004a). Both RCBs and EHes show the majority, minority division proposed by Lambert & Rao (1994). Mainly they are differentiated by Fe abundance. The majority cluster around [Fe] of 1 and the minority show a larger deficiency about 1.7 or more. Since a C/He of 1% is assumed for all stars (except the minority RCB star V854 Cen for which a value of 10% is suggested -Asplund et al. 1998), the absolute numbers can be compared. 15 stars out of 19 analysed RCBs comprise the majority and 12 out of 14 EHes analysed constitute the majority class. The 4 minority RCBs are V CrA, VZ Sgr, V3795 Sgr and V854 Cen and the 2 minority EHes are BD +10 2179 and FQ Aqr. The mean abundances (normalised to (X) = 12.15 with as the atomic weight) of each group are shown in Table 1. The dispersion around
| Element | Z | Maj. RCBs(15) | Min. RCBs(4) | Maj. EHes(12) | Min. EHes(2) |
|---|---|---|---|---|---|
| H | 1 | 6.140.89 | 7.57 | 7.190.95 | 7.35 |
| He | 2 | 11.54 | 11.54 | 11.54 | 11.54 |
| C | 6 | 8.910.14 | 9.00.35 | 9.320.22 | 9.050.05 |
| N | 7 | 8.670.23 | 7.880.20 | 8.360.34 | 7.630.48 |
| O | 8 | 8.170.41 | 8.220.59 | 8.600.48 | 8.50.4 |
| Ne | 10 | 8.3(1) | 7.9(1) | 9.11(6)0.25 | 7.9(1) |
| Na | 11 | 6.130.22 | 5.94 | 6.5(3)0.8 | |
| Mg | 12 | 6.72(5)0.21 | 6.3(3)0.22 | 7.400.35 | 6.50.5 |
| Al | 13 | 5.950.29 | 5.510.14 | 6.070.52 | 5.50.8 |
| Si | 14 | 7.120.19 | 7.34 | 7.230.60 | 6.50.2 |
| P | 15 | 5.9(1) | 6.5(1) | 5.620.47 | 4.850.65 |
| S | 16 | 6.870.33 | 6.930.40 | 7.080.32 | 6.550.55 |
| Ca | 20 | 5.360.19 | 5.160.07 | 5.84(5)0.27 | 4.2(1) |
| Sc | 21 | 2.87(6)0.19 | 2.89 | 3.3(1) | 2.1(1) |
| Ti | 22 | 4.03(8)0.14 | 3.6(3)0.34 | 4.53(3)0.17 | 3.250.05 |
| Fe | 26 | 6.490.24 | 5.73 | 6.890.32 | 5.70.3 |
| Ni | 28 | 5.820.24 | 5.440.43 | 5.93(3)0.47 | 5.0(1) |
| Zn | 30 | 4.34(13)0.28 | 4.080.21 | 4.4(2)0.2 | 4.14(1) |
| Y | 39 | 2.080.50 | 1.940.60 | 2.270.59 | 1.75(1) |
| Zr | 40 | 2.09(8)0.29 | 2.040.48 | 2.7(4)0.60 | 1.830.53 |
| Ba | 56 | 1.430.56 | 0.970.43 | 1.7 | 0.5 |
the mean in each group is surprisingly small particularly for the majority groups of RCBs and EHes 0.27 dex. Only H and the -process elements show a little more dispersion. The similarity in the abundance pattern of the majority RCBs and EHe (Fe of 6.5 and 6.8, respectively) is striking. The mean difference for 15 elements is 0.23 dex. However H, N, Ne and Mg show significant differences. The minority groups RCBs and EHes (Fe of 5.7 for both) also show small differences ( 0.13 dex) for most elements except Si, Ca (may be P and Sc). The fact that the H abundance for the majority of RCBs is lower by 1.0 dex compared to EHes and the N abundance is also higher by 0.3 dex might suggest that RCBs are a later phase in evolution to EHes, However, the larger abundance of Ne and Mg in EHes furthur indicates that 14N is converted to 22Ne and 25Mg by alpha processing, thus EHes might be a later phase to RCBs as is expected from the tracks of post AGB stars in the log , log plane.
4.1 CNO abundances
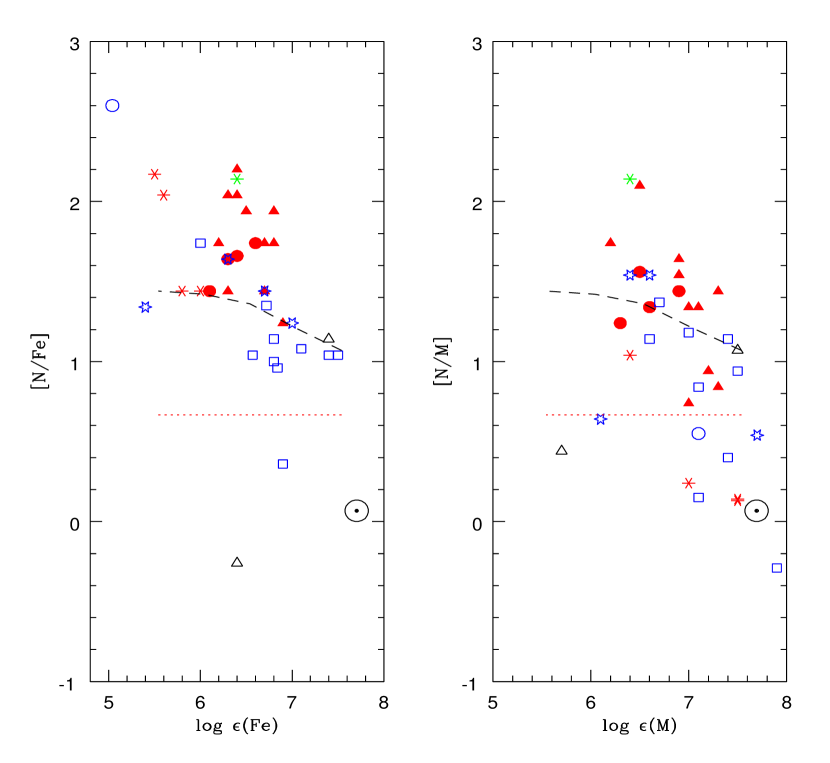
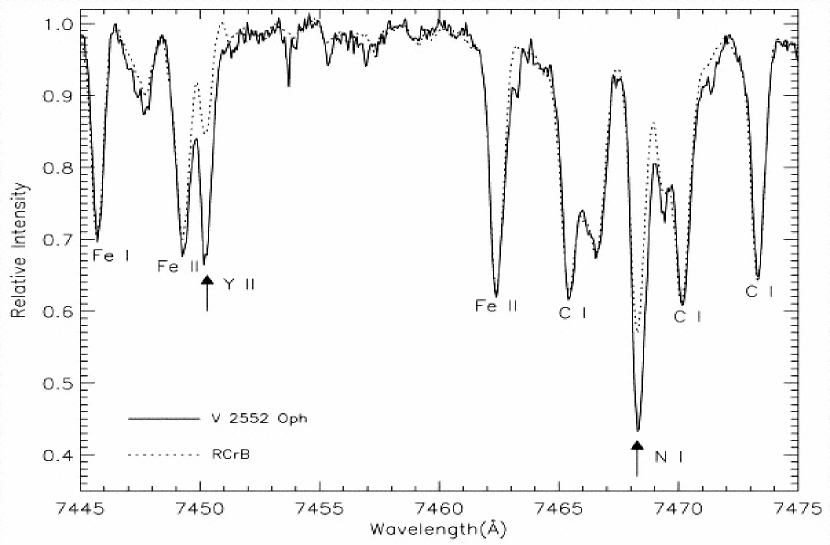
Figure 1 shows [N/Fe] versus Fe and [N/M]versus M (the metalicity parameter) for both groups of RCBs and EHes. Clearly, most of the RCBs have N abundances that are predicted from conversion of initial C and O to N or even more. In some cases C, produced in the He burning, might also have been converted to N. The newly discovered RCB star V2552 Oph may be one such and illustrates the N enhancement prominently (Rao & Lambert 2003).
Although R CrB and V2552 Oph have very similar line spectra and physical parameters, V2552 Oph shows much stronger N i lines than R CrB. On the other hand, the N abundance in EHes generally lies between the expected N from conversion of initial C to N and the value of N expected from conversion of initial C, O both to N . The minority stars (both groups and DY Cen) have N abundances less than that expected from full convertion of C to N. Although the N abundance in many RCBs and in some EHes imply wholesale conversion of O to N via ON cycles, many stars are not O deficient suggesting O is synthesized along with C, i.e., 3 -process was followed by 12CO. Most of the O-rich stars have an observed O/C about 1 implying equal production of C and O.
4.2 -Process elements
Dramatic enhancement of light -process elements Sr, Y, and Zr was first seen in cool RCB star U Aqr (Bond et al. 1979). Asplund et al. (2000) have shown that most of the RCB stars show enhancements [Y/Fe] of about 0.8 and [Ba/Fe] of about 0.4, i.e., the lighter -process elements are more enhanced than the heavier ones. However, there is a considerable dispersion in the Y and Ba abundances in RCBs.
Both Y and Ba abundances seem to be anticorrelated with H abundance. U Aqr shows extraordinary overabundances of -process elements [Y/Fe] 3.3 and [Ba/Fe] 2.1 (Vanture et al. 1999). Generally these enhancements relative to Fe are consistent with a mild single neutron exposure 0.1 mb-1 These estimates of -process abundances are not available for EHes stars (Asplund et al. 2000). Did EHe stars pass through a phase of -process element production (similar to RCBs ) ? Did they undergo third dredgeup and show -process abundance pattern similar to AGB or post -AGB stars. These are some of the questions that need to be addressed.

In the atmospheres of the hot EHes most of the -process elements exist in doubly ionized state and lack spectral lines in the optical region. [Let me add a personal note here. In 1996 January, David Lambert and I were attending a conference on spectroscopy in Bombay where we heard a talk by Indrek Martinson discussing the Zr iii and Y iii spectra in UV and the availability of fairly decent -values. This prompted us to apply for - spectra in search of Zr and Y abundances in EHe stars.] Fortunately, strong lines of Yiii, Zr iii, Ce iii, La iii etc., do occur in the UV where EHe stars have appreciable flux. We could obtain UV spectra of 7 EHe stars with on . Analyses of the spectra of two EHe stars V1920 Cyg and HD 124448 demonstrate the similarities in the pattern of -process elements with RCBs. The two stars have the same log and log but show large differences in [Y/Fe] and [Zr/Fe] (similar to RCBs) (Figure 3). V1920 Cyg has more enhanced abundances of Y, Zr and the range in abundance variations is also very similar to RCBs (Pandey et al. 2004).

Although the abundances of heavy -process elements could not be estimated, the upper limits of the abundances of Ce, Nd do demonstrate the lighter -process elements are more enhanced even in EHe stars. It is generally acknowledged that 13CO is the main source of neutrons to run the -processing in the He-burning shells of intermediate-mass AGB stars. Sufficient amounts of 13C are to be generated by slow mixing of protons into the 12C rich intershell regions to generate neutrons. The neutron irradiation occurs in radiative conditions. The heavier the neutron flux the greater is the abundance of heavies relative to light -process elements. Busso et al. (2001) used the distribution of the ratio of heavy -process celements (hs) to the light -process (ls) elements with respect to metallicity to characterize various parameters of neutron exposures during the third dredgeup phase in AGB stars eg. mass of 13C pocket in the inter shell regions. Reddy et al. (2002) showed that the variation of the [hs/ls] with respect to metallicity in post -AGB stars (that went through third dredgeup) is characterized by a model ST/1.5 of Busso et al. (2001).
A plot of [Y/M] and [Zr/M] versus [M] for RCBs and EHes (figure 4 ) shows that the enhancements are positive and both show a similar range in their abundances. We compared the run of the ratio of [ls/hs] for RCBs and EHes with respect to the metallicity parameter [M] . The estimates for EHes are based on the upper limits for the heavy -process elements and includes data from our ongoing analysis of the UV spectra. Estimates of U Aqr and the born again giant, Sakurai’s object (during May - Oct 1996) are also included for comparison. Both the groups RCBs and EHes blend together emphasizing the similarity in their ls/hs ratios.

Figure 5 shows a comparison of the trend of [ls/hs] in RCB and EHe stars along with that shown by post- AGB stars (Reddy et al. 2002) and the Busso et al’s (2001) model ST/1.5. It is obvious that the trend of [ls/hs] with respect to metallicity of RCB and EHes is quite different from that shown by post-AGB stars. It also, probably, suggests the -processing in RCBs and EHes is not a result of the third dredgeup and could have happened when the stars passed through a second AGB phase (presumably).
5 Minority RCBs and Sakurai’s object (V4334 Sgr)
Are the minority RCBs born-again giants? The similarity of the abundance pattern of V854 Cen with Sakurai’s object, a clear example of born-again giant (final flash object), has been pointed out by Asplund et al. (1998). It is expected that the final flash objects show a C/He ratio much greater than 1%, say about 10 to 30%. The C/He value of 10% has been estimated for Sakurai’s object in 1996 May to October (Asplund et al. 1998). Asplund et al. infer a C/He of 10% for V854 Cen. Asplund et al. (1998, 2000) also state that there are indications to suggest that the minority objects V3795 Sgr and VZ Sgr have higher C/He values greater than 1% -may even be 10%.
The abundance patterns of the minority stars suggested more diversity and range, in particular light elements like H, N, O and some -processed elements. Particularly V CrA showed differences relative to other members. However, revised estimates from a recent analysis of higher resolution spectra (Rao & Lambert 2004) suggests similar abundances for N, O, etc., as for the rest of the members. The abundances are more uniform in the minority group as well. The abundance pattern (i.e., log X/Fe) of V CrA is more similar to that of Sakurai’s object during May - October 1996 (Asplund et al. 1997, 1999) for most elements except Mg, Si, S, and Ca. The -process elements in V CrA are also not enhanced as much as in Sakurai’s object.
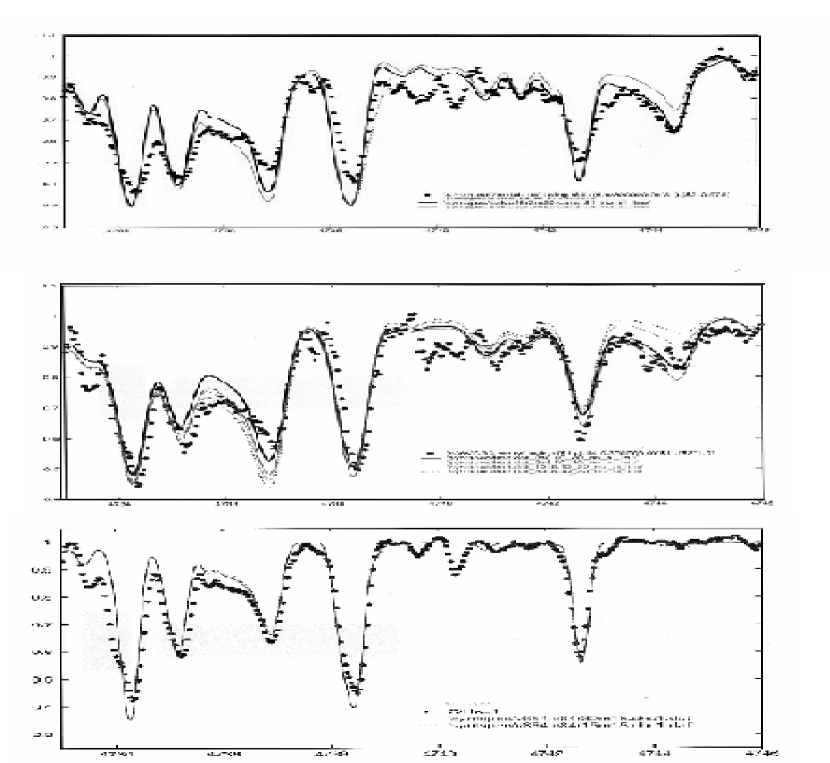
One of the expectations of the final flash scenario is the presence of 13C, and a low value of 12C/13C ratio. It is expected that surface protons are mixed into the intershell region trigering CN cycle and converting 12C to 14N and 13C depending on the proton supply (Renzini 1990). In fact, Sakurai’s object showed a 12C/13C value of 4 although the other final flash objects like FG Sge (Gonzalez et al. 1998) and V605 Aql (which showed a hydrogen deficient carbon star spectrum at maximum light -Lundmark 1919, Clayton & De Marco 1997) did not show the presence of 12C13C bands. Most RCBs have been shown to have a high value of the 12C/13C ratio. Keenan & Barnbaum (1997) detected the 12C13C band at 4744Å in the cool peculiar RCB variable DY Per. It was a surprise to find 12C13C bands in the minority star V CrA (Rao & Lambert 2004). We have synthesized the 12C12C and 12C13C bands of the Swan system (1,0) in the three stars; Sakurai’s object in Oct 1996, V854 Cen and V CrA (Figure 6) to match the observations. We used the line list and physical parameters obtained by Asplund et al. (1997) for Sakurai’s object. The estimated ratio of 12C/13C ranged between 3 5 for Sakurai’s object (Asplund et al. 1997), has an upper limit of 30 for V854 Cen and a value 4 10 for V CrA , thus displaying a similarity with Sakurai’s object. The presence of 13C in the atmosphere of a RCB star does support the suggestion 13CO is the neutron source. It is possible that the evolutionary path for all minority RCBs (may even EHes) is through final flash.
Discovery of a post -AGB hydrogen deficient star in globular cluster M5 (Dixon et al 2004) is an exciting new development which could pin down an age (and possible mass) to the progenitor.
In summary, it now appears that at least some EHe stars show enhanced abundances of light -process elements, e.g., Y, Zr as well as a ls/hs ratio similar to RCBs. The variation of the ls/hs ratio with decreasing metallicity suggests that -processing in RCBs and EHes is not similar to that experienced by post -AGB (and AGB) stars (i.e., ST/1.5 model of Busso et al. 2001). The abundance ratios suggest a single exposure of of 0.1 to 0.2 mb-1. It is likely that this episode of -process element production might have occured when the stars were passing through AGB phase for a second time. The similarity in the abundance patterns of majority RCBs and majority EHes including the -process elements and the presence of enhanced abundances of Ne and Mg in EHes does suggest that EHe phase might be later in evolution to that of RCBs. The minority RCBs seems to be a more coherent group in abundance distribution than earlier estimates indicated. Minority EHes and RCBs show a very similar abundance pattern, except for Si, Sc, and Ca, (elements that could be tied up in dust). RCBs have IR excesses and dust production episodes. The discovery of low 12C/13C ratio (4 10) in the minority RCB, V CrA does provide long awaited evidence for the mixing of surface protons to the intershell region and subsequent production of neutrons by 13CO, similar to Sakurai’s object. The similarity of abundance patterns of V CrA and V854 Cen to that displayed by Sakurai’s object in 1996 Oct might encourage the suggestion that all minority RCBs are formed through final flash.
6 Acknowledgements
I would like to thank my collaborators David Lambert, Gajendra Pandey, Simon Jeffery for letting me use some results before publication. I would also like to thank Martin Asplund for supplying me atmospheric models and line lists for 12C13C bands. I would like to express my thanks to David Yong, Eswar Reddy and Gajendra Pandey for preparing the figures and other help. I would also like express my appreciation to the organisers of the conference for their generous hospitality in Austin.
7 References
Alcock, C., Allsman, R. A., Alves, D. R., et al. 2001, ApJ,554, 298
Asplund, M., Gustafsson, B., Kiselman, D., Eriksson, K.1997a, A&A, 318, 521
Asplund, M., Gustafsson, B., Lambert, D. L., Rao, N. K.1997b, A&A, 321, L17
Asplund, M., Gustafsson, B., Rao, N. K., Lambert, D. L.1998, A&A, 332, 651
Asplund, M., Lambert, D. L., Kipper, T., Pollacco, D.,Shetron, M. D. 1999, A&A, 343, 507
Asplund, M., Gustafsson, B., Lambert, D. L., Rao, N. K.,2000, A&A, 353, 287
Bond, H. E., Luck, R. E., Newman, M. J. 1979, ApJ, 233,205
Busso, M., Gallino, R., Lambert, D. L., Travaglio, C.,Smith, V. V. 2001, ApJ, 557, 802
Clayton, G. C., de Marco, O. 1997, AJ, 114, 2679
Cottrell, P. L., Lawson, W. A. 1998, PASA, 15, 179
Dixon, W. V., Brown, T. M., Landsman, W. B. 2004, ApJ,600, L43
Duerbeck, H. W., Liller, W., Sterken, C., et al. 2000,AJ, 119, 2360
Gonzalez, G., Lambert, D. L., Wallerstein, G.,Rao, N. K., Smith, V. V., McCarthy, J. K. 1998, ApJS,114, 132
Heber, U. 1986, in Hydrogen Deficient Stars,IAU Coll. 87, ed. K. Hunger, D. Schonberner &N. K. Rao, Reidel, Dordrecht, 32
Iben, I. Jr., Tutukov, A. V. 1984, ApJS, 55, 335
Iben, I, Jr., Tutukov, A. V., Yungelson, L. R. 1996,ApJ, 456, 750
Iben, I. Jr., Kaler, J. B., Truran, J. W., Renzini, A.1983, ApJ, 264, 605
Jeffery, C. S. 1996, in ASP Conf. Ser. Vol. 96,Hydrogen Deficient Stars, ed. C. S. Jeffery & U. Heber, 152
Jeffery, C. S., Heber, U. 1992, A&A, 260, 133
Jeffery, C. S., Heber, U. 1993, A&A, 270, 167
Jeffery, C. S., Drilling, J. S., Heber, U. 1987, MNRAS,226, 317
Jeffery, C. S., Woolf, V. M., Pollacco, D. L. 2001, A&A,376, 497
Keenan, P. C., Barnbaum, C. 1997, PASP, 109, 969
Lambert, D. L., Rao, N. K. 1994, J. Astrophys. Astron.,15, 47
Lundmark, K. 1921, PASP, 33, 814
Morgan, D. H., Hatzidimitriou, D., Cannon, R. D., Croke,B. F. 2003, MNRAS, 344, 325
Pandey, G., Rao, N. K., Lambert, D. L., Jeffery, C. S.,Asplund, M. 2001, MNRAS, 324, 937
Pandey, G., Lambert, D. L., Rao, N. K., Jeffery, C. S.2004a, ApJ, 602, L113
Pandey, G., Lambert, D. L., Rao, N. K., Gustafsson, B.,Ryde, N., Yong, D. 2004b, MNRAS, 353, 143
Rao, N. K., Lambert, D. L. 1996, in ASP Conf. Ser. Vol. 96,Hydrogen Deficient Stars, ed. C. S. Jeffery & U. Heber, 43
Rao, N. K., Lambert, D. L. 2003, PASP, 115, 1304
Rao, N. K., Lambert, D. L. 2004, (in preparation)
Renzini,A. 1990, in ASP Conf. Ser, Vol. 11, Confrontationbetween Stellar Pulsation and Evolution, ed. C. Cacciari,G. Clementini, 549
Reddy, B. E., Lambert, D. L., Gonzalez, G., Yong, D. 2002,ApJ, 564, 482
Saio, H., Jeffery, C. S. 2000, MNRAS, 313, 671
Saio, H., Jeffery, C.S. 2002, MNRAS, 333, 121
Vanture, A. D., Zucker, D., Wallerstein, G. 1999, ApJ, 514,932
Webbink, R. F. 1984, ApJ, 277, 355
8
J. C. Wheeler : Can you comment on mass measurements for the RCB and EHe stars?
K.Rao: Simon Jeffery and Vincent Woolf have tried to obtain estimates for two pulsating EHe stars V652 Her, LSS 3184. They obtain 0.5 for the mass. LSS 3184 is carbon rich. If a CO white dwarf has to get into action, this mass estimate is little low.
J. Lattanzio : Can you determine the Mg isotopes for your Mg-rich stars?
K.Rao: No. We have to find some molecule containing Mg to estimate isotope ratios. Since H is weak, MgH is not present, even in cool stars. It is a difficult problem.
J. Cohen : You and some previous speakers have spoken about abundance peculiarities. We need to make sure that the abundance peculiarities are real and not the result of the physical phenomena of gravitational settling and radiative levitation such as seen on the blue HB of globular clusters.
K.Rao: These stars are supergiants with low effective gravities, with rotation, and appreciable microturbulance. As such it is unlikely to expect gravitational settling to operate. Moreover, the abundance pattern is not similar to that seen in blue horizontal branch stars.