Disk evolution in the Ori OB1 association
Abstract
We analyze multi-band photometry of a subsample of low mass stars in the associations Ori OB1a and 1b discovered during the CIDA Orion Variability Survey, which have ages of 7 - 10 Myr and 3 - 5 Myr, respectively. We obtained photometry at Mt Hopkins for 6 Classical T Tauri stars (CTTS) and 26 Weak T Tauri stars (WTTS) in Ori OB1a, and for 21 CTTS and 2 WTTS in Ori OB1b. We also obtained band photometry for 14 CTTS at Mt. Hopkins, and 10m and 18m photometry with OSCIR at Gemini for 6 CTTS; of these, all 6 were detected at 10m while only one was detected at 18m. We estimate mass accretion rates from the excess luminosity at , and find that they are consistent with determinations for a number of other associations, with or without high mass star formation. The observed decrease of mass accretion rate with age is qualitatively consistent with predictions of viscous evolution of accretion disks, although other factors can also play a role in slowing accretion rates. We compare the excesses over photospheric fluxes in , and , and with the younger sample of Taurus and find an overall decrease of disk emission from Taurus to Ori OB1b to Ori OB1a. This decrease implies that significant grain growth and settling towards the midplane has taken place in the inner disks of Ori OB1. We compare the SED of the star detected at both 10m and 18m with disk models for similar stellar and accretion parameters. We find that the low m fluxes of this Ori OB1b star cannot be due to the smaller disk radius expected from viscous evolution in the presence of the FUV radiation fields from the OB stars in the association. Instead, we find that the disk of this star is essentially a flat disk, with little if any flaring, indicating a a significant degree of dust settling towards the midplane, as expected from dust evolution in protoplanetary disks.
1 Introduction
Most star formation studies are based on a few nearby associations without massive stars, as Taurus and Chameleon or in highly populated clusters with significant high mass formation, like the Orion Nebula Cluster (ONC). In recent years, several teams have begun systematic studies of the populations of the OB associations. These associations cover large volumes in the sky and include populations covering the entire mass range. OB associations have been subject of studies with Hipparcos (Brown et al. 1997; de Zeeuw et al. 1999), which has helped pinpoint their distances and mean ages. In a number of associations, the populations display a gradient of ages, from 1 Myr to a few 10 Myr, which has been interpreted as the result of triggered star formation (Blaauw 1964). This range of ages makes the OB associations the most suitable laboratory for studies of protoplanetary disk evolution, because it encompasses the time span in which giant planets are expected to form (Pollack et al. 1996; Alibert et al. 2004), and significant solid evolution is expected to take place, as indicated by meteoritic evidence (Podoseck & Cassen 1996; Wood 2004).
We are carrying out a photometric and spectroscopic survey of 128 degrees in the Orion OB1 association in order to identify the low mass population. Initial results of this survey have been presented by Briceño et al. (2001, 2004 = Paper I). In Paper I, we identified 197 new low mass members in the subassociations Ori OB1a and 1b, spanning the mass range from 0.2 to 1.4 . We found ages of 3 - 5 Myr for Ori OB1b and 7 - 10 Myr for Ori OB1a, confirming age determinations based on the OB stars (Blaauw 1964; Warren & Hesser 1977, 1978; Brown et al. 1994). We also found that Ori OB1b could be identified with a population associated with a ring of low density gas and dust, probably formed by a supernova event, with most of the Classical T Tauri stars (i.e., stars accreting from circumstellar disks; CTTS) near the ring, similar to the case of Ori (Dolan & Mathieu 1999, 2001, 2002). In contrast, Ori OB1a is in a region devoid of gas and dust, in agreement with its older age. We also found that the number of CTTS decreases sharply between Ori OB1b and 1a, indicating the few disks remain by 10 Myr, in agreement with findings from young clusters, some containing high mass stars, and low mass associations as TW Hya (Haisch, Lada, & Lada 2003; Hillenbrand, Carpenter, and Meyer 2004, in preparation; Sicilia-Aguilar et al. 2004, in preparation; Muzerolle et al. 2000, 2001).
In this work, we present multiwavelength photometry of a subset of the stars in Paper I, including stars in Ori OB1a, 1b and 1c. In particular, we have obtained photometry of a significant number of CTTS in these subassociations, from which we have determined mass accretion rates for comparison with disk evolution theories. We have also obtained band and mid-infrared (IR) measurements at 10m and 18m of a small subset of stars in Ori OB1, which has allowed us to make assessments of the state of the dust in their disks in comparison with younger populations. In §2 we present the photometry, and in §3, we examine the properties of the disks in Ori OB1a and 1b in comparison with the Taurus populations. We discuss the implications of these results for disk evolution in §4.
2 Observations and Data Analysis
The targets were selected from the sample of the Orion variability survey presented in Paper I, which were originally found on the basis of variability in the band using the QuEST camera on the 1m Schmidt telescope on the Venezuela National Observatory. Follow-up spectroscopy using the FAST Spectrograph (Fabricant et al. 1998) on the 1.5m telescope of the Fred Lawrence Whipple Observatory (FLWO) at Mt. Hopkins, and the Hydra multi-fiber spectrograph (Barden & Armandroff 1995) on the WYIN/3.5m telescope at Kitt Peak, confirmed their membership to Ori OB1 (cf. Paper I).
2.1 Optical photometry
We used the 4SHOOTER CCD array on the 1.2m telescope of the Fred L. Whipple Observatory on Mt. Hopkins during two observing runs to obtain photometry of our list of stars. The first run was during the nights of November 29 through December 4, 2002, although observations could be done only in the second half of the night of December 3 and all night on December 4. The second run was during October 15 - 20, 2003. All six nights were clear. The seeing was between 1.2″ and 2.5″ throughout the observations. The 4SHOOTER camera contains four Loral CCDs separated by 45″ and arranged in a grid. After binning during readout, the plate scale was . In order to achieve more uniform and consistent measurements, we placed all the target standard stars on the same CCD detector (chip 3).
We obtained photometry for 65 stars in Ori OB1a, 1b, and 1c, and -band photometry for 59 of these stars. In particular, out of 36 stars in Ori OB1a, we obtained photometry for all 6 CTTS and 26 WTTS; for the 27 stars in Ori OB1b, we obtained photometry for the 2 WTTS and 21 CTTS; finally, we obtained photometry for the 2 CTTS observed in Ori OB1c.
The basic processing of the FLWO data was done with IRAF111IRAF is distributed by the National Optical Astronomy Observatories, which are operated by the Association of Universities for Research in Astronomy, Inc., under cooperative agreement with the National Science Foundation. routines in the standard way. For both runs, the -band data were flat-fielded using sky flats taken at dusk/dawn. Instrumental magnitudes were obtained using the APPHOT package in IRAF. Though Orion is at a moderately low galactic latitude , our fields are not crowded in the relevant magnitude range, so aperture photometry is adequate. We used an aperture radius of 15 pixels for the source, the typical 3.5 pixel FWHM of our observations, large enough to include all the light from the standard stars as well as some observations made under mediocre seeing. We used a sky annulus with of 15 and 20 pixels for the inner and outer radii, respectively. The instrumental magnitudes were calibrated in the Johnson and Cousins system with observations of Landolt (1992) standard fields SA92, SA95, SA113 and PG0231+051 at various air masses every night; each field contains stars with a range of colors similar to our target objects. Our overall photometric errors are dominated by the transformation uncertainty, which are 0.05 mag in and 0.02 magnitudes for . The nightly variation in the zero points was 0.15, 0.07, 0.06, 0.04, 0.05 magnitudes for respectively, suggesting reasonably good photometric stability throughout both runs.
2.2 Near-infrared photometry
We obtained -band photometry for a subsample of 14 stars using the dual channel infrared camera STELIRCam (Tollestrup & Willner 1998) on the 1.2m telescope at FLWO during the nights of December 18-19, 2002. STELIRCam consists of two pixel InSb detector arrays. Each is fed from a dichroic mirror that separates wavelengths longer and shorter than m into two independent imaging channels (red and blue channels) for simultaneous observations on the sky. Three separate magnifications can be selected by rotating cold lens assemblies into the beam. The magnification is the same in both wavelength channels. For our observations we used the medium lens yielding a scale of and a field of view, together with the L-Barr filter (m) in the red channel. To convert the instrumental magnitudes of STELIRCam to the standard system, stars BD+0.1694, G77-31, Gl 105.5, Gl 406, HD 1160, HD 18881, HD 225023 and HD 40335 from the list of Elias et al. (1982) were observed each night at various air masses. Both the Orion and standard stars were observed with a square pattern with 20” dither between positions. The integration time at each dither position was 10 s ( coadditions).
All data were first linearized using frames obtained at various exposure times and routines developed in the Interactive Data Language (IDL) by T. Megeath at CfA. We then used standard IRAF routines to proceed with the data reduction. Average dark frames were constructed from darks taken at the beginning and end of each night’s observations. These average dark frames were then subtracted from each image. Sky frames were individually made for each observation by median-combining the nine unregistered frames in one dither pattern. The sky frames were subtracted from each image within the dither set. The high and low airmass frames were grouped into pairs, and the low airmass frame in each pair was subtracted from the high airmass frame. These subtracted pairs were then normalized and the pairs combined using a median statistic to create the flat field.
Typically only the target star was visible in the -band images, with a FWHM ranging from to 3 pixels. Thus, we measured instrumental magnitudes with the IRAF APPHOT package, using an aperture radius of 6 pixels, and a sky annulus with inner and outer radii of 10 and 20 pixels respectively, for both Orion and standard stars. After obtaining the zero points and color terms (which were small) we arrived at an -band error = 0.07 mags, mostly dominated by measurement errors.
The -band photometry is presented in Table 1, where we also include 2MASS magnitudes for the stars from Paper I.
2.3 Mid-infrared photometry
During the nights of December 3, 5 and 9, 2003 we obtained 10m and 18m photometry of a subsample of 6 stars in Ori OB1a and B. This subsample was selected among those CTTS with and with large excesses in the diagram. The observations were obtained in service mode using OSCIR on Gemini North at Mauna Kea. OSCIR is a mid-infrared (m) imager and low/medium-resolution (R=100-1000) spectrograph, which uses a pixel Si:As IBC detector optimized for the wavelength range m. On Gemini, OSCIR has a plate scale of about 0.084 arcsec/pixel and a total field of view in its imaging configuration of . We used the N-wide filter (m and m) and the IHW18 filter (m and m). In the rest of this article we will refer to these filters as the m and m filters. Typical exposure times for the Orion targets were 60s at m and 300s at m. Sky conditions were mostly clear through the observations. All the observations were performed using the standard technique of chopping and nodding, with a chop throw of 15” in declination. For calibration of the photometry the standard star CMa (Sirius) was observed on all nights at both wavelengths. Flux density estimates for Sirius were calculated using the SEDs published by Cohen et al. (1999). For Sirius, integration times were of the order of 6s in both m and m. The data were processed through the standard pipeline for OSCIR data. Chop pairs are subtracted: beam A - beam B or beam B - beam A for each set, depending on the nod position. Then these differences are averaged to form a final image. Because we were dealing with point sources, per recommendation of the Gemini staff no flat fielding was performed. The OSCIR array is very flat over the small number of pixels within the point spread function. Experience shared between Gemini and University of Florida is that the errors associated with the photometric calibration () are much larger than any flat field correction.
The m and m images showed only one object per frame, when detected at all. We used APPHOT to obtain aperture photometry of all targets. Images at m showed typical FWHM pixels (or arcsec), so we used an aperture radius of 15 pixels and inner and outer sky annulus radii of 15 and 25 pixels respectively. Because most of the Orion stars were not detected at m, we used consecutive pairs of m and m CMa images to determine average offset positions between the two filters, and used these to place the aperture at the predicted position in the m images of the Orion stars. In this way we measured upper limits to the flux in this band.
The mid-IR measurements are listed in Table 2. All stars were detected at 10m but only one measurement was secured at 18m. We list 3- upper limits in Table 2 for the non detections.
3 Results
3.1 Environment of the sample
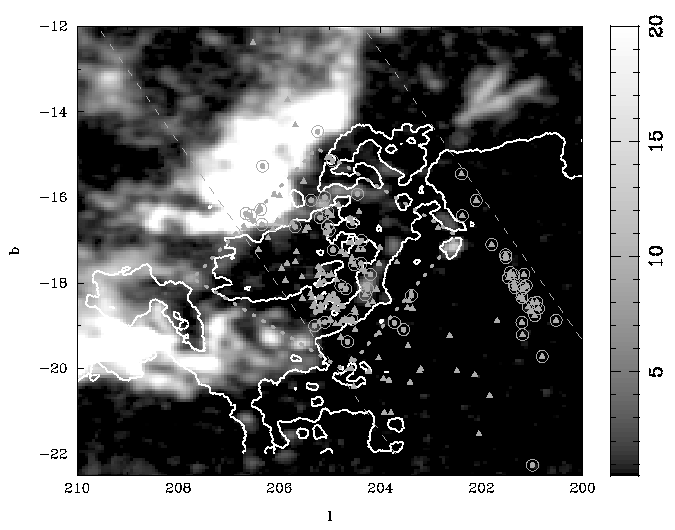
The galactic coordinates of stars in the photometric sample are plotted in Figure 1 compared to the entire sample in Paper I. The stars are projected against the map of integrated 13CO emissivity from Bally et al. (1987). It can be seen that our sample is representative of that in Paper I. It includes the CTTS and a number of WTTS in the “clump” at (,) in Ori OB1a. It also includes a number of CTTS in Ori OB1b, located mostly in the inside of the molecular ring of higher extinction (cf. Paper I). Some of these stars are probably associated with NGC 2023 and NGC 2024. Here we adopt the boundaries of Ori OB1b from Paper I, shown in Figure 1. However, there is some uncertainty in the actual membership of stars located near the assumed boundary between Ori OB1a and 1b at , to . In addition, with the adopted boundaries, 2 stars of the sample fall in Ori OB1c, in the region of high molecular gas density; however, they are so close to the uncertain boundary that we include them in Ori OB1b for the rest of the analysis.
3.2 Stellar Properties
We took the spectral types of the sample stars from Paper I and recalculate here stellar properties from the simultaneous multiwavelength photometry to minimize effects of variability. We used the average distances of 330 pc for Ori OB1a and 440 for Ori OB1b, as discussed in Paper I. The extinctions in Table 3 are calculated from the color, using the Cardelli, Clayton, & Mathis (1989) extinction law with = 3.1. The mean extinctions for 1a, 1b, 1c, and the entire sample are 0.5, 0.6, 2, and 0.6, respectively. Using individual extinctions, we recalculated stellar luminosities and radii . Location in the HR diagram and comparison with the Siess et al. (2000) tracks yielded stellar masses and ages. These quantities, shown in Table 3, in general agree within 50% with those of Paper I.
3.3 Color-color diagrams
Figures 2 and 3 show photometry from Table 1 plotted in the vs. and vs. diagrams, as well as the location of the main sequence colors taken from Kenyon & Hartmann (1995, KH95). CTTS and WTTS are shown separately, and the CTTS in Ori OB1a are marked. Note that the two observations for stars CVSO 35, 146, and 190 are plotted as different points.
The WTTS in the sample are consistent with main sequence colors, reddened by 0.5-0.6 magnitudes of extinction, as expected from the average of the sample. The CTTS have similar as the WTTS, but show large excesses relative to the WTTS in and . These excesses are expected to arise from emission of the accretion shock formed as material accreting from the disk strikes the stellar surface (Hartigan et al. 1991; Hartigan, Edwards, & Ghandour 1995; Calvet & Gullbring 1998).
In Figures 2 and 3 we also plot a sample of stars in Taurus taken from KH95, equally separated in WTTS and CTTS. The age of the Taurus association has been analyzed in detail by Hartmann (2003), who showed that most of the stars have ages of 1 - 2 Myr. With the ages for the subassociations found in Paper I, i.e. 3 - 5 Myr for Ori OB1b and 7 - 10 Myr for OB1a, the Taurus population is younger than Ori OB1b by 2 - 3 Myr, and than Ori OB1a by 6 - 8 Myr, so it provides an initial reference point to study evolutionary effects.
The Orion OB1 and Taurus stars encompass a similar range of in Figures 2 and 3, indicating that we are probing the same range of stellar masses. The samples of Ori OB1b and Taurus show a similar range in and excesses relative to photospheric colors; the lowest excesses correspond to stars in Ori OB1a, some of them compatible with measurements for the WTTS.
In Figure 4 we show the Ori OB1 sample in the vs. diagram, indicating the standard main sequence colors with values from KH95. We have used the transformations from Carpenter (2001) to convert the 2MASS colors to the CIT system. A sample of Taurus stars, with colors from KH95 is also shown. It is apparent that the excesses in relative to photospheric colors in Ori OB1b are smaller than those found in the Taurus sample. Moreover, the excesses in in Ori OB1a, the oldest of the three populations shown, are even smaller than in Ori OB1b.
This effect is more apparent in the vs. diagram, shown in Figure 5, using the colors of the CTTS in Ori OB1 in Table 1. We use here for the Orion OB1 stars. Colors for the Taurus stars and for the main sequence are from KH95. The color excesses in relative to the main sequence in the Ori OB1 stars are clearly smaller than those in Taurus.
Finally, we locate the 6 stars observed with GEMINI/OSCIR in the vs. diagram in Figure 6, and compare it to the Taurus sample. The Ori OB1 stars are located at the low end of the Taurus CTTS distribution, and even tend to populate the clear gap between CTTS and TTS noticed by KH95 (the three Taurus stars inside the gap are binaries, KH95).
These comparisons clearly indicate a decrease of IR emission at m with age. A significant decrease of and with with age is also found in a sample of clusters and groupings by Hillenbrand, Carpenter, & Meyer (2004, in preparation); Sicilia-Aguilar et al. (2004, in preparation) observe a similar near-IR flux deficit relative to Taurus in Spitzer/IRAC colors of the 5 Myr cluster Tr 37. IR emission at m arises in the inner disks in T Tauri stars, few AU, which are sufficiently hot to produce such emission (Meyer et al. 1997; D’Alessio et al. 1998; 1999; 2001). Thus, the observed decrease of fluxes with age must be related to physical phenomena occurring in these inner regions of the disks as a result of disk evolution. We will explore possible implications of these results in §4.
3.4 Spectral energy distributions
Analyses of color-color diagrams in §3.3 indicate a clear difference between emission of the disks in Ori OB1 and in Taurus; disks in the Orion OB1 stars emit less flux at near-infrared wavelengths than typical disks in Taurus. The comparison is seen clearly in Figure 7, where we plot the spectral energy distributions (SEDs) of the stars observed with Gemini OSCIR, including the measurement and upper limits at 18 m from Table 2. Optical and near-IR fluxes have been calculated from magnitudes in Table 1 and corrected for reddening in Table 3. These SEDs are compared with the median SED of CTTS in Taurus (D’Alessio et al. 2001), scaled to the flux at of each star. The error bars in the median show the first quartiles of the distribution (i.e., 50% of the Taurus stars fall within the error bars).
The SEDs of the Orion stars show excesses relative to the photosphere, consistent with the fact that the sample observed with Gemini was selected on the basis of being bright at and have large excesses. However, even with this selection bias, the Ori OB1 disks are fainter than 50 - 75 % of the Taurus sample in the mid-IR.
3.5 Mass accretion rates
We interpret the excesses in and relative to photospheric fluxes in the CTTS in Ori OB1a and 1b as due to emission from the accretion shock on the stellar surface (Hartigan et al. 1991; Hartigan, Edwards, & Ghandour 1995; Gullbring et al. 1998; Calvet & Gullbring 1998). In the framework of this interpretation, the excess luminosity above photospheric colors is a measure of the accretion luminosity released as matter falls from the disk onto the star, following the magnetic field lines that disrupt the disk (cf. Hartmann 1988). We used the de-reddened photometry and spectral types to obtain the excess luminosity in U above the intrinsic photospheric fluxes, ; this luminosity was used to estimate the accretion luminosity , using the calibration of Gullbring et al. (1998). These estimates are listed in Table 3. The largest uncertainty in the determination of , and thus , comes from uncertainties in the determination of the extinction , and it amounts to %.
Using , (assuming a radius of for the magnetospheric radius; Calvet & Gullbring 1998), with the mass and radius determined from the location in the HR diagram, we can infer the mass accretion rate of the objects. These rates are listed in Table 3. In addition to the uncertainties in , the formal uncertainty in includes errors in radius and mass, which are of order 15-20%; thus, the mass accretion rates are constrained within a factor of 2. Given the uncertainties in the original calibration between and , this uncertainty can be a factor of 2 larger (Gullbring et al. 1998). As the errors are uncorrelated, the total error amounts to a factor of 3.
In Figure 8 we show histograms with the number of objects per bin of log , each of size 0.5, for the three populations, Ori OB1a at the top, 1b at the middle, and Taurus at the bottom. The mass accretion rates in Taurus are taken from Gullbring et al. (1998) and Hartmann et al. (1998). These measurements of were obtained from using masses estimated with the D’Antona & Mazitelli (1994) evolutionary tracks; we have recalculated them using masses for the Taurus stars estimated with the Siess et al. (2000) evolutionary tracks, for consistency with the work presented here. The actual values of in bins with are highly uncertain. At these levels, emission due to stellar surface activity becomes an important or dominant contributor to the U excess, as comparison with the WTTS in the sample shows. In these cases, the determined values are upper limits to the true s.
The age of the three populations shown increases from bottom to top. In all three cases, there is a large spread in the ranges of values of . However, as time proceeds, the number of rapid accretors decreases, only the low accretors remain in 1a. One “continuum” star is found in Ori OB1b (see Table 3); we did not have enough spectral resolution to distinguish spectral features and thus determine its spectral type and derived properties. This continuum star does not appear in Figure 8; if its properties were similar to those of continuum stars in Taurus, then it could have few (Gullbring et al. 1998; Calvet & Gullbring 1998; Gullbring et al. 2000). However, even including this star, the relative number of rapid accretors in Ori OB1b would be smaller than in Taurus.
We compared the distributions of log in the three regions using a two-sided KS test. The results indicated that the probability that the Ori OB1b and Taurus samples are drawn from the same underlying distribution is only 3%; the same is true for Ori OB1b vs. Ori OB1a. For a further test, we have added the continuum star in Ori OB1b to the distribution, assuming a a mass accretion rate of ; even in this case, the probability that the Ori OB1b sample is drawn from the same distribution as Taurus is only marginally larger, 9%. Thus we conclude that the distributions of accretion rates are significantly different between the three regions.
Figure 9 plot the derived mass accretion rates and ages on CTTS in Ori OB1a and 1b in Table 3. We also plot in Figure 9 similar data for Taurus, Ophiucus and Chameleon (Hartmann et al. 1998), and the TW Hya association (TWA, Muzerolle et al. 2000, 2002). All masses and mass accretion rates of these latter objects have been re-calibrated using the Siess et al. (2000) evolutionary tracks. The mass accretion rates of the disks in Ori OB1 are consistent with those in other associations, and show a clear decrease with age. The star CVSO 41 in Ori OB1a has an apparent age of 88 Myr (Table 3) and still shows a fairly high value of . The spectral type of this star is K2, so it could have a large age uncertainty. It is known that pre-main-sequence stars in this spectral type range tend to have higher apparent ages than cooler objects (Hillenbrand 1997); this behavior has been attributed to uncertainties in the birthline location (Hartmann 2003).
The solid line in Figure 9 shows the decay of with time expected from viscous evolution for a disk with initial mass and viscous parameter , from Hartmann et al. (1998). The new values of help confirm a decrease of with age qualitatively consistent with viscous disk evolution. However, viscous evolution cannot explain the decreasing fraction of accreting objects with age (Muzerolle et al. 2000; Briceño et al. 2004); other factors (i.e., inner disk clearing associated with planet formation, Calvet et al. 2002; Rice et al. 2003; D’Alessio et al. 2004) must play a role in slowing accretion onto the central star.
4 Discussion
In our comparison of disk properties in three populations with ages 1-2 Myr (Taurus), 3-5 Myr (Ori OB1b), and 7-10 Myr (Ori OB1a), we have found a clear decrease of disk emission with age. This decrease is apparent at all wavelengths with expected substantial disk contribution to the emission, from to 18m.
The disk emission in the IR depends on the temperature of the dust. The two main heating mechanisms active on disks around young stars are viscous dissipation and stellar irradiation (Kenyon & Hartmann 1987, KH87; D’Alessio et al. 1998, 1999, 2001, D01). Viscous dissipation depends on the mass accretion rate throughout the disk; for the range of stellar parameters of stars in Ori OB1, and for , which characterize these stars (§3.5), viscous heating is important only near the midplane of the innermost disk, 1 AU (D’Alessio et al. 1999, 2001). Thus, absorption of stellar radiation by dust in the disks around the Ori OB1 stars mostly determines their temperature and emission.
One important development in recent years is the recognition that the near-IR fluxes in accretion disks around pre-main sequence stars are dominated by emission from a sharp transition between dust and gas at the dust destruction radius. At this transition, the optically thick dust disk is high enough to form a “wall”, which is frontally illuminated by the star. Opacities in the inner gas disk are due to molecules and are much lower than the dust opacities for typically low mas accretion rates; thus, the gas disk is optically thin, enabling frontal illumination of the wall (Muzerolle et al. 2004). The existence of this wall was proposed for Herbig Ae/Be stars (Natta et al. 2001; Tuthill, Monnier & Danchi 2001; Dullemond, Dominik, & Natta et al. 2001) to explain the peculiar “bump” at m observed in the SEDs of these stars (Hillenbrand et al. 1992). Interferometric measurements of inner disk structures in Herbig Ae/Be stars confirmed this prediction (Millan-Gabet et al. 1999; Monnier & Millan-Gabet 2002). A similar wall emission was then reported in the low mass CTTS by Muzerolle et al. (2003). In contrast to their higher mass counterparts, CTTS can have accretion luminosities of the same order as the stellar luminosities, thus increasing the total energy output and moving outwards the disk location where the temperature is equal to the dust destruction temperature for objects with high values of . The rapid accretors are therefore expected to have the wall located at larger radius than objects with low , increasing the total emitting area of the wall and thus the near-IR excess (Muzerolle et al. 2003; D’Alessio et al. 2003). This prediction has been confirmed by the Keck interferometer measurement of an inner structure at the expected location of the dust destruction radius in a high accretion CTTS (Colavita et al. 2003; D’Alessio et al. 2003).
According to this model, the near-IR excess depends on the strength of the wall emission relative to photospheric fluxes. This emission is approximately that of a black-body at the dust destruction temperature, 1400K (Muzerolle et al. 2003), times the solid angle subtended by the wall. This solid angle is essentially that of a cylinder of given height, and radius equal to the dust destruction radius, with an inclination dependence which makes the emission maximum at intermediate lines of sight (60∘ - 80∘) where the wall has maximum exposure (Dullemond et al. 2001; D’Alessio et al. 2003). The dust destruction radius is essentially (D’Alessio et al. 2003). The height of the wall is estimated as the height where the radial optical depth from the star becomes 1 (see Muzerolle et al. 2004).
We can examine the decrease of near-IR excesses with age in terms of these ideas. As they age, pre-main sequence low mass stars move down along Hayashi tracks essentially at constant while decreasing in luminosity. As decreases, becomes much smaller than , so the dust destruction radius becomes fixed relative to the stellar radius, const. If the height of the wall is a fixed multiple of the disk scale height at , which in turn is typically , then the emitting area of the wall, , and thus its total energy output, would decrease in the same proportion as the stellar output, namely . In this case, no decrease of near-IR excess relative to the photosphere with time would be expected. Since const, the most natural way to explain the observed decrease is that the height of the wall decreases with time. For this to happen, the opacity at the upper levels of the wall has to decrease, which implies that dust grains at the top of the wall significantly grow and/or settle towards the midplane as age increases.
Grain growth and/or settling towards the midplane in the disk regions outside the wall also result in low mid-IR fluxes. The disk is heated by stellar + accretion energy captured at the disk surface. Thus, heating of the disk depends on the shape of this surface; the more “flared” the surface is, the more energy it can capture (Kenyon & Hartmann 1987, KH87); disks with highly flared surfaces are hotter and thus emit more. To be more specific, the height of the surface at a given radius is given by the condition that the radial optical Since the density decreases with vertical height above the midplane, decreases as the opacity of the dust in the upper layers decreases. Small grains have high opacity at wavelengths characteristic of the stellar radiation, in the optical and near-IR. They produce a highly flared surface, which results in high energy capture, and hot and bright disks. In contrast, large grains have low opacity at short wavelengths. They produce flatter surfaces, which result in less energy capture and cooler and fainter disks (D’Alessio et al. 2001, D01).
Alternatively, the opacity at upper layers may be reduced because grains are settling to the midplane. This also results in flatter surfaces and fainter disks in the infrared (Dullemond & Dominik 2004; D’Alessio et al. 2004, in preparation). Both growth and settling are expected to occur together. Dust particles, affected by gas drag, collide and stick together; as the particles grow, they settle towards the midplane, falling under the effect of gravity (Weidenschilling & Cuzzi 1993; Weidenschilling 1997). These theories have many unknown parameters, and so far predict time scales for complete settling 1 Myr; however, the timescales depend upon the magnitude of turbulence in disks, which could retard or prevent settling.
A number of claims of grain growth in disks have been made over the years, starting with the interpretation of slopes of the fluxes in the millimeter, which are expected to become flatter as the grain size increases (Beckwith & Sargent 1991). Assuming a dust mixture and a dust size distribution of the form between minimum and maximum sizes and , D01 find that a much better fit to the median SED of Taurus can be achieved with dust particle growth to a maximum size of 1 mm (=3.5) than with interstellar grains, with m. Grain growth and settling has been claimed to explain the SEDs of some CTTS in Taurus. One well studied case is that of the CTTS LkCa 15, which has a SED much flatter than the Taurus median in the IR and high emission at submillimeter and millimeter wavelengths (Qi et al. 2003); the interpretation of this SED requires significant grain growth and settling (Chiang et al. 2001; D’Alessio et al. 2003, 2004; Bergin et al. 2004). In Figures 2, 3, 4, 5, and 6 we have marked the location of LkCa 15; disks in Ori OB1 have similar colors to those of LkCa 15 in all bands, suggesting that significant dust evolution has also taken place in these older disks. In Figure 10 we compare the SED of CVSO 109, the only object for which we have detections up to 18m, to fluxes for LkCa 15 from KH95 and to the Taurus median, both scaled at the of CVSO 109. Note that LkCa 15 is a K5 star (KH95), so it is brighter in the optical than CVSO 109, which is an M0 (Table 3). The SEDs of LkCa 15 and CVSO 109 are significantly lower than the Taurus median, although the flux deficit is much larger in CVSO 109.
To try to quantify the degree of dust evolution in CVSO 109, we have calculated models with uniformly distributed gas and dust following the procedures of D01. We have used stellar and accretion parameters from Table 3, and have varied the parameters and which characterize the dust size distribution. Figure 10 shows our best model. To fit the observed fluxes, we require = 10 cm; this is higher than the maximum sizes required to explain the median SED in Taurus, 1 mm (D01), or the SED of the 10 Myr old star TW Hya, 1 cm (Calvet et al. 2002; Wilner et al. 2004). Moreover, we require , a value consistent with significant dust coagulation (Miyake & Nakagawa 1995); modeling of CTTS disks can generally be carried out successfully with the assumption of 3.5, a value characteristic of the interstellar medium (cf. D01, Chiang et al. 2001).
Our modeling is only indicative, in that we have assumed that the dust is uniformly distributed with the gas. Even with this assumption, our comparison implies that the disk of CVSO 109 is essentially a flat disk, with little if any flaring. Thus, our modeling indicates that the dust in the disk of CVSO 109 has strongly settled towards the midplane, as expected from theories of dust evolution in protoplanetary disks (Weidenschilling 1997). Models including settling in addition to observations at longer wavelengths are required to actually constrain the size distribution of the solids in the midplane.
A possible alternative to consider is that disks in Ori OB1 are smaller than their Taurus counterparts because their outer parts have been photoevaporated by the external ionizing fields of the high mass stars in the associations. A smaller disk would have less emission at long wavelengths since the low temperature regions would be removed. Models for the viscous evolution of disks subject to the effects of photoevaporating radiation fields from the accretion flows and external radiation fields have been calculated by Clarke, Gendrin, & Sotomayor (2001) and Matsuyama, Johnston & Hartmann (2003). Since the distance from the ionizing stars are of the order of a few pc in OB associations, FUV external photons are expected to dominate over EUV photons in the photoevaporation of disks (Johnstone et al. 1998). For this case, Matsuyama et al. (2003) find that that the outer portions of the disk could be removed on time scales which range from 1 to several Myr, depending on the viscosity parameter. After significant photoevaporation, the disk edge is fixed by the FUV gravitational radius, which for parameters as those of the Ori OB1b stellar sample is 30 AU. To determine the effects of a reduction of disk radius on the SED, and in particular to see if a smaller disk radius can explain the low mid-infrared fluxes without extreme grain growth, we have calculated disk models with = 1 mm and = 3.5, characteristic of the Taurus population, for disk radii 100 AU, 50 AU, and 10 AU. These SEDs are shown in Figure 11. Models are calculated at a high inclination to the line of sight () to maximize the contrast between the star and the disk. Even small disks produce too much long wavelength flux compared to the the observations, if = 1 mm as in Taurus. This implies again that the disk has to be essentially flat, which require that grains grow to larger sizes and/or have settled.
5 Summary and conclusions
We have detected clear signatures of disk evolution in samples of accreting stars in the Ori OB1a and 1b associations, with ages 7 - 10 Myr and 3 - 5 Myr, respectively. The mass accretion rates of these stars are consistent with viscous evolution of accretion disks. In addition, we find a significant overall decrease of infrared emission with age. Comparison with disk models indicates that grain growth and settling, processes expected from dust evolution, are responsible for this decrease. Future observations of larger samples of Ori OB1 stars with SPITZER will provide more detail on the nature of the dust evolution process.
Acknowledgments. We thank the referee for many useful suggestions. This work was supported by NSF grant AST-9987367 and NASA grant NAG5-10545. PD acknowledges grants from PAPIIT, DGAPA (UNAM) and CONACyT, México. This research makes use of data products from the Two Micron All Sky Survey, which is a joint project of the University of Massachusetts and the Infrared Processing and Analysis Center/California Institute of Technology, funded by the National Aeronautics and Space Administration and the National Science Foundation. This paper is based on observations obtained with the mid-infrared camera OSCIR, developed by the University of Florida with support from the National Aeronautics and Space Administration, and operated jointly by Gemini and the University of Florida Infrared Astrophysics Group. This research has made use of the SIMBAD database, operated at CDS, Strasbourg, France.
References
- Alibert, Mordasini, & Benz (2004) Alibert, Y., Mordasini, C., & Benz, W. 2004, A&A, 417, L25
- Bally, Stark, Wilson, & Langer (1987) Bally, J., Stark, A. A., Wilson, R. W., & Langer, W. D. 1987, ApJ, 312, L45
- Barden & Armandroff (1995) Barden, S. & Armandroff, T., 1995: Hydra/WIYN users manual.
- Beckwith & Sargent (1991) Beckwith, S. V. W. & Sargent, A. I. 1991, ApJ, 381, 250 Bergin, E. and 12 coauthors, 2004, ApJL, submitted.
- Blaauw (1964) Blaauw, A. 1964, ARA&A, 2, 213
- Briceño et al. (2001) Briceño, C. and 10 coauthors, 2001, Sci, 291, 93
- Briceño et al. (2004) Briceño, C., Calvet, N., Hernandez, J., Vivas, A.K., Hartmann, L., Downes, J.J., & Berlin, P. 2004, AJ, submitted (Paper I)
- Brown et al. (1994) Brown, A.G.A., de Geus, E.J., & de Zeeuw, P.T. 1994, AA, 289, 101
- Calvet & Gullbring (1998) Calvet, N. & Gullbring, E., 1998, ApJ, 509,802
- Calvet et al. (2002) Calvet, N., D’Alessio, P., Hartmann, L., Wilner, D., Walsh, A. & Sitko, M., 2002, ApJ, 568, 1008
- Cardelli et al. (1989) Cardelli,J.A., Clayton, G. C., Mathis, J.S. 1989, ApJ, 345, 24 5
- Carpenter (2001) Carpenter, J. M. 2001, AJ, 121, 2851
- Chiang et al. (2001) Chiang, E. I., Joung, M. K., Creech-Eakman, M. J., Qi, C., Kessler, J. E., Blake, G. A., & van Dishoeck, E. F. 2001, ApJ, 547, 1077
- Clarke, Gendrin, & Sotomayor (2001) Clarke, C. J., Gendrin, A., & Sotomayor, M. 2001, MNRAS, 328, 485
- Cohen et al. (1999) Cohen, M., Walker, R. G., Carter, B., Hammersley, P., Kidger, M., & Noguchi, K. 1999, AJ, 117, 1864
- Colavita et al. (2003) Colavita, M., et al. 2003, ApJ, 592, L83 D’Alessio, P. and 13 coauthors, 2004, ApJ, submitted
- D’Alessio, Calvet, & Hartmann (2001) D’Alessio, P., Calvet, N., & Hartmann, L. 2001, ApJ, 553, 321, D01
- D’Alessio et al. (1999) D’Alessio, P., Calvet, N., Hartmann, L., Lizano, S., & Cantó, J. 1999, ApJ, 527, 893
- D’Alessio, Canto, Calvet, & Lizano (1998) D’Alessio, P., Canto, J., Calvet, N., & Lizano, S. 1998, ApJ, 500, 411
- D’Antona & Mazzitelli (1994) D’Antona, F. & Mazzitelli, I. 1994, ApJS, 90, 467
- Dolan & Mathieu (2002) Dolan, C. J. & Mathieu, R. D. 2002, AJ, 123, 387
- Dolan & Mathieu (2001) Dolan, C. J. & Mathieu, R. D. 2001, AJ, 121, 2124
- Dolan & Mathieu (1999) Dolan, C. J. & Mathieu, R. D. 1999, AJ, 118, 2409
- Dullemond, Dominik, & Natta (2001) Dullemond, C. P., Dominik, C., & Natta, A. 2001, ApJ, 560, 957
- Elias et al. (1982) Elias, J.H., Frogel, J.A., Matthews, K. & Neugebauer, G. 1982, AJ, 87, 1893
- de Zeeuw et al. (1999) de Zeeuw, P. T., Hoogerwerf, R., de Bruijne, J. H. J., Brown, A. G. A., & Blaauw, A. 1999, AJ, 117, 354
- Fabricant et al. (1998) Fabricant, D., Cheimets, P., Caldwell, N. & Geary, J., 1998, PASP, 110, 79
- Gullbring et al. (1998) Gullbring, E., Hartmann, L., Briceño, C., Calvet, N., 1998, ApJ 492, 323
- Gullbring, Calvet, Muzerolle, & Hartmann (2000) Gullbring, E., Calvet, N., Muzerolle, J., & Hartmann, L. 2000, ApJ, 544, 927
- Hartigan, Edwards, & Ghandour (1995) Hartigan, P., Edwards, S., & Ghandour, L. 1995, ApJ, 452, 736
- Hartigan et al. (1991) Hartigan, P., Kenyon, S. J., Hartmann, L., Strom, S. E., Edwards, S., Welty, A. D., & Stauffer, J. 1991, ApJ, 382, 617
- Hartmann (1998) Hartmann, L.: Accretion Processes in Star Formation, Cambridge University Press, 1998.
- Hartmann et al. (1998) Hartmann, L., Calvet, N., Gullbring, E. & D’Alessio, P, 1998, AJ, 495, 385
- Hartmann (2003) Hartmann, L., 2003, ApJ, 585, 398
- Hillenbrand, Strom, Vrba, & Keene (1992) Hillenbrand, L. A., Strom, S. E., Vrba, F. J., & Keene, J. 1992, ApJ, 397, 613
- Hillenbrand (1997) Hillenbrand, L.A., 1997, AJ, 113, 5
- Johnstone, Hollenbach, & Bally (1998) Johnstone, D., Hollenbach, D., & Bally, J. 1998, ApJ, 499, 758
- Kenyon & Hartmann (1987) Kenyon, S. J. & Hartmann, L. 1987, ApJ, 323, 714
- Kenyon & Hartmann (1995) Kenyon, S.J. & Hartmann, L., 1995, ApJS , 101, 117
- Landolt (1992) Landolt, A.U., 1992, AJ104, 1
- Matsuyama, Johnstone, & Hartmann (2003) Matsuyama, I., Johnstone, D., & Hartmann, L. 2003, ApJ, 582, 893
- Meyer et al. (1997) Meyer, M., Calvet, N., Hillenbrand, L.A., 1997, AJ, 114, 288
- Millan-Gabet et al. (1999) Millan-Gabet, R., Schloerb, F. P., Traub, W. A., Malbet, F., Berger, J. P., & Bregman, J. D. 1999, ApJ, 513, L131
- Miyake & Nakagawa (1995) Miyake, K., & Nakagawa, Y. 1995, ApJ, 441, 361
- Monnier & Millan-Gabet (2002) Monnier, J. D. & Millan-Gabet, R. 2002, ApJ, 579, 694
- Muzerolle et al. (2000) Muzerolle, J., Calvet, N., Briceño, C., Hartmann, L. & Hillenbrand, L., 2000, ApJ, 535, L47
- Muzerolle et al. (2001) Muzerolle, J., Hillenbrand, L., Calvet, N., Hartmann, L., & Briceño, C. 2001, ASP Conf. Ser. 244: Young Stars Near Earth: Progress and Prospects, 245
- Muzerolle et al. (2004) Muzerolle, J., D’Alessio, P., Calvet, N., & Hartmann 2004, ApJ, in press.
- Natta et al. (2001) Natta, A., Prusti, T., Neri, R., Wooden, D., Grinin, V. P., & Mannings, V. 2001, A&A, 371, 186
- Podosek & Cassen (1994) Podosek, F.A. & Cassen, P., 1994, Meteoritics 29, 6-25
- Pollack et al. (1996) Pollack, J., Hubickyj, O., Bodenheimer, P., Lissauer, J., Podolak, M. & Greenzweig, Y., 1996, Icarus 124,62
- Qi et al. (2003) Qi, C., Kessler, J. E., Koerner, D. W., Sargent, A. I., & Blake, G. A. 2003, ApJ, 597, 986
- Rice et al. (2003) Rice, W. K. M., Wood, K., Armitage, P. J., Whitney, B. A., & Bjorkman, J. E. 2003, MNRAS, 342, 79
- Schlegel, Finkbeiner, & Davis (1998) Schlegel, D. J., Finkbeiner, D. P., & Davis, M. 1998, ApJ, 500, 525
- Siess et al. (2000) Siess, L., Dufour, E. & Forestini, M. 2000 A&A , 358,593S
- Tollestrup & Willner (1998) Tollestrup, E. V. & Willner, S. P. 1998, Proc. SPIE, 3354, 502
- Tuthill, Monnier, & Danchi (2001) Tuthill, P. G., Monnier, J. D., & Danchi, W. C. 2001, Nature, 409, 1012
- Warren & Hesser (1977) Warren, W.H., & Hesser, J.E. 1977, ApJS, 34, 115
- Warren & Hesser (1978) Warren, W.H., & Hesser, J.E. 1978, ApJS, 36, 497
- Weidenschilling (1977) Weidenschilling, S.J., 1977, MNRAS, 180, 57
- Weidenschilling & Cuzzi (1993) Weidenschilling, S.J. & Cuzzi, J.N., 1993, Protostars and Planets III, 1031
- Wilner, Ho, Kastner, & Rodríguez (2000) Wilner, D. J., Ho, P. T. P., Kastner, J. H., & Rodríguez, L. F. 2000, ApJ, 534, L101
- Wood (2004) Wood, J. 2004. in The Search for Other Worlds (Eds. S. S. Holt, D. Deming), 14th Annual October Astrophysics Conference in Maryland (Oct. 13-14 2003, College Park MD), preprint at http://cfa-www.harvard.edu/ jwood/
| CVSO | V | B-V | U-V | V-R | V-I | J | J-H | H-Ks | L |
|---|---|---|---|---|---|---|---|---|---|
| 1 | 17.12 | 1.36 | -0.36 | 1.26 | 2.81 | 12.82 | 0.68 | 0.25 | |
| 3 | 16.31 | 1.47 | 0.99 | 1.06 | 2.25 | 12.69 | 0.67 | 0.26 | |
| 5 | 16.09 | 1.48 | 0.81 | 1.08 | 2.23 | 12.50 | 0.68 | 0.22 | |
| 10 | 15.41 | 1.42 | 1.27 | 0.93 | 1.91 | 12.31 | 0.68 | 0.24 | |
| 11 | 15.74 | 1.53 | 0.96 | 1.08 | 2.33 | 12.10 | 0.66 | 0.23 | |
| 15 | 15.95 | 1.44 | 0.46 | 0.90 | 2.12 | 12.57 | 0.74 | 0.19 | |
| 17 | 16.16 | 1.51 | 1.07 | 2.34 | 12.52 | 0.72 | 0.20 | ||
| 19 | 15.89 | 1.49 | 1.54 | 1.14 | 2.51 | 11.92 | 0.69 | 0.21 | |
| 22 | 16.33 | 1.51 | 0.86 | 1.06 | 2.29 | 12.70 | 0.66 | 0.22 | |
| 24 | 16.31 | 1.49 | 1.06 | 2.25 | 12.79 | 0.72 | 0.14 | ||
| 25 | 15.46 | 1.42 | 0.95 | 1.91 | 12.42 | 0.69 | 0.15 | ||
| 29 | 16.25 | 1.51 | 1.14 | 2.53 | 12.38 | 0.67 | 0.24 | ||
| 34 | 15.15 | 1.36 | 1.16 | 0.96 | 1.97 | 12.28 | 0.99 | 0.23 | |
| 34 | 15.15 | 1.36 | 1.16 | 0.96 | 1.97 | 12.72 | 1.34 | 0.23 | |
| 35 | 14.55 | 1.41 | 0.73 | 0.99 | 1.95 | 11.46 | 0.70 | 0.41 | |
| 14.84 | 1.30 | 0.76 | 0.92 | 1.93 | 11.46 | 0.70 | 0.41 | ||
| 36 | 16.07 | 1.45 | 1.09 | 2.35 | 12.38 | 0.69 | 0.21 | ||
| 38 | 16.24 | 1.57 | 0.99 | 1.07 | 2.27 | 12.79 | 0.73 | 0.23 | |
| 38 | 16.37 | 1.26 | 1.12 | 1.07 | 2.46 | 12.79 | 0.73 | 0.23 | |
| 39 | 15.98 | 1.41 | 0.90 | 1.07 | 2.45 | 12.30 | 0.68 | 0.20 | |
| 39 | 16.11 | 1.22 | 0.66 | 1.10 | 2.46 | 12.30 | 0.68 | 0.20 | |
| 40 | 15.23 | 1.35 | 1.07 | 0.90 | 1.81 | 12.36 | 0.72 | 0.26 | |
| 41 | 15.23 | 0.97 | 0.28 | 0.73 | 1.54 | 12.41 | 0.70 | 0.33 | |
| 42 | 15.96 | 1.43 | 1.12 | 1.03 | 2.15 | 12.68 | 0.68 | 0.17 | |
| 43 | 16.27 | 1.42 | 0.98 | 1.09 | 2.46 | 12.50 | 0.74 | 0.16 | |
| 44 | 14.74 | 1.21 | 0.96 | 0.73 | 1.43 | 12.30 | 0.66 | 0.08 | |
| 46 | 15.15 | 1.42 | 0.94 | 1.93 | 12.02 | 0.69 | 0.21 | ||
| 46 | 15.19 | 1.46 | 0.91 | 0.94 | 1.92 | 12.02 | 0.69 | 0.21 | |
| 47 | 15.09 | 1.38 | 1.12 | 0.93 | 1.86 | 11.28 | 0.84 | 0.50 | 9.36 |
| 48 | 14.07 | 1.16 | 0.70 | 0.78 | 1.44 | 11.50 | 0.68 | 0.22 | 10.45 |
| 54 | 15.80 | 1.31 | 1.18 | 0.91 | 1.95 | 12.86 | 0.70 | 0.14 | |
| 55 | 15.60 | 1.43 | 1.16 | 1.06 | 2.27 | 11.93 | 0.69 | 0.24 | |
| 55 | 15.69 | 1.54 | 0.99 | 1.01 | 2.26 | 11.93 | 0.69 | 0.24 | |
| 57 | 15.67 | 0.91 | 1.91 | 12.65 | 0.72 | 0.19 | |||
| 58 | 14.93 | 0.89 | -0.30 | 0.84 | 1.65 | 12.05 | 0.78 | 0.56 | 9.97 |
| 72 | 17.98 | 1.64 | 0.87 | 0.94 | 2.22 | 14.49 | 0.71 | 0.21 | |
| 75 | 16.72 | 0.92 | 0.41 | 0.44 | 1.04 | 13.00 | 0.76 | 0.51 | |
| 77 | 16.37 | 1.42 | 1.07 | 2.26 | 12.81 | 0.72 | 0.23 | ||
| 81 | 16.22 | 1.45 | 0.87 | 1.17 | 2.54 | 12.24 | 0.66 | 0.23 | |
| 90 | 14.61 | 0.38 | -0.97 | 0.65 | 1.40 | 12.13 | 0.91 | 0.67 | 9.73 |
| 104 | 14.22 | 0.79 | -0.08 | 0.66 | 1.44 | 11.78 | 0.75 | 0.58 | |
| 107 | 14.78 | 0.84 | -0.38 | 0.81 | 1.73 | 11.55 | 0.81 | 0.45 | 9.85 |
| 109 | 13.97 | 0.88 | -0.35 | 0.80 | 1.69 | 11.01 | 0.80 | 0.42 | 9.37 |
| 121 | 14.24 | 1.18 | 0.23 | 0.87 | 1.69 | 11.70 | 0.92 | 0.64 | |
| 124 | 15.91 | 1.50 | 0.89 | 1.11 | 2.41 | 12.07 | 0.70 | 0.25 | |
| 126 | 15.82 | 1.44 | 0.99 | 0.92 | 1.85 | 12.85 | 0.71 | 0.17 | |
| 133 | 14.88 | 1.15 | 1.01 | 0.76 | 1.59 | 12.19 | 0.61 | 0.15 | |
| 143 | 15.25 | 1.34 | 0.41 | 1.03 | 2.19 | 11.79 | 0.78 | 0.21 | |
| 146 | 13.92 | 1.19 | 0.14 | 0.84 | 1.63 | 11.30 | 0.86 | 0.42 | 9.65 |
| 14.01 | 1.52 | 11.30 | 0.86 | 0.42 | 9.65 | ||||
| 152 | 13.98 | 1.12 | 0.81 | 0.71 | 1.40 | 11.58 | 0.82 | 0.50 | |
| 153 | 16.00 | 1.43 | -0.64 | 1.07 | 2.29 | 12.44 | 0.72 | 0.23 | |
| 155 | 14.35 | 1.33 | 0.63 | 0.92 | 1.85 | 11.48 | 0.66 | 0.33 | |
| 157 | 17.87 | 0.70 | -0.98 | 1.14 | 2.09 | 14.01 | 0.59 | 0.35 | |
| 164 | 16.71 | 1.55 | 0.30 | 1.31 | 3.03 | 11.80 | 0.69 | 0.32 | |
| 165 | 13.68 | 1.12 | 0.45 | 0.76 | 1.48 | 11.07 | 0.83 | 0.41 | 9.24 |
| 168 | 17.33 | 1.24 | -0.25 | 1.27 | 2.82 | 12.78 | 0.60 | 0.28 | |
| 171 | 14.84 | 1.46 | 0.64 | 0.84 | 1.69 | 11.96 | 0.70 | 0.30 | |
| 176 | 15.65 | 1.21 | -0.35 | 1.14 | 2.46 | 11.71 | 0.91 | 0.50 | 9.84 |
| 177 | 15.62 | 0.71 | 0.96 | 1.92 | 12.30 | 0.77 | 0.33 | 10.98 | |
| 178 | 15.66 | 1.48 | 0.64 | 1.11 | 2.28 | 11.47 | 0.77 | 0.34 | |
| 181 | 15.63 | 1.22 | 0.87 | 2.00 | 12.30 | 0.74 | 0.19 | ||
| 184 | 15.34 | 1.86 | 1.41 | 2.75 | 10.40 | 1.27 | 0.91 | ||
| 185 | 15.28 | 1.61 | 1.08 | 2.18 | 10.88 | 0.88 | 0.49 | 8.77 | |
| 190 | 14.04 | 1.10 | 0.28 | 0.83 | 1.72 | 11.04 | 1.08 | 0.77 | 8.49 |
| 14.76 | 1.89 | 11.04 | 1.08 | 0.77 | 8.49 | ||||
| 192 | 15.99 | 1.26 | -0.14 | 1.17 | 2.37 | 11.56 | 1.01 | 0.55 | 99.00 |
| 193 | 15.15 | 1.29 | 0.04 | 1.15 | 2.29 | 11.34 | 1.22 | 0.66 | 99.00 |
| CVSO | err | [18m] | err[18m] | log | log m) | |
|---|---|---|---|---|---|---|
| log (erg sec-1 cm-2) | log (erg sec-1 cm-2) | |||||
| 47 | 9.418 | 0.081 | 7.627 | 0.383 | -11.779 0.03 | -11.654 |
| 58 | 8.448 | 0.388 | 7.517 | 0.444 | -11.391 0.15 | -11.576 |
| 90 | 8.294 | 0.282 | 9.533 | 2.773 | -11.330 0.12 | -11.792 |
| 107 | 8.109 | 0.276 | 9.092 | 1.866 | -11.256 0.12 | -11.764 |
| 109 | 7.935 | 0.120 | 6.437 | 0.165 | -11.186 0.05 | -11.492 0.1 |
| 165 | 6.921 | 0.093 | 6.983 | 0.279 | -10.781 0.05 | -11.710 |
| CVSO | SpT | Age | Assoc | Type | |||||||
|---|---|---|---|---|---|---|---|---|---|---|---|
| K | Myr | ||||||||||
| 1 | M3 | 3470 | 0.18 | 1.17 | 0.33 | 0.81 | 4.02 | 0.01 | 0.09 | 1a | CTTS |
| 3 | M3 | 3470 | 0.16 | 1.11 | 0.33 | 0.00 | 4.68 | 0.00 | 0.00 | 1a | WTTS |
| 5 | M2 | 3580 | 0.21 | 1.20 | 0.38 | 0.22 | 4.12 | 0.00 | 0.01 | 1a | WTTS |
| 10 | M0 | 3850 | 0.27 | 1.17 | 0.58 | 0.27 | 7.20 | 0.00 | 0.00 | 1a | WTTS |
| 11 | M2 | 3580 | 0.33 | 1.49 | 0.39 | 0.46 | 2.51 | 0.00 | 0.02 | 1a | WTTS |
| 15 | M1 | 3720 | 0.21 | 1.11 | 0.47 | 0.39 | 6.42 | 0.00 | 0.03 | 1a | WTTS |
| 17 | M3 | 3470 | 0.19 | 1.20 | 0.33 | 0.00 | 3.63 | 0.00 | 0.06 | 1a | WTTS |
| 19 | M3 | 3470 | 0.34 | 1.60 | 0.34 | 0.10 | 2.23 | 1a | WTTS | ||
| 22 | M2 | 3580 | 0.18 | 1.12 | 0.38 | 0.36 | 5.18 | 0.00 | 0.01 | 1a | WTTS |
| 24 | M2 | 3580 | 0.17 | 1.06 | 0.38 | 0.27 | 5.97 | 0.00 | 0.01 | 1a | WTTS |
| 25 | M0 | 3850 | 0.24 | 1.11 | 0.58 | 0.27 | 8.09 | 1a | WTTS | ||
| 29 | M2 | 3580 | 0.29 | 1.40 | 0.39 | 0.94 | 2.73 | 1a | WTTS | ||
| 34 | M0 | 3850 | 0.29 | 1.21 | 0.58 | 0.41 | 6.61 | 0.00 | 0.01 | 1a | WTTS |
| 34 | M0 | 3850 | 0.19 | 0.98 | 0.59 | 0.41 | 10.55 | 0.00 | 0.01 | 1a | WTTS |
| 35 | K7 | 4060 | 0.72 | 1.72 | 0.77 | 0.85 | 2.88 | 0.02 | 0.17 | 1a | CTTS |
| K7 | 4060 | 0.71 | 1.70 | 0.77 | 0.80 | 2.90 | 0.02 | 0.13 | 1a | CTTS | |
| 36 | M3 | 3470 | 0.21 | 1.28 | 0.34 | 0.00 | 2.95 | 0.03 | 0.36 | 1a | WTTS |
| 38 | M2 | 3580 | 0.17 | 1.06 | 0.38 | 0.31 | 5.88 | 0.00 | 0.00 | 1a | WTTS |
| 38 | M2 | 3580 | 0.19 | 1.13 | 0.38 | 0.77 | 4.98 | 0.00 | 0.02 | 1a | WTTS |
| 39 | M2 | 3580 | 0.30 | 1.41 | 0.39 | 0.74 | 2.70 | 0.00 | 0.04 | 1a | WTTS |
| 39 | M2 | 3580 | 0.30 | 1.42 | 0.39 | 0.77 | 2.68 | 0.01 | 0.08 | 1a | WTTS |
| 40 | M0 | 3850 | 0.24 | 1.10 | 0.58 | 0.02 | 8.18 | 0.00 | 0.00 | 1a | CTTS |
| 41 | K2 | 4900 | 0.37 | 0.84 | 0.89 | 1.30 | 88.18 | 0.06 | 0.19 | 1a | CTTS |
| 42 | M2 | 3580 | 0.17 | 1.08 | 0.38 | 0.02 | 5.71 | 0.00 | 0.00 | 1a | WTTS |
| 43 | M2 | 3580 | 0.25 | 1.29 | 0.39 | 0.77 | 3.03 | 0.00 | 0.02 | 1a | WTTS |
| 44 | K6 | 4205 | 0.27 | 0.98 | 0.82 | 0.00 | 22.97 | 0.00 | 0.01 | 1a | WTTS |
| 46 | M0 | 3850 | 0.36 | 1.34 | 0.58 | 0.32 | 4.74 | 0.00 | 0.03 | 1a | WTTS |
| 46 | M0 | 3850 | 0.35 | 1.34 | 0.58 | 0.29 | 4.80 | 0.00 | 0.02 | 1a | WTTS |
| 47 | K5 | 4350 | 0.97 | 1.73 | 1.10 | 1.21 | 4.96 | 0.01 | 0.04 | 1a | CTTS |
| 48 | K4 | 4590 | 1.25 | 1.77 | 1.28 | 0.71 | 6.60 | 0.05 | 0.22 | 1b | CTTS |
| 54 | M0 | 3850 | 0.17 | 0.92 | 0.58 | 0.36 | 14.57 | 0.00 | 0.01 | 1a | WTTS |
| 55 | M2 | 3580 | 0.37 | 1.58 | 0.39 | 0.31 | 2.30 | 0.00 | 0.01 | 1a | WTTS |
| 55 | M2 | 3580 | 0.37 | 1.58 | 0.39 | 0.29 | 2.31 | 0.00 | 0.01 | 1a | WTTS |
| 57 | M0 | 3850 | 0.20 | 1.00 | 0.59 | 0.27 | 9.95 | 0.00 | 0.00 | 1a | CTTS |
| 58 | K7 | 4060 | 0.61 | 1.58 | 0.78 | 0.12 | 4.02 | 0.07 | 0.45 | 1b | CTTS |
| 72 | M6 | 3050 | 0.04 | 0.74 | 0.11 | 0.00 | 6.20 | 0.00 | 0.01 | 1b | CTTS |
| 75 | M1 | 3720 | 0.23 | 1.16 | 0.47 | 0.00 | 5.82 | 0.00 | 0.04 | 1b | CTTS |
| 77 | K6 | 4205 | 0.28 | 0.99 | 0.82 | 1.88 | 21.91 | 1a | WTTS | ||
| 81 | M3 | 3470 | 0.45 | 1.86 | 0.34 | 0.17 | 1.76 | 0.00 | 0.02 | 1b | WTTS |
| 90 | K7 | 4060 | 0.55 | 1.50 | 0.79 | 0.00 | 5.04 | 0.29 | 1.77 | 1b | CTTS |
| 104 | K7 | 4060 | 0.76 | 1.76 | 0.77 | 0.00 | 2.76 | 0.10 | 0.75 | 1b | CTTS |
| 107 | K7 | 4060 | 1.02 | 2.04 | 0.77 | 0.32 | 2.12 | 0.13 | 1.09 | 1b | CTTS |
| 109 | M0 | 3850 | 1.48 | 2.73 | 0.56 | 0.00 | 0.80 | 0.16 | 2.52 | 1b | CTTS |
| 121 | K3 | 4730 | 1.31 | 1.70 | 1.32 | 1.49 | 8.06 | 0.40 | 1.67 | 1b | CTTS |
| 124 | M3 | 3470 | 0.51 | 1.97 | 0.34 | 0.00 | 1.58 | 0.00 | 0.02 | 1b | WTTS |
| 126 | M0 | 3850 | 0.16 | 0.89 | 0.58 | 0.12 | 16.16 | 0.00 | 0.00 | 1a | WTTS |
| 133 | K6 | 4205 | 0.32 | 1.06 | 0.84 | 0.27 | 18.14 | 0.00 | 0.01 | 1a | WTTS |
| 143 | M1 | 3720 | 0.82 | 2.18 | 0.47 | 0.55 | 1.16 | 0.02 | 0.37 | 1b | CTTS |
| 146 | K6 | 4205 | 1.32 | 2.17 | 0.91 | 0.37 | 2.01 | 0.11 | 0.81 | 1b | CTTS |
| K6 | 4205 | 1.23 | 2.09 | 0.92 | 0.10 | 2.19 | 0.12 | 0.88 | 1b | CTTS | |
| 152 | K3 | 4730 | 1.21 | 1.64 | 1.30 | 0.78 | 8.65 | 0.03 | 0.14 | 1b | CTTS |
| 153 | M2 | 3580 | 0.23 | 1.26 | 0.39 | 0.36 | 3.43 | 0.02 | 0.16 | 1a | WTTS |
| 155 | K6 | 4205 | 1.30 | 2.14 | 0.91 | 0.90 | 2.06 | 0.07 | 0.53 | 1b | CTTS |
| 157 | C | 1b | CTTS | ||||||||
| 164 | M3 | 3470 | 1.06 | 2.85 | 0.35 | 1.82 | 0.45 | 0.05 | 1.19 | 1b | CTTS |
| 165 | K6 | 4205 | 1.48 | 2.29 | 0.91 | 0.00 | 1.72 | 0.05 | 0.37 | 1b | CTTS |
| 168 | M4 | 3370 | 0.25 | 1.46 | 0.29 | 0.00 | 2.49 | 0.00 | 0.05 | 1b | CTTS |
| 171 | K5 | 4350 | 0.82 | 1.60 | 1.08 | 0.81 | 6.41 | 0.02 | 0.10 | 1b | CTTS |
| 176 | M3 | 3470 | 0.71 | 2.32 | 0.35 | 0.00 | 1.06 | 0.02 | 0.43 | 1b | CTTS |
| 177 | K6 | 4205 | 0.64 | 1.50 | 0.94 | 1.07 | 6.21 | 0.01 | 0.04 | 1b | CTTS |
| 178 | M1 | 3720 | 1.17 | 2.60 | 0.47 | 0.77 | 0.81 | 0.01 | 0.25 | 1b | CTTS |
| 181 | M0 | 3850 | 0.51 | 1.61 | 0.57 | 0.48 | 2.63 | 0.02 | 0.14 | 1b | CTTS |
| 184 | K1 | 5080 | 9.67 | 4.01 | 2.35 | 4.35 | 2.03 | 1b | CTTS | ||
| 185 | K7 | 4060 | 2.54 | 3.22 | 0.81 | 1.40 | 0.79 | 1b | CTTS | ||
| 190 | K6 | 4205 | 1.78 | 2.52 | 0.90 | 0.58 | 1.26 | 0.13 | 1.17 | 1b | CTTS |
| K6 | 4205 | 1.99 | 2.66 | 0.90 | 0.99 | 1.00 | 0.14 | 1.38 | 1b | CTTS | |
| 192 | K6 | 4205 | 1.68 | 2.44 | 0.90 | 2.14 | 1.40 | 0.36 | 3.08 | 1c | CTTS |
| 193 | K6 | 4205 | 1.96 | 2.63 | 0.90 | 1.95 | 1.02 | 0.48 | 4.49 | 1c | CTTS |