Mid-Infrared Selection of Active Galaxies
Abstract
Mid-infrared photometry provides a robust technique for identifying active galaxies. While the ultraviolet to mid-infrared (m) continuum of normal galaxies is dominated by the composite stellar black body curve and peaks at approximately 1.6 m, the ultraviolet to mid-infrared continuum of active galaxies is dominated by a power law. Consequently, with sufficient wavelength baseline, one can easily distinguish AGN from stellar populations. Mirroring the tendency of AGN to be bluer than galaxies in the ultraviolet, where galaxies (and stars) sample the blue, rising portion of stellar spectra, AGN tend to be redder than galaxies in the mid-infrared, where galaxies sample the red, falling portion of the stellar spectra. We report on Spitzer Space Telescope mid-infrared colors, derived from the IRAC Shallow Survey, of nearly 10,000 spectroscopically-identified sources from the AGN and Galaxy Evolution Survey. Based on this spectroscopic sample, we find that simple mid-infrared color criteria provide remarkably robust separation of active galaxies from normal galaxies and Galactic stars, with over 80% completeness and less than 20% contamination. Considering only broad-lined AGN, these mid-infrared color criteria identify over 90% of spectroscopically-identified quasars and Seyfert 1s. Applying these color criteria to the full imaging data set, we discuss the implied surface density of AGN and find evidence for a large population of optically-obscured active galaxies.
1 Introduction
The dominant sources of energy production in the universe are fusion in stars and gravitational accretion onto supermassive black holes. The tight correlation between nuclear black hole mass and bulge mass (e.g., Magorrian et al. 1998; Tremaine et al. 2002) implies the processes are intimately connected. However, identifying an unbiased census of black holes in the universe remains challenging, hampering our ability to fully probe this connection. For example, the spectral index of the X-ray background is significantly harder than the soft X-ray spectrum of bright, unobscured quasars, implying that there exists a large population of heavily-obscured AGN. Identifying the sources responsible for the (hard) X-ray background was one of the primary motivators for the Chandra X-ray Observatory, and Chandra has successfully identified a population of high-redshift, heavily-obscured, luminous type II quasars (e.g., Stern et al. 2002a; Norman et al. 2002) as well as a significant population of apparently-normal galaxies with optical spectra dominated by starlight but hosting significant X-ray emission and implying the presence of an AGN (e.g., Barger et al. 2001; Hornschemeier et al. 2001; Stern et al. 2002b).
We show here that the Spitzer Space Telescope (Werner et al. 2004) also provides a valuable probe of AGN demographics. The obscuring dust which hides AGN from ultraviolet, optical, and soft X-ray surveys should be a strong, largely isotropic emitter in the mid- to far-infrared (m). Furthermore, the different spectral energy distributions (SEDs) of stars and AGN produces different colors for normal and active galaxies in the mid-infrared (m). In particular, the composite black body spectra of the stellar population of normal galaxies produces an SED which peaks at approximately 1.6 m, while quasars have a power-law SED, . One of the early, traditional techniques to identify quasars relied on identifying sources with an ultraviolet excess, targeting sources whose SED does not plummet on the blue side of the stellar peak (e.g., Schmidt & Green 1983). Though fruitful, this technique fails in two cases: (1) obscured quasars will preferentially suffer attenuation of their ultraviolet flux, and (2) high-redshift quasars disappear from the ultraviolet due to absorption from the Ly forest.
By contrast, we seek to exploit the many-fold recent improvement in mid-infrared sensitivity afforded by Spitzer to target sources having SEDs that do not decline on the red side of the stellar peak. This provides an approach to identifying AGN that is relatively insensitive to extinction by dust or gas, and it has been demonstrated with a variety of instrumentation, including the Two Micron All-Sky Survey (Cutri et al. 2001; Glikman et al. 2004), the Infrared Space Observatory (Laurent et al. 2000; Haas et al. 2004), and the First Look Survey by Spitzer (Lacy et al. 2004).
We present here a study of the mid-infrared colors of nearly 700 spectroscopically-confirmed quasars from the 9 deg2 Boötes field of the NOAO Deep Wide-Field Survey (NDWFS; Jannuzi & Dey 1999; Dey et al. 2005; Jannuzi et al. 2005). The mid-infrared colors are from the IRAC Shallow Survey (Eisenhardt et al. 2004), a guaranteed-time program with Spitzer. The spectroscopy comes from the AGN and Galaxy Evolution Survey (AGES; Kochanek et al., in preparation). AGES includes redshifts and spectral classifications for nearly ten thousand normal galaxies and nearly one thousand AGN. Based on this spectroscopic sample, we show that mid-infrared photometry provides a robust technique for identifying AGN. Using empirical color criteria to isolate AGN, we use the entire IRAC Shallow Survey to study the surface density of active galaxies, and evaluate the efficacy of mid-infrared selection of AGN. A coordinated paper discusses the mid-infrared colors of X-ray sources in this field (Gorjian et al. 2005).
Section 2 briefly summarizes the two surveys used. Section 3 describes the mid-infrared properties of the spectroscopically-identified sources, followed by a discussion of mid-infrared selection of AGN in §4. The results are summarized in §5. Unless otherwise noted, all magnitudes refer to the Vega system.
2 Survey Data
2.1 IRAC Shallow Survey
The Infrared Array Camera (IRAC; Fazio et al. 2004) is a four-channel instrument on the Spitzer Space Telescope which provides simultaneous broad-band images at 3.6, 4.5, 5.8 and 8.0 m with unprecedented sensitivity. The IRAC shallow survey, a guaranteed-time observation program of the IRAC instrument team, covers 8.5 deg2 in the NDWFS Boötes field with three or more 30 second exposures per position. Eisenhardt et al. (2004) presents an overview of the survey design, reduction, calibration, and initial results. The survey identifies 270,000, 200,000, 27,000 and 26,000 sources brighter than limits of 12.3, 15.4, 76 and 76 Jy at 3.6, 4.5, 5.8 and 8.0 m, respectively, where throughout IRAC magnitudes were measured in 6″ diameter apertures and corrected to total magnitudes assuming sources are unresolved at the resolution of IRAC (Fazio et al. 2004). The corresponding magnitude limits are 18.4, 17.7, 15.5, and 14.8 mag.
2.2 AGN and Galaxy Evolution Survey (AGES)
AGES (Kochanek et al., in preparation) is a wide-field redshift survey in the NDWFS Boötes field using Hectospec (Fabricant et al. 1998), a new, multi-object fiber spectrograph at the MMT Observatory. For the 2004 observing season, AGES targeted sources from the NDWFS catalog (Jannuzi et al. 2005) with , with priorities based on the multiwavelength photometry available. AGES observed (1) all extended sources with , (2) a randomly-selected 20% of extended sources with , (3) all extended sources with IRAC 3.6, 4.5, 5.8 and 8.0 m magnitudes 15.2, 15.2, 14.7 and 13.2, respectively, and (4) sources with a strong selection bias in favor of counterparts to X-ray sources from Chandra X-ray Observatory imaging of the field (Brand et al. 2005; Murray et al. 2005; Kenter et al. 2005), radio sources from the FIRST survey (Becker, White, & Helfand 1995), and 24 m sources with non-stellar [24] colors, where the 24 m data derives from Spitzer Multiband Imaging Photometer (Rieke et al. 2004) observations of the field (Le Floc’h et al., in preparation). Kochanek et al. (in preparation) provides a more detailed description of the target selection. In particular, point sources (in the -, -, or -band images of NDWFS) were selected against unless they were associated with counterparts to X-ray, radio, or 24 m sources.
We use the version 1.11 AGES catalog, containing all AGES spectra taken in 2004. The redshift catalog, created by N. Caldwell, P. Green, and C. Kochanek, includes 10,452 sources with confident redshifts. Non-stellar spectra were initially assigned to two rough classes: broad-lined AGN and galaxies. While all broad-lined sources correspond to obvious AGN, e.g., quasars and Seyfert 1s (Sy1s), identified galaxies include both normal (i.e., apparently inactive) galaxies and narrow-lined AGN. Fairly conservative emission line diagnostics111Objects fit with the galaxy templates were flagged as AGN if they satisfied one of the following criteria. The first criterion was [NII]6583/H, [OIII]5007/H, and detection of [OI]6300. The second criterion was the detection of [NeV]3426 emission. The first criterion can be used at lower redshifts () while the second criterion can be used at higher redshift (). were then used to distinguish AGN from normal galaxies. The AGES sample with well-determined redshifts is comprised of 9394 optically-inactive galaxies, 733 broad-lined AGN, 118 narrow-lined AGN, and 207 Galactic stars. Most of the stars are F stars, used for spectrophotometric calibration. Matching these sources with the 3.6 m-selected IRAC Shallow Survey catalog by requiring separation between the IRAC mid-infrared source and NDWFS optical source and detections in all four IRAC bands leads to a restricted spectroscopic sample of 4693 sources, comprised of 3959 normal galaxies, 576 broad-lined AGN, 99 narrow-lined AGN, and 59 stars. For some analyses, we only require IRAC 5 detections in the two bluest IRAC bands; the matched catalog for this subsample contains 9432 sources, comprised (as classified by AGES) of 8460 normal galaxies, 696 broad-lined AGN, 104 narrow-lined AGN, and 172 stars.
3 Mid-Infrared Properties of AGN
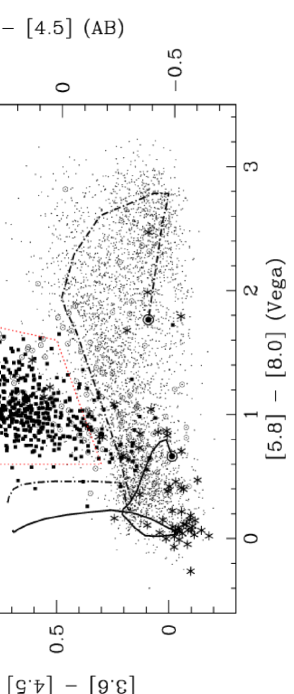
Fig. 1 presents an IRAC color-color diagram for the AGES sample, with symbols denoting spectroscopic classification. Eisenhardt et al. (2004), based solely on photometric data, noted a vertical spur in the versus color-color diagram (see Fig. 5c of that paper) and suggested that it may be associated with AGN since a large fraction of those sources are spatially unresolved at 3.6 m. These spectroscopic results confirm that suggestion: mid-infrared colors clearly separate AGN from both stars and galaxies in the AGES sample. In order to achieve a physical understanding of Fig. 1, we now discuss the mid-infrared properties of stars, galaxies, and AGN.
Galactic stars primarily reside in a restricted locus in mid-infrared color space, corresponding to the Rayleigh-Jeans tail of the blackbody spectrum: stellar photospheres have approximately zero color in the Vega system. The majority of the spectroscopically-confirmed stars in the AGES sample confirm this expectation. The AGES sample also includes several stars which reside far from the stellar locus, showing mid-infrared excesses in the IRAC bands. Such stars likely host cooler circumstellar material in the form of post-asymptotic giant branch shells or circumstellar disks. A more detailed treatment of the Galactic color-space outliers is deferred to a future publication.
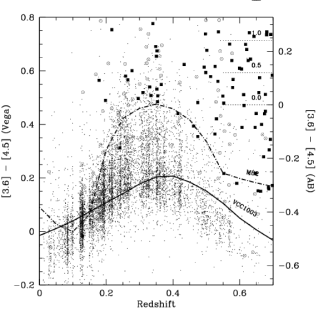
Because of its -band magnitude limit, AGES identifies normal galaxies out to . As seen in Figs. 1 and 2, galaxies at span a relatively modest range in the bluest IRAC color combination, . For reference, we show the color evolution of two galaxy templates from Devriendt, Guiderdoni, & Sadat (1999): M82 is a starburst galaxy with strong polycyclic aromatic hydrocarbon (PAH) features, while VCC1003 (NGC 4429), a Virgo cluster S0/Sa galaxy, is not actively forming stars. As the 3.3 m PAH feature shifts through the IRAC 4.5 m band at , galaxies appear redder in the color combination. At , which lies beyond the redshift range in which AGES is sensitive to normal galaxies, the templates redden once again as the 1.6 m maximum in the photospheric emission from stellar populations shifts from the 3.6 m IRAC band to the 4.5 m IRAC band.
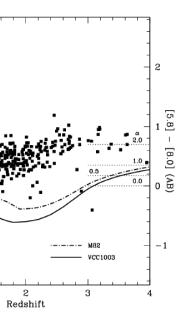
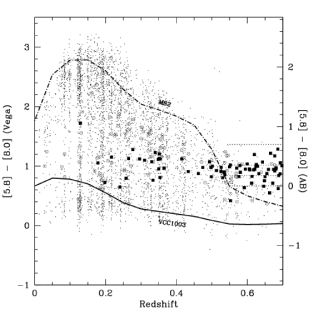
Galaxies at span a large range of color in the reddest IRAC color combination, (Figs. 1 and 3). These extremely red colors are caused by the 6.2 and 7.7 m PAH features in actively star-forming galaxies shifting through the IRAC 8.0 m band. The 6.2 and 7.7 m PAH features are much stronger than the 3.3 m PAH feature, explaining why the observed range of colors for normal galaxies is much more expansive than the observed color range. The 3.3 m PAH feature later causes a modest, broad red bump in galaxy template colors at . At , the 1.6 m bump causes the galaxy templates to redden once again. As seen in Figs. 1 thru 3, the Devriendt et al. (1999) M82 and VCC1003 templates approximately bound the observed range of AGES galaxies in both IRAC colorcolor space and in IRAC colorredshift space. The narrow-lined AGN in the AGES sample appear in both the region of IRAC colorcolor space dominated by galaxies and the region dominated by broad-lined AGN, discussed next; the narrow-lined AGN sample apparently includes sources whose mid-infrared flux can be dominated by either stellar emission or emission associated with a powerful active nucleus.
The isolation of broad-lined AGN in mid-infrared color-color space is the most dramatic feature of Fig. 1. While stars are generally restricted to a single locus of zero color and galaxies define a horizontal swath in Fig. 1, broad-lined AGN create a vertical branch in the diagram. This characteristic property is easily understood. First, the lack of strong PAH emission in powerful AGN restricts their observed colors. Second, since the m flux of AGN is dominated by power-law emission rather than a composite stellar spectrum which peaks at m, the color of AGN is significantly redder than that of low-redshift galaxies. The tendency of AGN to be redder than galaxies in the mid-infrared, where galaxies sample the red, falling side of the composite black-body stellar spectrum, mirrors the tendency of AGN to be bluer than galaxies (and stars) in the ultraviolet, where we are sampling the blue, rising side of the stellar spectrum.
The power-law nature of quasar SEDs is consistent with previous studies at optical wavelengths. Vanden Berk et al. (2001) presents a composite quasar spectrum derived from over 2200 Sloan Digital Sky Survey (SDSS) spectra. Fitting the continuum at rest-frame wavelengths Å with a power law, , Vanden Berk et al. (2001) finds an average spectral slope , comparable to the derived by Pentericci et al. (2003) from a sample of 45 high-redshift SDSS quasars imaged in the near-infrared. IRAC observations of AGN from the AGES survey suggest a modest steepening of the average quasar spectrum at longer wavelengths. Considering the 696 AGES broad-lined AGN with robust () data in the bluest IRAC passbands, the sigma-clipped average color is (Vega), corresponding to a spectra index . Considering the 576 AGES broad-lined AGN with robust photometry in all four IRAC passbands, the sigma-clipped average color is (Vega), corresponding to a spectra index . We note that the reddening of AGN at in observed color and at in observed color is suggestive of the rest-frame 1.6 m stellar bump contributing to the observed mid-infrared flux. Kochanek et al. (in preparation) presents a more detailed treatment of the composite AGES AGN spectrum in the mid-infrared, derived from a principal component analysis of the IRAC photometry.
4 Mid-Infrared Selection of AGN
We adopt the following empirical criteria to separate active galaxies from other sources in the AGES spectroscopic sample described above (shown as a dotted line in Fig. 1):
where is the logical AND operator. The left boundary protects against fainter, higher-redshift galaxies, and is not critical for optically-bright samples such as AGES. The right boundary merely approximates the outer range of AGN colors. Considering Fig. 2, we caution that these color criteria may preferentially omit AGN at and . Out of a total of 681 sources which reside in this portion of mid-infrared color-color space in Fig. 1, 522 (77%) are spectroscopically classified as broad-lined AGN, 40 (6%) are spectroscopically classified as narrow-lined AGN, 113 (17%) are spectroscopically classified as galaxies, and 6 (1%) are spectroscopically classified as stars. Out of all 576 AGES sources spectroscopically classified as broad-lined AGN and having good 4-band IRAC data, 522 (91%) meet these mid-infrared color criteria. Of the 99 AGES sources spectroscopically classified as narrow-lined AGN and having good 4-band IRAC data, 40 (40%) meet these mid-infrared color criteria. Furthermore, less than 3% of the nearly 4000 AGES normal galaxies would be (mis-)classified as AGN using these mid-infrared criteria. We note that sources classified as normal galaxies by AGES based on their optical spectra may still host an active, supermassive black hole: Chandra has identified a large population of luminous X-ray sources () with apparently normal optical spectra (e.g., Stern et al. 2002b). Similar sources might be below the existing X-ray limits for the Boötes field (Brand et al. 2005; Murray et al. 2005; Kenter et al. 2005), but still be correctly identified as AGN by Spitzer.
Optical surveys find an increasing number of quasars as a function of flux — the SDSS finds 15 quasars per deg2 to (Richards et al. 2002), the 2dF Quasar Redshift Survey finds 35 quasars per deg2 to (Croom et al. 2004), and the COMBO-17 survey AGN luminosity function implies approximately 90 quasars per deg2 to (Wolf et al. 2003). Using the mid-infrared selection criteria on the full IRAC Shallow Survey photometric catalog (ver. 1.1) of 14,099 non-saturated sources with detections in all IRAC bands, there are 2014 AGN candidates over the 8.06 deg2 of the NDWFS with four-band IRAC coverage. This translates to an approximate surface density of 250 AGN candidates per deg2 to a 8.0 m flux limit of 76 Jy. For a spectral index (§3), the mid-infrared depth of the IRAC images correspond to . The significantly higher surface density of IRAC-selected AGN relative to optically-selected AGN of comparable mid-infrared flux implies a sizable population of obscured quasars with attenuation of their observed optical light.
The relatively shallow () limit of the AGES spectroscopic follow-up may bias our results: AGES only identifies galaxies up to , while the Devriendt et al. (1999) SEDs plotted in Fig. 1 encroach upon our AGN selection criteria at . Some of the sources classified as AGN based on their IRAC colors are likely moderate-redshift galaxies, fainter than the AGES optical spectroscopic limits. However, our implied AGN surface density is below that predicted by models of mid-infrared AGN number counts. For , , and , Andreani, Spinoglio, & Malkan (2003) predicts AGN per deg2 with an 8 m flux higher than 100 Jy, while Treister et al. (2004) predicts only AGN per deg2 to the same flux limit. The large discrepancy is due to differences in the assumed evolution of the AGN luminosity functions. Since the IRAC Shallow Survey only detects sources per deg2 with an 8 m flux higher than 76 Jy, the Andreani et al. (2003) predictions are clearly high.
5 Summary
We analyze mid-infrared photometry from the IRAC Shallow Survey of 4693 sources with well-determined spectroscopic redshifts from version 1.11 of AGES. This sample includes 576 broad-lined AGN and 99 narrow-lined AGN. We find that mid-infrared photometry provides remarkably robust separation of normal and active galaxies: simple mid-infrared color criteria identify over 90% of the spectroscopically-identified broad-lined AGN and 40% of the spectroscopically-identified narrow-lined AGN. Our selection criteria rely on a mid-infrared excess in AGN SEDs, mirroring the traditional ultraviolet excess technique which has long been exploited to identify quasars. Only 17% of the AGES sources which fall within our mid-infrared color criteria for AGN are not spectroscopically classified as AGN. Many of these sources likely indeed host a luminous, active nucleus, where either dust obscuration hides the signature of an AGN at observed optical wavelengths, or the AGN signature is drowned out by the stellar emission from the host galaxy (e.g., Moran, Filippenko, & Chornock 2002). Simple mid-infrared selection criteria imply a surface density of 250 AGN candidates per deg2 to an 8 m flux limit of 76 Jy, nearly triple the surface density inferred from optical surveys to this flux limit. AGN missing from optical surveys may be of the obscured, type II variety which are implied by unified models of AGN and are invoked by models of the X-ray background. We show that the Spitzer Space Telescope is a powerful tool for studying AGN demographics; Spitzer will help identify a less-biased sample of super massive black holes in the universe, allowing us to probe the interconnection of fusion-driven and accretion-driven energy production over cosmic history.

References
- Andreani, Spinoglio, & Malkan (2003) Andreani, P., Spinoglio, L., & Malkan, M. A. 2003, ApJ, 597, 759
- Barger, Cowie, Mushotzky, & Richards (2001) Barger, A., Cowie, L. L., Mushotzky, R. F., & Richards, E. A. 2001, AJ, 121, 662
- Becker, White, & Helfand (1995) Becker, R. H., White, R. L., & Helfand, D. J. 1995, ApJ, 450, 559
- Brand et al. (2005) Brand, K. et al. 2005, ApJ, in preparation
- Croom, Smith, Boyle, Shanks, Miller, Outram, & Loaring (2004) Croom, S. M., Smith, R. J., Boyle, B. J., Shanks, T., Miller, L., Outram, P. J., & Loaring, N. S. 2004, MNRAS, 349, 1397
- Cutri, Nelson, Kirkpatrick, Huchra, & Smith (2001) Cutri, R. M., Nelson, B. O., Kirkpatrick, J. D., Huchra, J. P., & Smith, P. S. 2001, in ASP Conf. Ser. 232, The New Era of Wide-Field Astronomy, ed. R. Clowes, A. Adamson, & G. Bromage (San Francisco: ASP), 78
- Devriendt, Guiderdoni, & Sadat (1999) Devriendt, J. E. G., Guiderdoni, B., & Sadat, R. 1999, A&A, 350, 381
- Dey et al. (2005) Dey, A. et al. 2005, ApJ, in preparation
- Eisenhardt et al. (2004) Eisenhardt, P. R. et al. 2004, ApJS, 154, 48
- Fabricant, Hertz, Szentgyorgyi, Fata, Roll, & Zajac (1998) Fabricant, D. G., Hertz, E. N., Szentgyorgyi, A. H., Fata, R. G., Roll, J. B., & Zajac, J. M. 1998, SPIE, 3355, 385
- Fazio et al. (2004) Fazio, G. G. et al. 2004, ApJS, 154, 10
- Glikman, Gregg, Lacy, Helfand, Becker, & Brotherton (2004) Glikman, E., Gregg, M. D., Lacy, M., Helfand, D. J., Becker, R. H., & Brotherton, M. S. 2004, ApJ, in press (astro-ph/0402386)
- Gorjian et al. (2005) Gorjian, V. et al. 2005, ApJ, in preparation
- Haas, Siebenmorgen, Leipski, Meusinger, Müller, Chini, & Schartel (2004) Haas, M., Siebenmorgen, R., Leipski, C., Meusinger, H., Müller, S. A. H., Chini, R., & Schartel, N. 2004, A&A, 419, 49
- Hornschemeier et al. (2001) Hornschemeier, A. E. et al. 2001, ApJ, 554, 742
- Jannuzi & Dey (1999) Jannuzi, B. T. & Dey, A. 1999, in Photometric Redshifts and High-Redshift Galaxies, ed. R. Weymann, L. Storrie-Lombardi, M. Sawicki, & R. Brunner, Vol. 191 (San Francisco: ASP Conference Series), 111
- Jannuzi et al. (2005) Jannuzi, B. T. et al. 2005, ApJ, in preparation
- Kenter et al. (2005) Kenter, A. et al. 2005, ApJ, in preparation
- Lacy et al. (2004) Lacy, M. et al. 2004, ApJS, 154, 166
- Laurent, Mirabel, Charmandaris, Gallais, Madden, Sauvage, Vigroux, & Cesarsky (2000) Laurent, O., Mirabel, I. F., Charmandaris, V., Gallais, P., Madden, S. C., Sauvage, M., Vigroux, L., & Cesarsky, C. 2000, A&A, 359, 887
- Magorrian et al. (1998) Magorrian, J. et al. 1998, AJ, 115, 2285
- Moran, Filippenko, & Chornock (2002) Moran, E. C., Filippenko, A. V., & Chornock, R. 2002, ApJ, 579, 71
- Murray et al. (2005) Murray, S. S. et al. 2005, ApJ, in preparation
- Norman et al. (2002) Norman, C. et al. 2002, ApJ, 571, 218
- Pentericci et al. (2003) Pentericci, L. et al. 2003, A&A, 410, 75
- Richards et al. (2002) Richards, G. T. et al. 2002, ApJ, 124, 1
- Rieke et al. (2004) Rieke, G. H. et al. 2004, ApJS, 154, 25
- Schmidt & Green (1983) Schmidt, M. & Green, R. F. 1983, ApJ, 269, 352
- (29) Stern, D., Moran, E. C., Coil, A., Connolly, A., Davis, M., Dey, A., Eisenhardt, P., Elston, R., et al., 2002a, ApJ, 568, 71
- (30) Stern, D., Tozzi, P., Stanford, S. A., Rosati, P., Holden, B., Eisenhardt, P., Elston, R., Wu, K. L., et al., 2002b, AJ, 123, 2223
- Treister et al. (2004) Treister, E. et al. 2004, ApJ, in press (astro-ph/0408099)
- Tremaine et al. (2002) Tremaine, S. et al. 2002, ApJ, 574, 740
- Vanden Berk et al. (2001) Vanden Berk, D. E. et al. 2001, AJ, 122, 549
- Werner et al. (2004) Werner, M. W. et al. 2004, ApJS, 154, 1
- Wolf, Wisotzki, Borch, Dye, Kleinheinrich, & Meisenheimer (2003) Wolf, C., Wisotzki, L., Borch, A., Dye, S., Kleinheinrich, M., & Meisenheimer, K. 2003, A&AS, 408, 499