Quiescent observations of the WZ Sge type dwarf nova PQ Andromedae
Abstract
We have obtained time series optical spectra of the cataclysmic variable PQ And in quiescence. The spectra show a white dwarf continuum with narrow Balmer emission superimposed over strong Balmer absorption. The emission lines have blue and red components whose strength changes with time. An analysis of the H emission line implies a short orbital period below the period gap. Given its lack of accretion disk features, its large and infrequent outbursts, and an orbital period below the period gap, PQ And is probably a low accretion rate object similar to WZ Sge. In addition, white dwarf model fits imply that PQ And is an excellent ZZ Cet candidate.
1 Introduction
PQ And was discovered by McAdam on 21 March 1988 (Hurst et al., 1988a) at a visual magnitude of 10. Examination of the Palomar Sky Survey plates showed a precursor object with a blue magnitude between 18-19 and a red magnitude of about 20 (Hurst et al., 1988b; Hurst & Young, 1988). Within 19 days the light curve had declined by 2 magnitudes. The large outburst amplitude and rapid decline led to the initial classification of a classical nova but spectra taken 3.5 months after the outburst by Wade & Hamilton (1988) lacked the nebular features typically observed in classical novae. Instead, the spectra had strong Balmer emission surrounded by broad absorption similar to the quiesent spectra of the dwarf nova WZ Sge. The strong absorption indicated that the energy distribution was primarily from the white dwarf (WD) and implied an extremely low accretion rate. Recently, it has been shown that systems with this type of spectra are good candidates for containing non-radially pulsating DA WDs or ZZ Cet stars (Woudt & Warner, 2004; Warner & Woudt, 2004).
WZ Sge is a dwarf nova whose outbursts occur on timescales of tens of years and with amplitudes of 7-8 magnitudes. Cataclysmic variables (CVs) of this type are also known as TOADS or Tremendous Outburst Amplitude Dwarf novae (Howell, Szkody, & Cannizzo, 1995). These characteristics are thought to be due to the very close binary separation and the extremely low accretion rate in these systems. TOAD orbital periods are all below the period gap and are typically of order 90 minutes. The mass transfer rates implied by the models are only 10-11M⊙ yr-1 (Howell, Szkody, & Cannizzo, 1995).
Given PQ And’s similarities to a dwarf nova, Richter (1990) searched archival plates for evidence of previous outbursts. Two other outbursts with maximum magnitudes of 11 were found on 23 August 1938 and 7 March 1967. With decades long superoutburst timescales, an outburst amplitude of 9 mag, and a WZ Sge like quiescent spectrum, PQ And clearly has TOAD characteristics. In this paper we show that the orbital period appears to be below the period gap and that the system likely contains a WD in the instability strip.
2 Observations
We obtained 10 spectra of PQ And on the 6.5m Multiple Mirror Telescope (MMT) on 16 September 2003. We used the blue channel CCD spectrograph with a 500 grooves per millimeter grating and a 1″ wide slit for a spectral resolution of 3.6Å. Spectral coverage extends from 4100Å to 7200Å. The exposure time was set to 480 seconds in order to resolve an orbital period as low as 80 minutes. The seeing ranged from 10-15 during the night. Biases and flat fields were obtained at the beginning and end of each night and a HeNeAr comparison lamp spectrum was obtained after each PQ And observation for optimum wavelength calibration. Standard stars were also observed throughout the night for flux calibration. The spectra were reduced using standard IRAF111 IRAF is distributed by the National Optical Astronomy Observatories, which are operated by the Association of Universities for Research in Astronomy, Inc., under cooperative agreement with the National Science Foundation. routines.
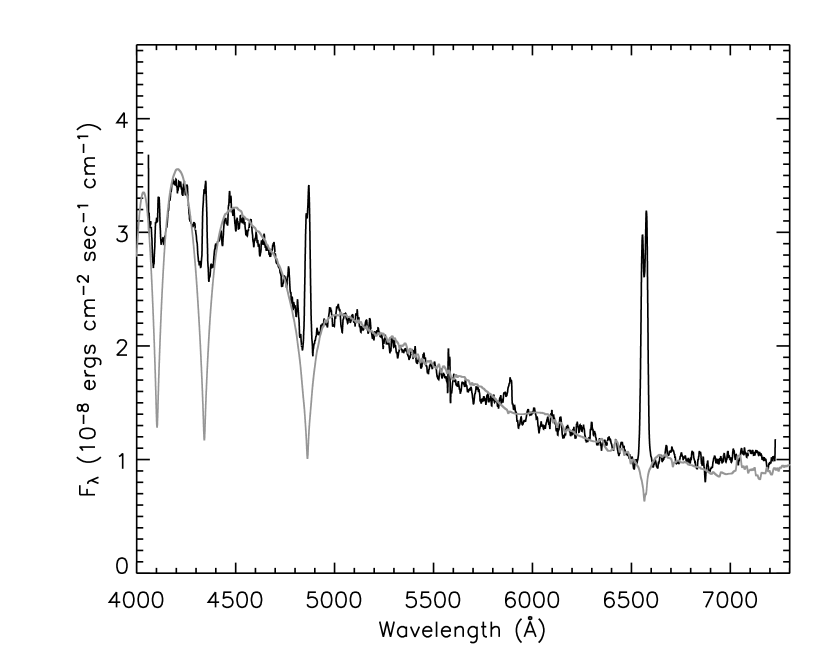
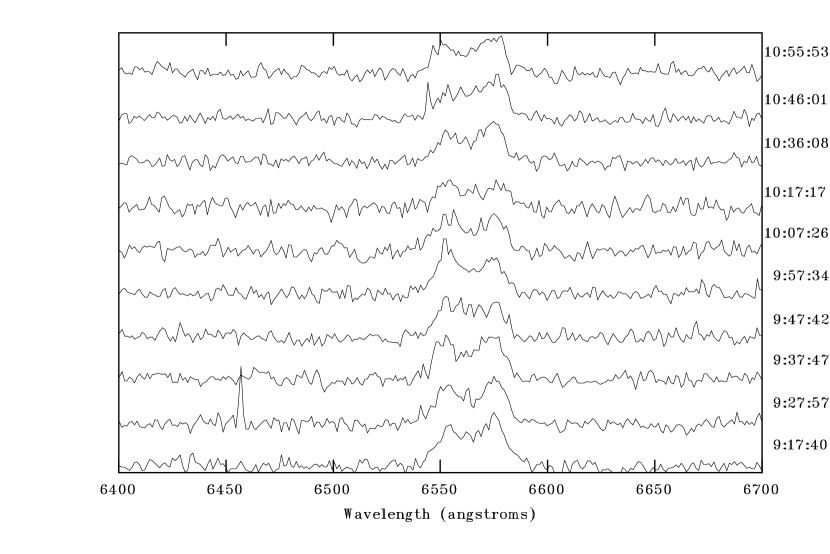
The combined spectrum is shown in Figure 1222Since the extinction toward PQ And provided by the Schlegel, Finkbeiner, & Davis (1998) maps is extremely low, E() = 0.06, none of the spectra shown in this paper have been dereddened nor have they been Doppler corrected.. The combined spectrum has narrow emission lines flanked by broad absorption similar to that described by Wade & Hamilton (1988). The equivalent widths, fluxes, and FWZI values of the observed emission lines in the combined spectrum are given in Table 1. All the emission lines have a red and a blue component whose strength and peak vary with time. The evolution of these components can best be seen in H and is shown in Figure 2.
3 Emission line analysis
Radial velocities from the line wings were measured by convolving the line profiles with a pair of Gaussian bandpasses (see Shafter, 1985; Szkody et al., 2002, for details) whose width is set to the resolution and whose separation is varied. For each separation, the velocities are fit to a sine function of the form
| (1) |
where is the systemic velocity, K is the semiamplitude, and is the offset from superior conjunction of the WD. The best solution is chosen as the one producing the smallest errors in the individual parameters and the total of the fit.
We fit both the H and H lines with this method but unfortunately not all the observed line profiles were useful. Two H and one H profiles were discarded due to cosmic rays or noise at a particular separation. Even with one less data point the H fit was significantly better than that determined for H thus we adopt the H separation and period as the best solution and force H to match. The best fit period is 1.70.1 hours where this is the formal uncertainty from the analysis. The true uncertainty in the period is greater since the derived period is longer than the sampling time. Figure 3 shows the radial velocity data for H and H fits. The radial velocity data is provided in Table 2. The orbital parameters of the lowest total fit are given in Table 3 along with other parameters of PQ And.
To quantify the component changes, we calculated the ratio of the blue (violet) to red components (V/R) for each spectrum that shows H. The V/R ratios were calculated with the IRAF program splot with two Gaussians which had the same FWHM and were centered at 6554Åand 6574Å. In each spectrum the Gaussians were only allowed a single wavelength shift provided that the separation was always 20Å. The results are shown in Figure 4.
Superior conjunction of the WD is defined as the red to blue crossing point of the emission lines. In Figure 4 we have fit the V/R data with a sine wave of the form:
| (2) |
to determine the crossing point. With Porb = 1.7 hours the best fit gives a superior conjunction date of HJD 2,452,898.902. The other model parameters are provided in Table 3.
3.1 Differential photometry
As an added check on the derived period we utilized differential photometry of PQ And from a CV orbital period survey taken in early 1999. The data were obtained at the Steward Observatory 1.6m Kuiper Telescope on Mount Bigalow with the 2K2K back-illuminated CCD Imager. The CCD was set at 22 binning giving an image scale of 0.3/pixel. The seeing varied during the run between 1 and 2. The observations were carried out in the band where the accretion disk and secondary star are typically of comparable brightness. The exposure time in the PQ And field was 600 seconds. Biases and flats were taken at the beginning and end of each night and the data were reduced in IRAF. The only night that we spent sufficient time to confirm a 1.7 hour period was 19 January 1999. On that night PQ And was observed 18 times over 3 hours. A differential light curve of the results is shown in Figure 5. The observed changes are suggestive of a variation similar to our derived spectroscopic period. The normalized periodogram (Scargle, 1982; Horne & Baliunas, 1986) of the photometry gives a longer period of 2.1 hours but at a low confidence level of only 50%.
We emphasize that these are not definitive orbital period solutions since the derived periods are similar in length to the total time that PQ And was observed. More data are necessary to reach a more definitive orbital period for this object. However, the fact that the radial velocities and the changes in the blue and red components show sine wave like behavior on the timescale of our observation runs imply that the period must be short. A firm upper limit on the orbital period can be established since the accretion disk would overwhelm the WD at periods 3 hours and there are no known dwarf novae in the gap. Thus for the remainder of the paper we will assume an orbital period range between 1.7 and 2.1 hours.
4 White dwarf model fitting
The WD effective temperature and gravity were determined by comparing the observed spectrum to a grid of synthetic spectra computed using the PHOENIX model atmosphere code. Details of the modeling can be found in Barman et al. (2000). The grid includes models with = 9,000K – 15,000K (in steps of 1000K), = 6.5, 7.0, 7.5, 8.0, and 10-1, 10-2 and solar metallicities. After masking the Balmer emission lines due to the accretion disk, was first determined using least-squares minimization across the full observed spectral range. Fixing , the surface gravity was found by fitting only the wings of H, H, and H since these were the only features available that are reasonably sensitive to gravity. The models with sub-solar metallicities gave only marginally better fits; however, models with solar metallicities indicate that several metal absorption lines should have been detected but clearly were not observed. Consequently, the metallicity is likely less than 10-1 solar. Overall, varying metallicity had little effect on the final and values. The final best-fitting model had = 12,000K 1000K and = 7.7 0.3 (cgs units) with 10-2 solar metallicity. Estimates for the WD mass and radius were found by using theoretical cooling tracks on a – plane Driebe et al. (1998). Figure 6 shows that the best fit and values give and . Note that this is only a mass estimate since the WDs in CVs are heated by accretion. The WD in PQ And might not follow this exactly.
There was residual flux red-ward of 6000Å between the observed and the best fit WD model spectra. This red excess is from the secondary. To improve the model fit, a synthetic spectrum of an M dwarf was added to the best-fitting WD synthetic spectrum. Since the secondary in CVs fill their Roche lobe, their characteristics are determined by the properties of the binary system. Equation 2.101 in Warner (1995),
| (3) |
relates the orbital period and secondary radius. Applying this equation to our derived periods gives a range of . The best fit effective temperature of the secondary from visual inspection was 2500 K, however, this should not be taken as definitive since the uncertainty is easily 500 K. Even this range and the short orbital period still imply a late M dwarf as the secondary star. The best fit WD plus secondary model spectral energy distribution is shown in Figure 1. An attempt was made to extract the secondary spectrum by subtracting the best-fitting WD synthetic spectrum from the observed spectrum. Unfortunately, the resulting spectrum was too noisy and did not cover enough of the TiO and VO bands to make a reliable determination of the spectral type. The only reported infrared color for PQ And, () = 0.850.49 (Sproats, Howell, & Mason, 1996), is consistent within the uncertainty with a late M spectral type. PQ And is too faint have been detected by the 2MASS survey (Hoard et al., 2002).
The mass equation, Equation 2.100 in Warner (1995),
| (4) |
is valid for Porb between 1.3 and 9 hours and provides a secondary mass range of 0.13-0.16 M⊙ for periods between 1.7 and 2.1 hours. Given the derived WD mass the binary system mass ratio, , is 0.28-0.34.
Using the derived WD radius, an absolute magnitude was computed for the best-fitting WD synthetic spectrum; Mv = 11.2. With an apparent magnitude, mv = 19 (Downes & Shara, 1993) and E(B-V) = 0.06, the distance to PQ And was found to be pc. This distance places PQ And 110 pc below the galactic plane. The only other distance estimate in the literature is from Sproats, Howell, & Mason (1996). They use the observed band magnitude to determine the absolute magnitudes. Their method depends on knowledge of the secondary’s size and its fractional contribution to the band flux. Without any period information Sproats, Howell, & Mason (1996) obtained a large range in distance for PQ And by assuming orbital periods between 80 minutes and 6 hours. Using their same method but now with our derived period range gives a distance between 319-817 pc. This estimate is still only an lower limit since it assumes that the secondary contributes 100% of the band flux however it is consistent with the distance from our WD analysis.
The best fit PHOENIX WD model puts PQ And in the region of the ZZ Ceti instability strip (Bergeron et al., 1995). The low accretion rate implied by the strong Balmer absorption makes PQ And an ideal candidate for follow-up observations for non-radial pulsations. If found, an analysis of the oscillations will provide information on important WD parameters including mass, composition, magnetic field, rotation, temperature, and luminosity (Winget et al., 1991). GW Lib (van Zyl et al., 2004), SDSS J161033.64-010223.3 (Woudt & Warner, 2004), SDSSJ013132.39-090122.3 and SDSSJ220553.98+115553.7 (Warner & Woudt, 2004) are other WZ Sge type dwarf novae of similar WD temperature that have already been shown to exhibit non-radial pulsations.
5 Conclusions
PQ And has characteristics similar to WZ Sge type variable stars. Its quiescent spectra show little indication of an accretion disk implying a low mass transfer rate. PQ And had three known superoutbursts of amplitude 9 magnitudes in the 50 years prior to 1988. Fits to spectra give Porb = 1.7 hours while the period derived from photometry is slightly longer at 2.1 hours. More observations are required to confirm the true period but the available evidence strongly supports an orbital period below the orbital gap. The best fit WD model gives Teff = 12,000 K, log(g) = 7.7, and a distance of 330 pc. The WD parameters place it within the ZZ Cet instability strip. With a quiescent magnitude of = 19, non-radial pulsations could be detected in PQ And with a mid-sized telescope.
References
- Barman et al. (2000) Barman, T. S., Hauschildt, P. H., Short, C. I, & Baron, E., 2000, ApJ, 537, 946
- Bergeron et al. (1995) Bergeron, P., Wesemael, F., Lamontagne, R., Fontaine, G., Saffer, R. A., & Allard, N. F. 1995, ApJ, 449, 258
- Downes & Shara (1993) Downes R.A., & Shara M., 1993, PASP, 105, 127
- Driebe et al. (1998) Driebe, T., Schönberner, D., Blöcker T., & Herwig, F., 1998, A&A, 339, 123
- Hoard et al. (2002) Hoard, D. W., Wachter, S., Clark, L. L., & Bowers, T. P. 2002, ApJ, 565, 511
- Howell, Szkody, & Cannizzo (1995) Howell, S. B., Szkody, P., & Cannizzo, J. K. 1995, ApJ, 439, 337
- Horne & Baliunas (1986) Horne, J. H. & Baliunas, S. L. 1986, ApJ, 302, 757
- Hurst et al. (1988a) Hurst, G. M., McAdam, D., Mobberley, M., & James, N. 1988, IAU Circ., 4570, 2
- Hurst et al. (1988b) Hurst, G. M., Young, A., Manning, B., Mobberley, M., Oates, M., Boattini, A., & Scovil, C. 1988, IAU Circ., 4577, 3
- Hurst & Young (1988) Hurst, G. M. & Young, A. 1988, IAU Circ., 4579, 1
- Richter (1990) Richter, G. A. 1990, Informational Bulletin on Variable Stars, 3546, 1
- Scargle (1982) Scargle, J. D. 1982, ApJ, 263, 835
- Schlegel, Finkbeiner, & Davis (1998) Schlegel, D. J., Finkbeiner, D. P., & Davis, M. 1998, ApJ, 500, 525
- Shafter (1985) Shafter, A. W. 1985, in Cataclysmic Variable and Low Mass X-Ray Binaries, ed. D. Q. Lamb & J. Patterson (Dordrecht: Reidel), 355
- Sproats, Howell, & Mason (1996) Sproats, L. N., Howell, S. B., & Mason, K. O. 1996, MNRAS, 282, 1211
- Szkody et al. (2002) Szkody, P., et al. 2002, AJ, 123, 430 (Paper 1)
- van Zyl et al. (2004) van Zyl. L. et al. 2004, MNRAS, 350, 307
- Wade & Hamilton (1988) Wade, R. A. & Hamilton, D. 1988, IAU Circ., 4629, 1
- Warner (1995) Warner, B., 1995, in Cataclysmic Variable Stars, (Cambridge University Press: Cambridge)
- Winget et al. (1991) Winget, D. E., et al. 1991, ApJ, 378, 326
- Warner & Woudt (2004) Warner, B. & Woudt, P. A. 2004, in ASP Conf Ser. Variable Stars in the Local Group, eds. D. Kurtz & Karen Pollard, in press
- Woudt & Warner (2004) Woudt, P. A. & Warner, B. 2004, MNRAS, 348, 599


| Line | EW | Flux | FWZI |
|---|---|---|---|
| (Å) | (erg s-1 cm-2) | (km s-1) | |
| H | 4 | 2.6e-16 | 2100 |
| H | 7 | 4.6e-16 | 2100 |
| H | 21 | 1.0e-15 | 2500 |
| He I | 5 | 2.1e-16 | |
| H | 75 | 2.1e-15 | 2700 |
| H | H | |||
|---|---|---|---|---|
| HJDaaHeliocentric JD of mid-integration minus 2,450,000. | Phase | RV | Phase | RV |
| (km s-1) | (km s-1) | |||
| 2898.890 | 0.92 | 149.1 | 0.84 | 116.6 |
| 2898.897 | 0.02 | -20.9 | 0.94 | 202.4 |
| 2898.904 | 0.12 | -23.4 | 0.04 | 72.8 |
| 2898.911 | 0.21 | -88.1 | 0.13 | -86.4 |
| 2898.918 | 0.31 | -80.0 | 0.23 | -88.2 |
| 2898.925 | 0.32 | -83.3 | ||
| 2898.932 | 0.50 | 52.3 | ||
| 2898.945 | 0.68 | 155.9 | 0.60 | 183.9 |
| 2898.952 | 0.70 | 240.7 | ||
| 2898.958 | 0.88 | 142.7 | 0.80 | 88.3 |
| Parameter | Value |
|---|---|
| Observed parameters | |
| RA (J2000) | +02:29:29.54 |
| DEC (J2000) | +40:02:39.40 |
| b | -19.06∘ |
| E(B-V) | 0.06 (Schlegel, Finkbeiner, & Davis, 1998) |
| Outbursts | 23 August 1938 (Richter, 1990) |
| 7 March 1967 (Richter, 1990) | |
| 21 March 1988 (Hurst et al., 1988a) | |
| Recurrence Timescale | 254 years |
| Maximum magnitude | 10 (visual) (Hurst et al., 1988a) |
| Minimum magnitude | 19.0 (V band) (Downes & Shara, 1993) |
| H emission line analysis | |
| Orbital period | 1.70.1 hours |
| Systemic velocity | 46.03.5 km s-1 (Equ. 1) |
| Semiamplitude | 135.713.7 km s-1 (Equ. 1) |
| Superior conjunction | 2,452,898.902 HJD (Equ. 2) |
| A | 0.950.01 (Equ. 2) |
| B | 0.250.01 (Equ. 2) |
| PHOENIX WD analysis | |
| Teff | 12,0001,000 K |
| log(g) | 7.70.3 |
| Z | 10-2 Z⊙ |
| Distance | 33050 pc |
| M1 | 0.470.13 M⊙ |