BIPOLAR SYMBIOTIC PLANETARY NEBULAE IN THE THERMAL-IR: M 2-9, Mz 3, and He 2-104
Abstract
We present thermal-infrared images of three extreme bipolar objects, M 2-9, Mz 3, and He 2-104. They are bipolar planetary nebulae with bright central stars and are thought to be powered by symbiotic binary systems. The mid-infrared images spatially resolve the spectral energy distributions of the central engines from the surrounding nebulae. A warm dust component of several hundred degrees can account for the core emission, while a cooler component of 100 K produces the more extended emission from the bipolar lobes. In every case, the dust mass for the unresolved core region is orders of magnitude less than that in the extended lobes, raising doubts that the hypothetical disks in the core could have been responsible for pinching the waists of the nebulae. We find total masses of roughly 0.5–1 M☉ in the nebulae of M 2-9 and Mz 3, requiring that this material was donated by intermediate-mass progenitor stars. The mass of He 2-104’s nebula is much lower, and any extended emission is too faint to detect in our images. Extended dust emission is detected around both M 2-9 and Mz 3, in both cases resembling the distribution of ionized gas. Our images of Mz 3 have the highest signal-to-noise in the extended polar lobes, and we show that the fairly uniform color temperature derived from our images can explain the 110 K dust component that dominates the far-infrared spectral energy distribution. In the case of Mz 3, most of the mass traced by dust is concentrated at high latitudes, and we note possible evidence for grain destruction in shocks indicated by an anticorrelation between [Fe ii] and dust emission. Except for these regions with enhanced [Fe ii] emission, the dust continuum closely resembles the distribution of ionized gas.
1 INTRODUCTION
The formation of bipolar structure in planetary nebulae (PNe) is one of the enduring challenges to understanding the late stages of stellar evolution. No simple model has yet emerged that can account for how a diffuse slowly-rotating asymptotic giant branch star develops strong bipolarity (not to mention point symmetry, multipolar outflows, jets, etc.) as it becomes a PN, although confining circumstellar disks, disk/jet precession, core rotation, or magnetic fields may play important roles (reviews of shaping mechanisms are given by Balick & Frank 2002; Frank 1999; Mellema & Frank 1995; and contributions in Meixner et al. 2004). One can alleviate the mental strain required to invent self-consistent single-star models by invoking binary systems to provide an axis of symmetry and angular momentum, which are necessary for bipolar phenomena.
The “Butterfly” (M 2-9), the “Ant” (Mz 3), and the “Southern Crab” (He 2-104) are among the most dramatic bipolar PNe with tightly-pinched waists seen in Hubble Space Telescope (HST) images (Balick & Frank 2002; Balick 1999; Balick et al. 1997; Corradi et al. 2001). It is interesting that each of these is thought to be powered by a symbiotic binary system (Whitelock 1987; Balick 1989; Corradi & Schwarz 1993; Corradi et al. 2000; Schmeja & Kimeswenger 2001; Smith 2003). These objects have been studied extensively with spectra at visual and near-infrared (IR) wavelengths. They have bright but highly-reddened stellar cores with rich emission-line spectra, accompanied by faint nebular spectra from lower density regions in their polar lobes (Evans 1959; Cohen et al. 1978; Allen & Swings 1972; Swings & Andrillat 1979; Balick 1989; Lutz et al. 1989; Goodrich 1991; Hora & Latter 1994; de Freitas Pacheco & Costa 1996; Phillips & Cuesta 1999; Smith 2003); M 2-9 and Mz 3 in particular are spectroscopic twins at visual and near-IR wavelengths except for the lack of H2 in Mz 3 (Smith 2003). Each object requires an ionization source with a temperature of order 30,000 K, and the nebulae seem to have moderately-enhanced abundances of He and N, suggesting intermediate-mass progenitors. Published distances to each object vary widely, scattered around 1-2 kpc; in this study we quote numerical values like M and L for a nominal distance of 1 kpc.
By comparison, little is known about the nature of dust in these sources. The spatial distribution of thermal-IR emission can constrain the dust temperature and mass in the core regions and polar lobes separately, in order to then estimate important quantities like the total mass of the nebulae and the mass of putative circumstellar disks. Low-resolution 8-13 spectra of M 2-9 and Mz 3 show similar, nearly flat continuum emission in both sources, except for the presence of [Ne ii] 12.8 in Mz 3 (Aitken & Roche 1982), but these observations did not include any spatial information. Although each object was observed with the Infrared Astronomical Satellite (IRAS), the low spatial resolution of those data cannot separate the relative contributions of the core and polar lobes. Ground-based images in the thermal-IR with arcsecond-scale spatial resolution have only been published for Mz 3 (Quinn et al. 1996), but that was one image in a single broad filter, making it difficult to constrain the dust temperature or mass. In an effort to clarify the spatial distribution of mid-IR properties of M 2-9, Mz 3, and He 2-104, we obtained 8-25 images of these sources with MIRLIN on the IRTF and TIMMI2 on the ESO 3.6m telescope.
2 OBSERVATIONS
2.1 MIRLIN Images of M 2-9
We obtained thermal-IR images of M 2-9 on the nights of 2001 July 22, 23, and 24 using the 5–26 camera MIRLIN mounted on the 3m NASA Infrared Telescope Facility (IRTF). In this configuration, MIRLIN’s 128128 Si:As BIB array has a pixel scale of 0465 and a field of view of 1. Chop-nod images were obtained in three broadband filters, N1, Qs, and Q5 centered at 8.8, 17.9, and 24.5 , respectively. We also used the 2% resolution circular variable filter (CVF) centered at 10.5 and 12.8 to image the emission lines of [S iv] and [Ne ii], respectively (see Table 1). The weather conditions were not optimal (intermittent thin clouds) on the first night when the 12.8 image was obtained, and the photometric uncertainty of that image is 30%, but the weather was better on the next two nights when the other images were obtained, and for those the photometric uncertainty is 10-20% (larger uncertainties in the Q-band images). The chopper throw was 30 east/west with a similar north/south telescope nod that we varied slightly from one set of images to the next. After sky subtraction, the many individual frames were resampled to a smaller pixel scale and then shifted and added, using the bright central star for spatial registration. The observations were flux calibrated using observations of Sco, adopting the zero magnitude fluxes in the MIRLIN handbook.
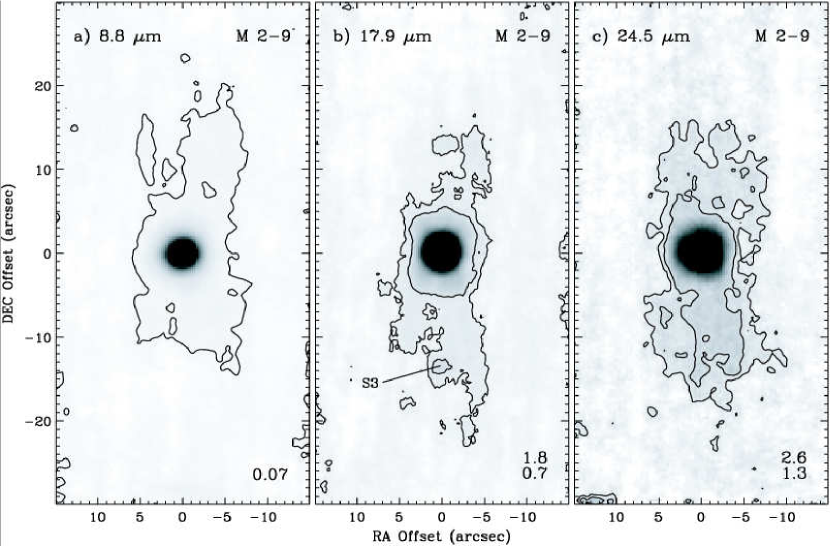
Figure 1 shows the final flux-calibrated images of M 2-9 in the N1, Qs, and Q5 filters, where the lowest contour is drawn at approximately 3 above the background. The [S iv] 10.5 and [Ne ii] 12.8 images are not displayed in Figure 1 because only the central point source and no extended structure was detected. Even in the continuum images, the extended structure in the nebula is very faint and only marginally detected, so we have not made ratio maps displaying the color temperature and emitting optical depth. The faint mid-IR extended emission from warm dust is clearly elongated in the north-south direction, similar to the structure seen in HST and near-IR images (Balick & Frank 2002; Hora & Latter 1994). This extended structure is discussed in more detail below in §4. Table 1 gives sky-subtracted flux densities for the central star in each filter, measured in a 4 diameter circular software aperture.
2.2 TIMMI2 Images of Mz 3 and He 2-104
On 2003 May 15 we used the Thermal Infrared Multi-Mode Instrument (TIMMI2) on the ESO 3.6m telescope at La Silla, Chile to obtain mid-IR images of Mz 3 and He 2-104. TIMMI2 has a 240340 pixel Si:As BIB detector with a pixel scale of 02 and a field of view of 48″64. Chop-nod images were obtained in three broadband filters centered at 8.9, 11.9, and 17.0 , and with the [Ne ii] 12.8 narrowband filter (see Table 2). Different chop-nod patterns were used for each source, due to the different sizes of the nebulae in optical images. The polar lobes of Mz 3 have a spatial extent of roughly 20″30 in emission-line images (Lopez & Meaburn 1983; Redman et al. 2000; Smith 2003) allowing us to place the positive and negative images of the nebula side-by-side on the array. Therefore, to observe Mz 3 we used a chopper throw of 40 north-south (chopping off the array) and east-west nods of 30–35. Since the inner bipolar lobes or “rings” of He 2-104 are only 10 across in optical images (Corradi et al. 2001), we used a chop-nod pattern appropriate for a point source, where we chopped 18 north-south and nodded the telescope 20 east-west. This allowed the target to be placed on the array four times for each set of chop-nod observations, increasing the effective on-source exposure time. For flux calibration, we obtained similar observations of Cru on the same night and at similar airmass, using fluxes for each filter listed in the TIMMI2 user manual. The weather was mostly photometric, and the photometric accuracy in our images is 5–10%, dominated by uncertainty in the standard star calibration.
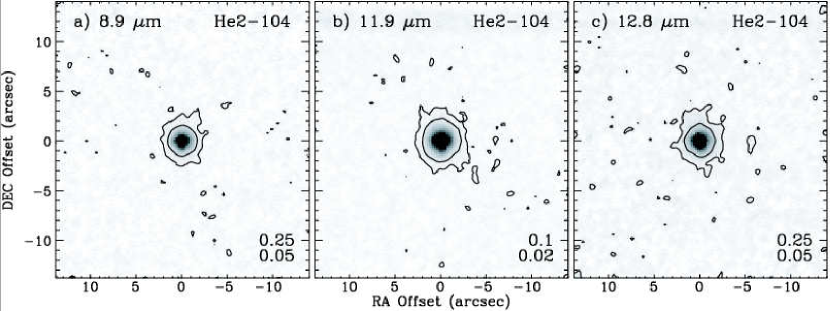
Figures 2 and 3 show the resulting TIMMI2 images of Mz 3 and He 2-104, respectively, where the lowest contour is 3 above the background. Table 2 gives sky-subtracted flux densities for the central star in each filter, measured in a 4 diameter circular software aperture for both Mz 3 and He 2-104.
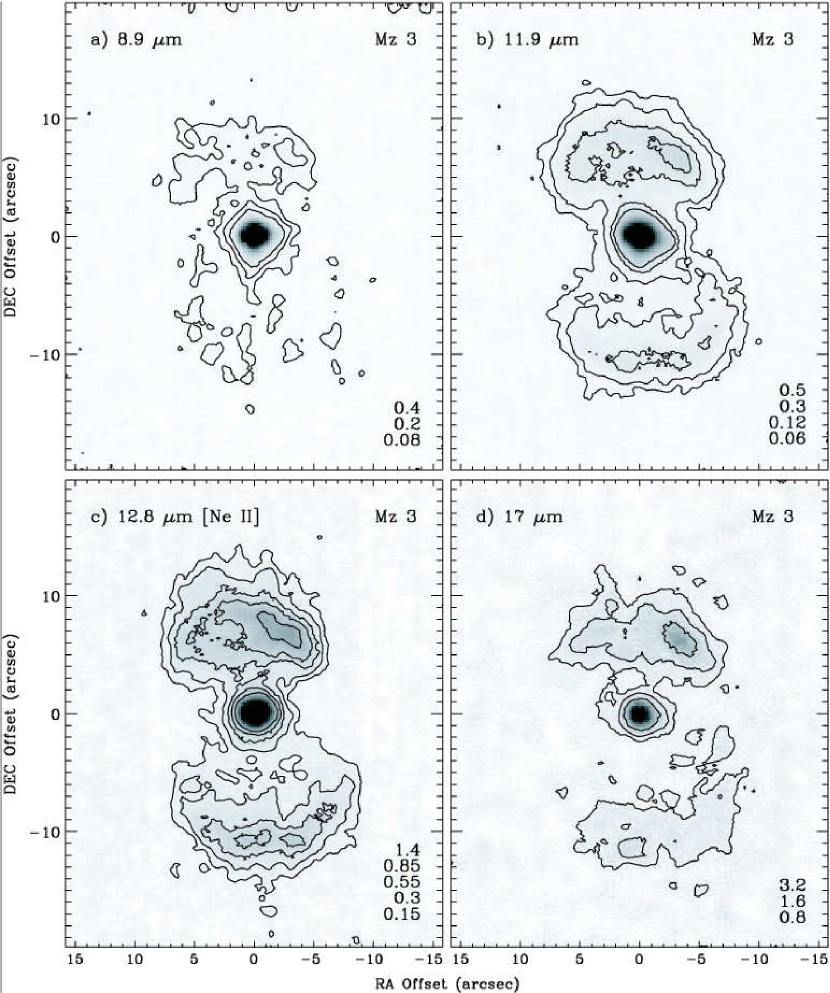
Figure 2 reveals obvious extended thermal-IR emission from warm dust in the bipolar lobes around Mz 3 in all three continuum filters, as well as strong [Ne ii] emission. The observed morphology is consistent with the pair of polar bubbles along the nearly north-south axis seen in emission-line images at shorter wavelengths (Smith 2003; Santander-Garcia et al. 2004; Guerrero et al. 2004). This extended structure is discussed in §5. Our images of He 2-104 had even better sensitivity than those of Mz 3, but were not sensitive enough to detect significant extended structure from the bipolar lobes or rings of He 2-104. The 11.9 and 12.8 images in Figure 3 do show a very faint hint of extended structure, with the lowest contour slightly elongated along a northeast/southwest direction out to 3 from the star. Elongation along this direction (which is different from both the chop and nod directions) would be consistent with the elongated central emission structure seen in HST images (Corradi et al. 2001), marking the limb-brightened section near the equator where the two polar lobes appear to meet. Our images demonstrate that the extended mid-IR structure of He 2-104 is much fainter compared to the central source than in either M 2-9 or Mz 3.
3 PHOTOMETRY OF THE CENTRAL ENGINES
All three of our targets show a bright, unresolved central source at mid-IR wavelengths, related to their status as potential symbiotic binaries. This is very different than the case of Carinae, to which these three planetary nebulae are often compared, where high-resolution IR images reveal a complex group of dust clumps arranged in a disrupted torus at the point where the two polar lobes meet at the equator (Smith et al. 2002). Our images of both M 2-9 and Mz 3 reveal extended emission from warm dust in the bipolar lobes of each object, while we detect no extended mid-IR emission around He 2-104 at comparable sensitivity. However, spatially-resolved mid-IR photometry of these central engines reveals important clues to the nature of all three objects. The extended nebulae of M 2-9 and Mz 3 are discussed separately in §4 and §5.
3.1 Dust Temperature, Luminosity, and Mass
Figure 4 displays the spectral energy distributions (SEDs) of the bright central cores measured from our images using a 4″ diameter aperture (from Tables 1 and 2), compared to the integrated emission in a larger aperture over a wider range of IR wavelengths measured by 2MASS, MSX, and IRAS.111These data were collected from the Infrared Science Archive at http://irsa.ipac.caltech.edu/. For each source, a solid curve shows an approximate gray-body fit to the SED of the unresolved central engine, which excludes extended emission from dust in the nebulae. In all three cases, the integrated emission at longer IR wavelengths clearly exceeds this solid curve, and the dotted curve shows the contribution from additional cool dust that must be emitted from a larger area on the sky than the aperture we used to measure each of the central stars (the dashed curve shows the sum of both, which fits the total 8–100 SED for each object). We take these two dust temperature components to represent warm dust in the unresolved central core and cool dust in the more extended nebulae. Temperatures, luminosities, and dust masses for these warm and cool dust components are listed in Table 3, calculated for a nominal distance of 1 kpc.
The dust mass for each temperature component in Table 3 was derived from the total integrated luminosity of the individual curves drawn in Figure 4, with necessary assumptions about the grain properties. The relation for the mass of dust required to account for the observed IR luminosity can be expressed as
| (1) |
where , , and are the effective grain radius, mass density, and mean thermal emissivity of the optically important grains, and is the Stefan-Boltzmann constant. Since no silicate emission features are seen in any of the three objects we observed, we assume that carbon grains dominate the IR emission, and we adopt 2.25 g cm-3. We do not know the grain size, but since the recurrent outbursts that may form symbiotic planetary nebulae are likely caused by nova-like outbursts, we assume 0.2 (i.e., the maximum grain size observed in novae; Gehrz 1999). With grains smaller than 0.2 , the grain emissivities given by Gilman (1974) can be approximated with
| (2) |
which permits us to write an expression for the dust mass that is independent of the grain emissivity and radius. We have
| (3) |
which is used to calculate the dust mass for each component listed in Table 3 and discussed below for each object. Given the inherent uncertainties in the flux calibration and uniqueness of the fits to the IR data, the dust masses we calculate are probably uncertain at the 30% level. Table 3 also lists likely total masses (gas + dust) assuming a gas-to-dust mass ratio of 230, which is appropriate if the grains fully deplete the carbon in solar-composition ejecta (Grevesse & Anders 1989).
We presume that at shorter near-IR wavelengths, the continuum SED of each object is dominated by the unresolved central source (e.g., Hora & Latter 1994; Smith 2003). At those wavelengths, the SED is an uncertain combination of reddened photospheric emission from the central stars, hot dust in the core, and scattered light from the lobes, so we do not show a fit to the 2MASS data in Figure 4. Even if extended hot dust in the polar lobes made a significant contribution at these wavelengths, the total mass would be negligible compared to the mass of cooler dust (e.g., Smith et al. 1998; and Table 3). In any case, the very simple fits in Figure 4 are sufficient to characterize the dust emission that dominates in the mid-IR.
3.2 Mz 3
Of the three targets we observed, Mz 3 has the smallest fraction of the total emission contributed by its unresolved core. At a wavelength of 12 , for example, the central source contributes less than half the total flux measured by MSX and IRAS. The relative contribution of the core weakens toward longer wavelengths, supplying 10% at 20 , and only about 1% at 60 .
The integrated IR luminosity is only about 25% of the total presumed bolometric luminosity of L=104 L⊙ (Smith 2003), indicating that the dust is optically thin to the escaping UV and visual-wavelength stellar radiation over most of the solid angle seen by the central engine. The mass of dust in the central core is difficult to guage accurately from the present data, because the emission may be optically thick. However, the dust mass needed to emit the optically thin 320 K gray-body shown in Figure 4 gives a useful lower estimate of the mass required in the outer part of the disk.
This core mass for the warm dust component is negligible compared to the much larger total mass of 0.6 (gas + dust) for the cooler material farther from the star in the bipolar lobes. This relatively large mass for the circumstellar ejecta, which approaches 1 , reinforces the conjecture from chemical abundances that the bipolar lobes were ejected from an intermediate-mass progenitor star (Smith 2003).
Our imaging photometry reveals a significant 12.8 [Ne ii] emission line from the central source, in agreement with spectra taken by Aitken & Roche (1982). We measure a continuum-subtracted flux of 9 Jy or 3.610-11 ergs s-1 cm-2 (integrated over the filter bandpass), and a corresponding equivalent width of 530 Å.
The observed mid-IR SED of the unresolved central source is somewhat flatter than a single gray-body, implying the existence of a range of dust temperatures. Thus, the single temperature of 320 K is only representative for the purpose of calculating the minimum luminosity and mass of the dust (Table 3). Indeed, an additional component of hot dust at 900 K is required to fit the near-IR continuum spectrum (Smith 2003; Cohen et al. 1978). This wide range of temperatures from the unresolved central source probably indicates the existence of a circumstellar disk with dust located at a range of different radii.
The observed properties of the core SED allow us to place some constraints on the hypothetical disk. The 320 K component represents the cooler, outer parts of the disk, while the 900 K dust (Smith 2003) traces the inner region of the disk, near the dust sublimation radius. For L=104 L⊙, these correspond to 10 and 80 AU, repsectively, or 10 to 80 mas for D=1 kpc. In any case the disk is much smaller than the spatial resolution of our images and near the limit attainable with HST, but within the current reach of IR interferometry. The disk is evidently very thin; the disk’s IR luminosity is less than about 5% of the total available bolometric luminosity (Smith 2003), indicating a half opening angle of 12.
3.3 M 2-9
The SED of M 2-9 shown in Figure 4 is similar to that of Mz 3, except that the relative contribution from extended cool dust is weaker. The 8–20 SED of the central source is almost identical to Mz 3, both having an N-band flux of 30 Jy and an intrinsic IR luminosity just below 500 L⊙; however, M 2-9 lacks significant 12.8 [Ne ii] emission (Aitken & Roche 1982). The 260 K fit to the SED of the central source is very approximate, since the observed SED is actually flatter than any single temperature, perhaps indicating dust at various radii in a circumstellar disk. As with Mz 3, a hotter dust component is needed to account for the near-IR continuum (Hora & Latter 1994). The central source also requires dust at a somewhat cooler average temperature compared to Mz 3, implying that the central source is intrinsically less luminous or that the dust is distributed toward larger radii in the disk.
The cooler dust component that dominates at far-IR wavelengths, emitted by the extended dust in the polar lobes of M 2-9, supplies a smaller fraction of the total IR luminosity than its counterpart in Mz 3. Also like Mz 3, the warm dust in the core of M 2-9 makes a negligible contribution to the total mass of the circumstellar nebula. And finally, like Mz 3, the relatively large total mass we derive for the cooler component in the extended nebula (about 0.8 ) requires that the progenitor that ejected the mass was probably an intermediate-mass star of at least a few solar masses.
Altogether, the similarities between the IR properties of M 2-9 and Mz 3 are remarkable. Since H2 formation is linked to dust grains in most circumstances, these similarities underscore the mystery of why the near-IR H2 lines are so prominent in the polar lobes of M 2-9 (Hora & Latter 1994), while being totally absent in Mz 3 (Smith 2003).
3.4 He 2-104
All our targets are dominated by a bright unresolved core, but He 2-104 is the only one in our sample showing no clear evidence for extended emission at 8–12 . The bright unresolved central engine of He 2-104 dominates the SED at all IR wavelengths we have observed, and the core flux we measure matches the integrated 12 IRAS flux. He 2-104 is also significantly fainter than the other two sources; the warm dust component has less than 1/3 of the N-band flux or bolometric IR luminosity of M 2-9 or Mz 3. The SED of He 2-104 shows no evidence for any 12.8 [Ne ii] emission.
In addition to the 320 K dust component that dominates at mid-IR wavelengths, He 2-104 also requires a component of hotter dust to account for the observed near-IR photometry, as is the case for both M 2-9 and Mz 3. Like the other two, the addition of a cooler dust component is needed at far-IR wavelengths to explain the integrated IRAS fluxes. However, in He 2-104 the cool 95 K component is far less luminous than the other two: it has only 30 L⊙, and it is the only source in which the luminosity of the cool dust component at far-IR wavelengths is much lower than the warmer dust component that dominates in the mid-IR. From equation 3, the mass of dust required to emit the observed far-IR flux from the 95 K component in He 2-104 is only 10-4 M⊙, or a total gas + dust mass of 0.02 . This is a much smaller mass than either M 2-9 or Mz 3, which explains why we did not detect any extended structure in our images, but does not let us place strong constraints on the likely mass of the progenitor star.
3.5 Where’s the Donut?
Here we briefly note that in all three objects, the mass of ejecta in the unresolved central core/disk is more than 100 times lower than the mass of ejecta in the more extended polar lobes. This fact is relevant for the quest to understand the origin of bipolar structure (see Balick & Frank 2002), since with disk masses that are orders of magnitude less than the polar lobes, these disks cannot provide the resistance needed to absorb momentum and thereby constrict the equatorial expansion of an otherwise spherical shell. The same problem exists for Carinae as well, where the hot equatorial dust in the core region provides negligible mass compared to the polar lobes (Smith et al. 2003; Frank et al. 1998). Some other mechanism that favors polar ejection of material may be required (see e.g., Balick & Frank 2002; Matt & Balick 2004; contributions in Meixner et al. 2004). Observations of stars still on the asymptotic giant branch suggest that asymmetries in proto-planetary nebulae start early, either through rotation or binary interactions (Gehrz 2004).
4 EXTENDED STRUCTURE OF M 2-9
Figure 1 reveals clear extended structure in the bipolar lobes of M 2-9, extending out to 15–20″ from the star toward both the north and south, consistent with the extent of the bipolar lobes seen in HST and IR images (Balick & Frank 2002; Hora & Latter 1994). Of the three wavelengths shown in Figure 1, the highest quality image is Figure 1 at 18 . In this image, the right (west) side of the nebula is clearly brighter than the left. This is the opposite of the case in emission-line tracers of ionized gas (Balick & Frank 2002; Hora & Latter 1994), which are much brighter on the east side of the nebula; note, however, that this pattern changes with time (Doyle et al. 2000; Allen & Swings 1972). This difference between emission lines and dust emission suggests a spatial anticorrelation between ionized gas and warm dust in the variable ionization structure of M 2-9’s bipolar lobes. Perhaps temporary exposure to the hard UV radiation field of the central source is sufficient to destroy significant quantities of dust. The destruction of dust grains by UV radiation is supported by observations of novae (Gehrz et al. 1980a, 1980b).
In Figure 1, the polar lobes of M 2-9 appear somewhat thicker at 24.5 than they do at 8–18 . A larger size at longer IR wavelengths might imply the existence of an outer shell of cooler dust that emits less efficiently at shorter IR wavelengths. Deeper images with higher spatial resolution are obviously needed to confirm this conjecture. Although poorly justified by the quality of the images in Figure 1, the possible existence of a double shell structure – a cool outer dust shell and a warmer inner dust shell – is motivated by other observational clues. M 2-9 is frequently compared to the Homunculus nebula around Car, which shows precicely this type of double-shell structure in thermal-IR images (Smith et al. 2003). A double-shell morphology is reinforced by the near-IR emission line structure of Car, with H2 delineating a thin outer shell, and a smaller inner shell seen clearly in [Fe ii] lines (Smith 2002). This is identical to the near-IR excitation structure observed in these same emission lines in images of M 2-9 (Hora & Latter 1994).
In addition to the similarities in the dust temperature and nebular excitation structure, M 2-9 and Car share other observational characteristics. Several observers have noted similarities in the very rich emission-line spectra of the central sources, including strong [Fe ii] emission (e.g., Balick 1989; Swings & Andrillat 1979; Allen & Swings 1972). More recently, it has been recognized that they also share a similar and very rare type of temporal variability in their nebulae. M 2-9 shows bizarre changes in its apparent brightness distribution, which are usually attributed to an azimuthally-evolving UV radiation field caused by moving shadows from the cooler component in the central binary system (Doyle et al. 2000; Allen & Swings 1972). Multiepoch UV images of Car have recently revealed a similar type of variability in its “Purple Haze”, with an anlogous root cause (Smith et al. 2004).
Finally, Figure 1 (especially Fig. 1) shows emission from the knot S3, and possibly its northern counterpart N3 as well, both at roughly 15″ from the star. This is significant, because it may indicate that dust survives in these condensations, which are thought to be shock excited. They are presumably formed by shocks in a fast polar wind or jet, and are sometimes called FLIERS (fast low-ionization emission regions; Balick & Frank 2002) or ansae. Their bright [Fe ii] emission is thought to be due to the liberation of Fe into the gas phase following the destruction of dust. Thus, their detection in dust emission at thermal-IR wavelengths is significant. However, [Fe ii] might contaminate the 17.9 filter.
5 EXTENDED STRUCTURE OF Mz 3
5.1 Morphology in Images
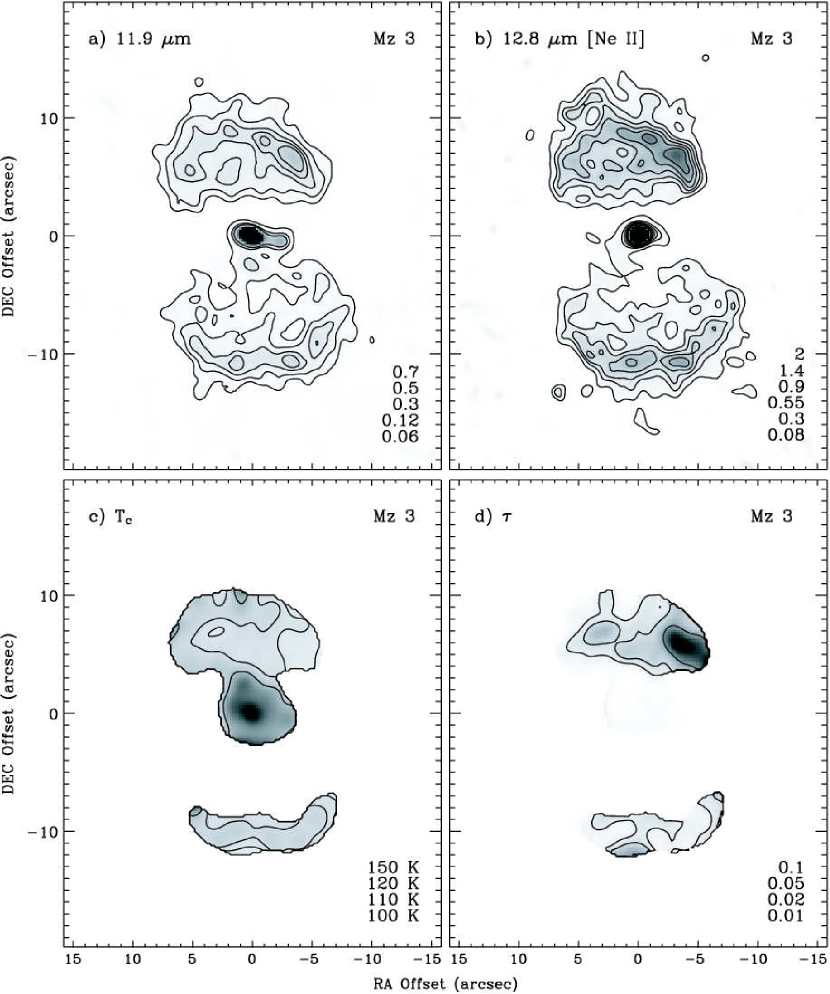
Of our three targets, Mz 3 shows the brightest and most dramatic extended structure. Although Mz 3 has a complex ejecta pattern with multiple polar lobes seen in images (Smith 2003; Santander-Garcia et al. 2004; Guerrero et al. 2004), here we are only concerned with the innermost bipolar lobes (i.e. the head and abdomen of the ant). Viewing the images on a computer display shows considerably more detailed structure than is conveyed in Figure 2, so we applied 20 iterations of the lucy deconvolution algorithm in IRAF to our 11.9 continuum and 12.8 [Ne ii] images, which have the best signal-to-noise in our dataset. The results are shown in Figures 5 and 5, respectively.222The emission spot immediately west of the central star in Figure 5 is an artifact of the sky subtraction offset settling time, as opposed to real structure. Our standard star used as the PSF in the deconvolution had a slightly different chop-nod pattern. At any position in the polar lobes, the [Ne ii] intensity is significantly higher than the continuum emission – from Figure 5 we have typically ([Ne ii]) 3 (11.9). Integrating over the 2200 Å filter bandpass, this indicates a typical equivalent width in the lobes of 4400400 Å, which is much higher than in the central star because of the cooler and optically thinner dust continuum (see below).
Most of the extended 11.9 emission – and therefore most of the dust mass – appears to be concentrated in caps at the top and bottom of the polar lobes, rather than in their side walls. If the dust mass traces the gas mass, then this is a crucial fact as it bears on the latitudinal distribution of mass in the initial ejection. There is good reason to think that the dust mass does generally trace the total gas mass in the lobes, since the morphology of the 11.9 image is almost identical to the [Ne ii] images, as well as narrowband emission-line images at shorter wavelengths (Smith 2003; Santander-Garcia et al. 2004; Guerrero et al. 2004). On the other hand, the regions of the polar lobes where the dust appears to be deficient – in the side walls at low latitudes and in the polar “blisters” beyond the lobes – are precisely the locations of low excitation where infrared [Fe ii] emission is mysteriously enhanced (Smith 2003). In other words, there is an anti-correlation between dust and [Fe ii] emission, which might suggest that some of the excess [Fe ii] emission has resulted as iron atoms were liberated from grains into the gas phase by shocks. We also point out that the polar “blisters” are seen in the [Ne ii] image, especially to the north.
Interestingly, the dust morphology resembles the high-excitation emission tracers like He i and [O iii] somewhat better than it does hydrogen lines. For example, the missing side walls of the polar lobes are a characteristic of both Figure 5 and the He i 10830 emission (Smith 2003), while the limb-brightened side walls are seen clearly in hydrogen and [Fe ii] lines. This is somewhat surprising, since dust and high-excitation emission from ionzed gas are often segregated (the nebula of RY Scuti is a clear example; Gehrz et al. 2001; Smith et al. 2001). The similarity of the warm dust emission and ionized gas may have implications for the heating mechanism (i.e. either they are heated radiatively by the same latitudinally-dependent UV field, or perhaps the dust is heated by trapped Ly photons in the nebula, etc.).
Finally, several authors have noted excess extinction at low latitudes (Smith 2003; Guerrero et al. 2004) or evidence for dust in the side walls of the polar lobes from polarization data (Scarrott & Scarrott 1995), while the majority of the dust in our images is located in the polar caps as noted above. This indicates that the extra dust that may be causing this extinction and polarization in scattered light may be cold, with insufficient heating to produce detectable mid-IR emission.
5.2 Dust Temperature and Optical Depth
Figures 5 and 5 show the spatial distribution of dust color temperature and emitting optical depth in the polar lobes of Mz 3. The color temperature for each pixel in Figure 5 is given by
| (4) |
where is the flux ratio between the continuum at (11.9 ) and (17 ), and is the dust emissivity exponent. We have assumed that at these wavelengths the grains have an emissivity proportional to (i.e., =1).333Note that if this assumed emissivity is wrong, then smaller values of would result in higher derived color temperatures. To calculate this color temperature image, we clipped the input 11.9 image at a level of 0.18 Jy arcsec-2, with lower values set to zero. The resulting color temperature map was then used to calculate the distribution of the emitting optical depth of warm grains in the lobes of Mz 3 (note that is not the absorption optical depth). The emitting optical depth at some wavelength is given by
| (5) |
where is the specific intensity in an input image, and is the Planck function corresponding to a given color temperature in each pixel of the image.
The apparent dust temperature distribution in Mz 3’s polar lobes in Figure 5 is fairly uniform, dominated by temperatures of 100–130 K, while peak temperatures in the unresolved core region exceed 300 K. Thus, the spatially-resolved temperature structure confirms our interpretation of the SED in Figure 4. Consequently, the “cool” mass estimates we list in Table 3 are reliable values for Mz 3’s nebula, without contamination by dust in the central disk. The map for Mz 3 in Figure 5 shows values that typically range from 0.01 to 0.05, so it is unlikely that a significant amount of mass is hidden in optically thick clumps. Only in the brightest part of the polar lobes, roughly 8″ northwest of the star, do we see optical depths that exceed 0.1.
The observed grain color temperature and the apparent separation from the central engine provide a consistency check for evaluating our assumptions about distance, luminosity, and grain properties. Most of the dust in the polar lobes appears to reside at a separation of 10″ or =104 AU if the distance to Mz 3 is roughly 1 kpc. The most likely bolometric luminosity of the central engine is of order 104 (Smith 2003). Then, the grain temperature should correspond to
| (6) |
where is the ratio of absorption to emission efficiency for the grains. For blackbodies (i.e., =1) we would expect a dust temperature around 30 K, much lower than observed. The higher observed temperature would require 200, which would be consistent with small graphite grains with radii of 0.1 (Gilman 1974). This is consistent with the roughly wavelength-dependence that we assumed initially to calculate the dust temperature. Alternatively, if the grains are larger than 0.1 (i.e. a somewhat smaller value of ), then the bolometric luminosity could be somewhat larger or the distance smaller than we assumed.
6 CONCLUSIONS
We presented thermal-IR images of the bipolar planetary nebulae M 2-9, Mz 3, and He 2-104, obtained at the IRTF and at ESO. The distribution of dust in these systems is of interest as each object is strongly bipolar with a bright central star, and each is thought to be powered by a symbiotic binary system.
Our mid-IR images allowed us to construct SEDs of the bright, unresolved central engines separate from the surrounding nebulae. In each case, we find that a warm dust component of several hundred degrees can account for the core emission (260, 320, and 320 K in M 2-9, Mz 3, and He 2-104, respectively), while a cooler component produces the more extended emission from the bipolar lobes (85, 110, and 95 K in M 2-9, Mz 3, and He 2-104, respectively). Hot dust at temperatures up to 900 K is needed to fit the near-IR SEDs of each source, but these additional components contribute negligible mass.
In every case, the dust mass for the unresolved core region is orders of magnitude less than the mass of the extended lobes, raising doubts that the hypothetical disks in the core could have been responsible for pinching the waists of the bipolar nebulae. Assuming a gas:dust mass ratio of 230 appropriate for graphite grains and solar composition, we find masses of roughly 0.8 and 0.6 M☉ in the nebulae of M 2-9 and Mz 3, respectively. These relatively high masses require that this material was donated by intermediate-mass progenitor stars. The mass of He 2-104’s nebula is much lower, in accordance with the fact that we detect no extended dust emission from its much fainter nebula.
We detected extended dust emission around both M 2-9 and Mz 3, and in both cases it resembled the distribution of ionized gas seen in narrowband emission-line images. Our images of Mz 3 have the highest signal-to-noise in the extended polar lobes, and we show that the fairly uniform color temperature derived from these images can explain the 110 K dust component that dominates the far-IR spectral energy distribution. Thus, the mass derived from the cool 110 K component traces material in the polar lobes. In the case of Mz 3, the dust is concentrated at high latitudes.
We also note possible evidence for grain destruction in shocks, indicated by an anticorrelation between dust seen in our images and [Fe ii] emission in previously-published near-IR images. While dust appears to be absent or weak in these regions (i.e. the polar “blisters” of Mz 3), 12.8 [Ne ii] emission is detected. Except for these regions with enhanced [Fe ii] emission, the thermal-IR continuum from dust closely resembles the distribution of ionzed gas.
Given the dust temperatures of the as-yet unresolved central sources, where dust presumably resides in a circumstellar disk, each of these bright objects may prove to be worthwhile targets for mid-IR interferometric observations to resolve the disks.
References
- (1)
- (2) Aitken, D.K., & Roche, P.F. 1982, MNRAS, 200, 217
- (3)
- (4) Allen, D.A., & Swings, J.P. 1972, ApJ, 174, 583
- (5)
- (6) Balick, B. 1989, AJ, 97, 476
- (7)
- (8) Balick, B. 1999, in ASP Conf. Ser. 188, Optical and Infrared Spectroscopy of Circumstellar Matter, eds. E.W. Guenther, B. Stecklum, & S. Klose (San Francisco: ASP), 241
- (9)
- (10) Balick, B., & Frank, A. 2002, ARAA, 40, 439
- (11)
- (12) Balick, B., Icke, V., & Mellema, G. 1997, HST Press Release, STScI-PR97-35
- (13)
- (14) Cohen, M., Fitzgerald, M.P., Kunkel, W., Lasker, B.M., & Osmer, P.S. 1978, ApJ, 221, 151
- (15)
- (16) Corradi, R.L.M., & Schwarz, H.E. 1993, A&A, 268, 714
- (17)
- (18) Corradi, R.L.M., et al. 2000
- (19)
- (20) Corradi, R.L.M., et al. 2001
- (21)
- (22) Doyle, S., Balick, B., Corradi, R.L.M., & Schwarz, H.E. 2000, AJ, 119, 1339
- (23)
- (24) de Freitas Pacheco, J.A., & Costa, R.D.D. 1996, A&A, 309, 629
- (25)
- (26) Evans, D.S. 1959, MNRAS, 119, 150
- (27)
- (28) Frank, A. 1999, New Astron. Rev., 43, 31
- (29)
- (30) Frank, A., Ryu, D., & Davidson, K. 1998, ApJ, 500, 291
- (31)
- (32) Gehrz, R.D. 1999, in Processes in Astrophysical Fluids, eds. O. Regev & D. Prialnik, Physics Reports, 311, 405
- (33)
- (34) Gehrz, R.D., Smith, N., Jones, B., Puetter, R., & Yahil, A. 2001, ApJ, 559, 395
- (35)
- (36) Gehrz, R.D., Grasdalen, G.L., Hackwell, J.A., & Ney, E.P. 1980a, ApJ, 237, 855
- (37)
- (38) Gehrz, R.D., Hackwell, J.A., Grasdalen, G.L., Ney, E.P., Neugebauer, G., & Sellgren, K. 1980b, ApJ, 239, 570
- (39)
- (40) Gehrz, R.D. 2004, in ASP Conf. Ser. 313, Asymmetrical Planetary Nebulae III, Meixner, M., Kastner, J.H., Balick, B., & Soker, N., eds. (San Francisco: ASP), 327
- (41)
- (42) Gilman, R.C. 1974, ApJS, 28, 397
- (43)
- (44) Goodrich, R.W. 1991, ApJ, 366, 163
- (45)
- (46) Grevesse, N., & Anders, E. 1989, in Cosmic Abundance of Matter, ed. C.J. Waddington (AIP: New York), 1
- (47)
- (48) Guerrero, M.A., Chu, Y.H., & Miranda, L.F. 2004, AJ, 128, 1694
- (49)
- (50) Hora, J.L., & Latter, W.B. 1994, ApJ, 437, 281
- (51)
- (52) Lopez, J.A., & Meaburn, J. 1983, MNRAS, 204, 203
- (53)
- (54) Lutz, J.H., Kaler, J.B., Shaw, R.A., Schwarz, H.E., & Aspin, C. 1989, PASP, 101, 966
- (55)
- (56) Matt, S., & Balick, B. 2004, ApJ, in press
- (57)
- (58) Meixner, M., Kastner, J.H., Balick, B., & Soker, N. (eds.) 2004, ASP Conf. Ser. 313, Asymmetrical Planetary Nebulae III (San Francisco: ASP)
- (59)
- (60) Mellema, G., & Frank, A. 1995, MNRAS, 273, 401
- (61)
- (62) Phillips, J.P., & Cuesta, L. 1999, AJ, 118, 2919
- (63)
- (64) Quinn, D.E., Moore, T.J.T., Smith, R.G., Smith, C.H., & Fujiyoshi, T. 1996, MNRAS, 283, 1379
- (65)
- (66) Redman, M.P., O’Connor, J.A., Holloway, A.J., Bruce, M., & Meaburn, J. 2000, MNRAS, 312, L23
- (67)
- (68) Santander-Garcia, M., Corradi, R.L.M., Balick, B., & Mampaso, A. 2004, A&A, 426, 185
- (69)
- (70) Scarrott, S.M., & Scarrott, R.M.J. 1995, MNRAS, 277, 277
- (71)
- (72) Schmeja, S., & Kimeswenger, S. 2001, A&A, 377, L18
- (73)
- (74) Smith, N. 2002, MNRAS, 337, 1252
- (75)
- (76) Smith, N. 2003, MNRAS, 342, 383
- (77)
- (78) Smith, N., Gehrz, R.D., & Krautter, J. 1998, AJ, 116, 1332
- (79)
- (80) Smith, N., Gehrz, R.D., & Goss, W.M. 2001, AJ, 122, 2700
- (81)
- (82) Smith, N., Gehrz, R.D., Hinz, P.M., Hoffmann, W.F., Mamajek, E.E., Meyer, M.R., & Hora, J.L. 2002, ApJ, 567, L77
- (83)
- (84) Smith, N., Gehrz, R.D., Hinz, P.M., Hoffmann, W.F., Hora, J.L., Mamajek, E.E., & Meyer, M.R. 2003, AJ, 125, 1458
- (85)
- (86) Smith, N., Morse, J.A., Collins, N.R., & Gull, T.R. 2004, ApJ, 610, L105
- (87)
- (88) Swings, J.P., & Andrillat, Y. 1979, A&A, 74, 85
- (89)
- (90) Whitelock, P.A. 1987, PASP, 99, 573
- (91)
| Filter | Exp. Time | FνaaCentral star in a 4 diameter aperture. | ||
|---|---|---|---|---|
| () | () | (sec.) | (Jy) | |
| N1 | 8.81 | 0.87 | 2700 | 30.3 |
| S iv] | 10.5 | 2% | 5300 | 32.8 |
| Ne ii] | 12.8 | 2% | 3900 | 41.1 |
| Qs | 17.9 | 2.0 | 6200 | 41.5 |
| Q5 | 24.5 | 0.76 | 2700 | 38.1 |
| Filter | Exp. Time (Mz3) | Fν(Mz3) | Exp. Time (He2) | Fν(He2) | ||
|---|---|---|---|---|---|---|
| () | () | (sec.) | (Jy) | (sec.) | (Jy) | |
| N8.9 | 8.7 | 0.78 | 720 | 34.3 | 2880 | 8.1 |
| N11.9 | 11.6 | 1.20 | 1200 | 36.9 | 2880 | 8.8 |
| Ne ii] | 12.8 | 0.22 | 1080 | 45.8 | 4320 | 8.7 |
| Q1 | 17.0 | 0.80 | 1200 | 45.7 |
Note. — Fν for each source corresponds to the bright central star measured through a 4 diameter circular aperture.
| Parameter | units | M 2-9 | Mz 3 | He 2-104 |
|---|---|---|---|---|
| Tc warm dust | K | 260 | 320 | 320 |
| L warm dust | L⊙aaAt a distance of 1 kpc. | 470 | 462 | 106 |
| M warm dust | M⊙aaAt a distance of 1 kpc. | 4.010-6 | 1.110-6 | 2.610-7 |
| M warm gas | M⊙aaAt a distance of 1 kpc. | 9.210-4 | 2.510-4 | 6.010-5 |
| Tc cool dust | K | 85 | 110 | 95 |
| L cool dust | L⊙aaAt a distance of 1 kpc. | 483 | 1770 | 29 |
| M cool dust | M⊙aaAt a distance of 1 kpc. | 3.410-3 | 2.610-3 | 1.010-4 |
| M cool gas | M⊙aaAt a distance of 1 kpc. | 0.78 | 0.60 | 0.02 |