The Earth’s Gamma-ray Albedo as observed by EGRET
Abstract
The Earth’s high energy gamma-ray emission is caused by cosmic ray interactions with the atmosphere. The EGRET detector on-board the CGRO satellite is only the second experiment (after SAS-2) to provide a suitable dataset for the comprehensive study of this emission. Approximately 60% of the EGRET dataset consist of gamma photons from the Earth. This conference contribution presents the first results from the first analysis project to tackle this large dataset. Ultimate purpose is to develop an analytical model of the Earth’s emission for use in the GLAST project. The results obtained so far confirm the earlier results from SAS-2 and extend them in terms of statistical precision and angular resolution.
1 Motivation
The Earth’s high-energy gamma-ray emission (the “gamma-ray albedo”) has been studied very little from space. The most precise measurements so far were obtained in 1972/73 with the SAS-2 satellite thompson but have very limited photon statistics. Other space measurements include kraushaar ; guryan ; galper .
The gamma-ray albedo is caused by the interaction of cosmic rays and solar wind with the Earth’s atmosphere. The study of the albedo is interesting mainly for two reasons:
-
1.
From a geophysical point of view, it can serve to improve our understanding of the interaction of cosmic rays and solar wind with the atmosphere and the Earth’s magnetic field.
-
2.
For gamma-ray-astronomical observations from satellites, the albedo constitutes an intense background. It is important to know the properties of this background in detail in order to be able to (a) avoid it as much as possible by specific pointing strategies and data filtering (either online or offline), and (b) possibly use it as a calibration source.
The EGRET high-energy gamma-ray telescope thompson2 was operational as part of the Compton Gamma-Ray Observatory satellite (CGRO) for 9.1 years from 1991 until 2000. CGRO had a circular orbit at approx. 450 km altitude (the altitude changed over time) with an inclination of 28.5∘. From this perspective, the Earth’s horizon appears at a zenith angle of 111∘. The instrument was almost always in pointed observation mode which meant that the Earth occulted the object of interest for on average nearly 50% of the time, or in other words, the Earth was in the 80∘ diameter field of view (FOV) for more than half the time.
In order to avoid the bright gamma-ray albedo of the Earth, the spark-chamber trigger of EGRET was automatically modified as the Earths horizon moved in and out of the FOV. Still, the number of albedo photons registered by EGRET is large. The total cleaned photon dataset comprises 5.2 million events. Roughly 60% of these were observed from zenith angles . More than half of the archival EGRET data are albedo photons!
In view of the upcoming GLAST mission michelson , the interest in the Earth’s albedo increased, and it was decided to use the rich EGRET dataset to obtain the most detailed picture of the Earth’s albedo available so far. The application of this knowledge to GLAST will be especially direct because GLAST is foreseen to fly an orbit very similar to that of CGRO.
The results presented here are from an ongoing analysis project and make use of only about 10% of the available data. In this first step, the analysis method was established and results of previous observations confirmed. The project will continue to study the complete data set, and look in addition at longitudinal and latitudinal variations of the measured parameters.
2 Method
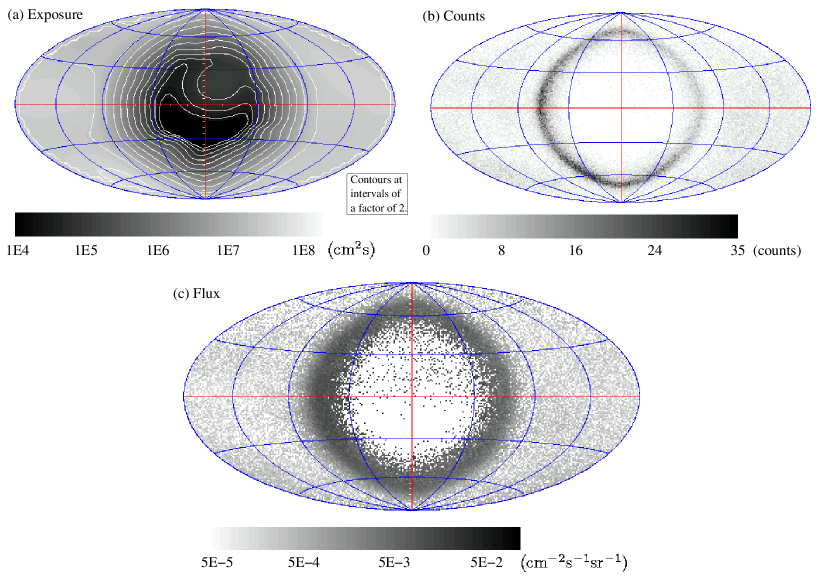
All results were obtained using the newly developed software DAVE dave (written in C++ and based on tools under development for the GLAST mission). The EGRET pointing and livetime history was converted into an Earth-centered coordinate system interpolating between entries on a one-minute timescale. Taking into account the changing detector modes and assuming a differential gamma-ray spectral index of 2.0 (the value measured by SAS-2 for the horizon emission), all-sky exposure maps in a Hammer-Aitoff projection were obtained. Using the same Earth-centered coordinate system, corresponding counts maps were derived from the event data. Finally, taking into account the solid angle of each map pixel, flux maps were obtained. This process was repeated at different angular resolutions, in different energy bands, and restricting the EGRET data to different Earth latitude bands. All error calculations used the appropriate Poisson statistics.
3 Results
The results shown here constitute the first installment of the first ever Earth gamma-ray albedo study using EGRET data.
The main aim in the first phase of this analysis project was to produce results which can be compared to the earlier results by SAS-2 thompson . SAS-2 had an equatorial orbit with only 2∘ inclination (as opposed to 28.5∘ for EGRET). To enable the comparison, the satellite latitude in the EGRET dataset was restricted to the range . Due to the proximity to the peak of the Solar cycle, CGRO was exposed to strong atmospheric drag during the first mission years such that its altitude decreased relatively quickly. In order to have a constant definition of the zenith angle, the data was restricted to the first year of EGRET operation (viewing periods 0.2 until 25.0).
Using the method described above, flux maps were obtained with 1∘ resolution for the energy bands 35 MeV - 100 MeV, 100 MeV - 300 MeV, 300 MeV - 1 GeV, and 1 GeV - 10 GeV. In these maps, especially at higher energies, some pixels stay empty due to low photon statistics.
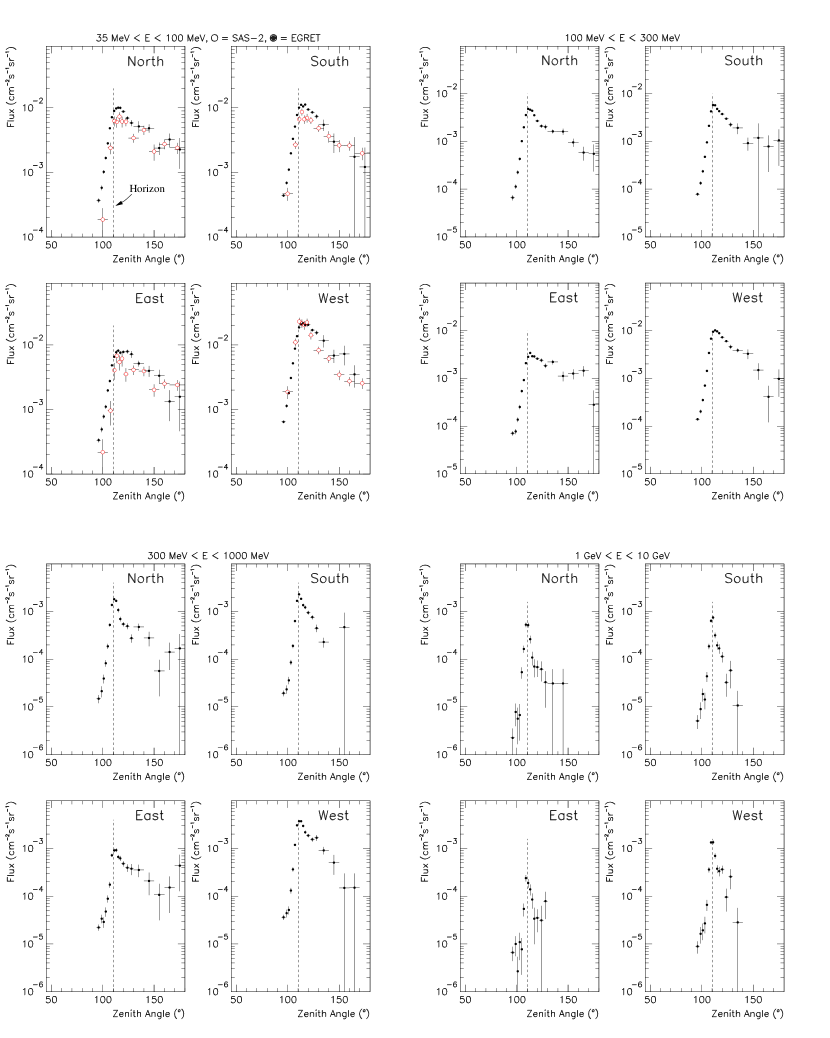
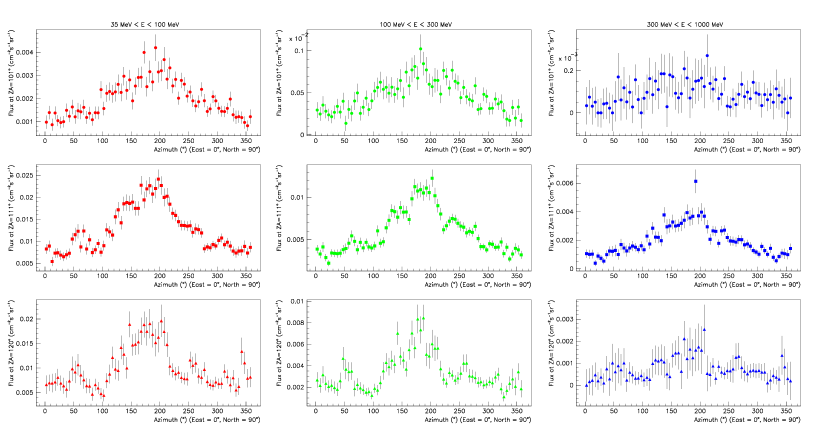
From the 1∘ resolution maps, azimuthal and radial (i.e. along lines of constant azimuth) flux profiles were obtained, the latter in four 60∘ sectors: North (azimuth 60∘ - 120∘), South (azimuth 240∘ - 300∘), East (azimuth 330∘ - 30∘), West (azimuth 150∘ - 210∘). Figures 2 and 3 show the profiles.
3.1 Comparison to SAS-2 data
EGRET confirms the SAS-2 results (see figures 2 and 4). The comparison is meaningful also because the observations were made with a time separation of 19 years, i.e. with a phase shift of only 0.2 in solar cycle. However, the number of sunspots in 1973 was significantly lower than in 1992. Furthermore, SAS-2 had a more eccentric orbit with the altitude varying between 440 km and 610 km.
3.2 Radial Profiles
The radial flux profiles can be described by a nearly Gaussian edge towards smaller zenith angles, a peak very near the geometrical horizon position, and a more complex, nearly exponential decay towards larger zenith angles.
The half width of the Gaussian edge is decreasing with increasing energy by about 2∘ per decade in energy (taking into account corrections for the energy dependence of the point spread function) while the peak position converges towards the horizon (110.4∘) starting at about 115∘ at 60 MeV. At about 3 GeV, the peak position becomes indistinguishable from the horizon.
Seen from the Equator, the North and South sectors show no significant difference. The difference between East and West, however, is large. This is expected from the interaction of the cosmic rays with the Earth’s magnetic field and was already observed by previous experiments. The West/East peak ratio increases with energy from approx. 2.5 at 60 MeV to approx. 5.5 at 3 GeV.
3.3 Azimuthal Profiles
The azimuthal flux intensity profile at the horizon shows the Western intensity peak to be very broad with a half width of about 45∘. This feature does not depend significantly on energy.
3.4 Spectra
The gamma-ray spectrum between 60 MeV and 3 GeV (energy bin centers) is generally reasonably well described by a power law. It is hardest (index 1.760.030.05syst) at the horizon peak position and softer both outside and inside (see figure 4). The variation of the spectrum between the four 60∘ sectors (North, South, East, and West) is not significant in this dataset.

References
- (1) Fichtel, C.E., et al., 1975, ApJ, 198, 163
- (2) Galper, A.M., et al., 1982, in Proc. “17th International Cosmic Ray Conference, Paris”, 10, 274
- (3) Gur’yan, Yu.A., et al., 1979, Geomagn. Aeron. (English Translation), 19, 11
- (4) Kraushaar, W.L., et al., 1972, ApJ, 177, 341
- (5) Michelson, P.F., et al., 2001, in Ritz, S., et al. (eds.) “Gamma 2001”, AIP Proc., 587, 713
- (6) Petry, D., 2004, “The DAVE analysis software for EGRET data”
- (7) Thompson, D.J., Simpson, G.A., & Özel, M.E., 1981, J. Geophys.Res., 86, 1265
- (8) Thompson, D.J., et al., 1993, ApJSS, 86, 629