Type Ia SN1999cw: photometric and spectroscopic study
Abstract
The preliminary analysis of the optical data of SN1999cw show that this object has the photometric and spectroscopic behavior of a Type Ia supernova similar to SN1991T, reaching an apparent magnitude at maximum and a .
1Universita’ di Padova, Italy, 2Osservatorio Astronomico di Padova, Italy, 3Universidad de La Laguna, Tenerife, Spain, 4Osservatorio Astronomico di Capodimonte, Napoli, Italy
1. SN 1999cw
SN1999cw was discovered on June ,1999 by Johnson & Li with KAIT telescope, East and South of the nucleus of MCG-01-02-001 (RA= 0h 20m 1s.46 and Dec= -6∘ 20’ 03”.6, J2000), a barred spiral galaxy (SBab), with redshift z= 0.0125 and galactic extinction = 0.154 mag (Schlegel et al, 1998). The preliminary reduction of a DFOSC spectrum showed that it was a peculiar Type Ia supernova (Rizzi et al,1999). Immediately after the discovery, we began to observe SN1999cw collecting data both in optical and infrared wavelengths.
2. Photometry and Spectroscopy
Photometric data have been reduced by using PSF technique by mean of the SNOoPY procedures (Patat, 1995),
which are based on IRAF tasks. The results have been checked and compared with
different photometric reduction methods, namely Daophot and Template Subtraction producing
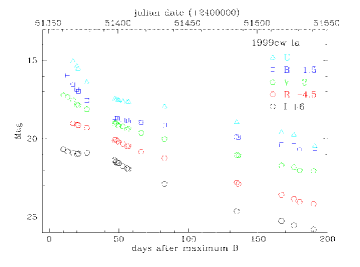
comparable results(Bufano, 2004). The resulting UBVRI light curves are reported in Fig 1.
SN1999cw is well sampled, but it is clear that observations began after
the epoch of maximum light, even if they cover a very long period of
the supernova evolution. Light curves are characterized by a relatively
slow luminosity decline rate and a secondary maximum light in R and I bands.
In order to define the epoch of maximum, we have applied the method by
Altavilla et al (2004), which minimize the value with respect to a number
of templates. The best fit is obtained with slow declining SNe Ia, similar
to SN1991T. In particular, SN1991T and SN1999cw have
same shape and post-maximum decline rate . By overplotting
the light curves, we find that the B light curve maximum occured on
at Thus our observations began five days after maximum light.
By fitting V and R light curves, we obtain
and
To derive the reddening of SN1999cw we used color curve and the
empirical relation of Phillips (1999). We found that SN1999cw did
not suffer of any significant dust absorption inside to the host galaxy.
So the absolute B magnitude is
where and . This value is in good
agreement with the value, mag, computed by using Altavilla’s
empirical relation vs , based on nearby SNe for which distance
can be determinate by Cepheids.
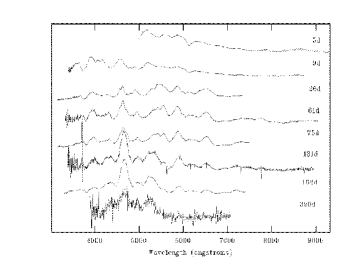
The spectral evolution of SN1999cw is plotted in Fig 1. Because of the lack of information around the maximum, we cannot study the appearance of SiII lines (or other intermediate-mass element lines) typical of the SNe 1991T-like around this phase. The SiII absorption line is already present in the first spectrum, but it is particularly weak. By using our new procedure ”PASSparToo” (Harutyunyan, this conference), we compared SN1999cw spectra with all the data in the Padova-Asiago Supernovae archive and verified that the best fit is with over-luminous Type Ia SNe. By measuring the minimum of the SiII absorption line in the first spectrum, we deduce an expansion velocity v10.700 km/s. In the following spectra, the velocity remained nearly costant, in analogy to the velocity evolution of SN1991T and similar objects (Benetti, this conference).
In conclusion, the preliminary analysis of the optical data of SN1999cw shows that this object has photometric and spectroscopic behavior very similar to SN1991T.
References
Altavilla, G.; Fiorentino, G.; Marconi, M. et al 2004 MNRAS 349,1344
Bufano, F. 2004, Tesi di Laurea
Johnson, R. & Li, W.D. 1999 IAUC.7211
Patat, F. 1995, Tesi di Dottorato
Phillips, M.M.; Lira, P.; Suntzeff, N. et al 1999 AJ 118,1766
Rizzi, L.; Patat, F.; Benetti, S.; Cappellaro, E.; Turatto, M. 1999 IAUC.7216
Schlegel, D.J.; Finkbeiner, D.P.; Davis, M. 1998 ApJ 500,525