The impact of non-LTE effects and granulation inhomogeneities on the derived iron and oxygen abundances in metal-poor halo stars
Abstract
This paper presents the results of a detailed theoretical investigation of the impact of non-LTE effects and of granulation inhomogeneities on the derived iron and oxygen abundances in the metal-poor halo subgiant HD140283. Our analysis is based on both the ‘classical’ one-dimensional (1D) stellar atmosphere models and on the new generation of three-dimensional (3D) hydrodynamical models. The non-LTE calculations presented here have been carried out without inelastic collisions with neutral hydrogen atoms. We find that if non-LTE effects are taken into account when synthetizing the Fe i spectrum in both type of models, then the derived iron abundance turns out to be very similar in both cases. The emergent spectral line profiles in both models are very much weaker in non-LTE than in LTE because the UV overionization mechanism produces a very strong underpopulation of the Fe i levels, in particular in the granular regions of the 3D model. As a result, the non-LTE effects on the derived iron abundance are very important, amounting to dex and to dex in the 3D and 1D cases, respectively. On the other hand, we find that non-LTE and 3D effects have to be taken into account for a reliable determination of the iron abundance from weak Fe ii lines, because the significant overexcitation of their upper levels in the granular regions tend to produce emission features. As a result such Fe ii lines are weaker than in LTE and the abundance correction amounts to dex for the 3D case.
We derive also the oxygen-to-iron abundance ratio in the metal-poor star HD140283 by using the O i triplet at 7772–5 Å and the forbidden [O i] line at 6300 Å. Our 3D results for the oxygen abundance confirm the values reported in some recent investigations. While the oxygen abundance derived from the O i IR triplet is not very sensitive to the presence of granulation inhomogeneities, such 3D effects amount to dex for the [O i] line. The non-LTE abundance correction for the O i IR triplet turns out to be dex, approximately.
Interestingly, when both non-LTE and 3D effects are taken into account there still remains significant discrepancies in the iron abundances derived from Fe i and Fe ii lines, as well as in the oxygen abundances inferred from the O i and [O i] lines. We conclude that the discrepancies could be due to uncertainties in the stellar parameters of this metal poor star. We argue that adopting K (instead of K) and [Fe/H] (instead of [Fe/H]) substantially reduces the discrepancies in the abundances of iron and oxygen inferred from several spectral lines. Under such circumstances we find [O/Fe] at [Fe/H]=. Obviously, our tentative conclusion that the metalicity of this type of metal-poor stars is significantly larger than previously thought may have far-reaching implications in stellar astrophysics.
1 Introduction
Reliable determinations of the oxygen and iron abundances in the atmospheres of metal-poor stars are of paramount importance for 21st Century astrophysics. This is because the abundances of oxygen and iron in metal-poor stars represent fundamental astrophysical quantities for determining the ages of the oldest stars, for constraining the models of the chemical evolution of the Galaxy, for estimating the yields of light elements (lithium, beryllium and boron) from spallation processes in the interstellar and circumstellar gas, for testing different scenarios of nucleosynthesis in supernovae, etc. Such studies largely rely upon the oxygen-to-iron abundance ratio () versus the stellar metallicity [Fe/H].
1.1 The oxygen abundance problem in metal-poor stars
The shape and spread of the [O/Fe] vs. [Fe/H] relation is still hotly debated in the literature (e.g., Israelian et al. 2001; Asplund & García Pérez 2001; Meléndez & Barbuy 2002; Nissen et al. 2002; Fulbright & Johnson 2003; Takeda 2003, and references therein).
The controversy is linked with discordant results obtained using different indicators of the oxygen abundance, such as: i) the oxygen [O i] forbidden 6300 Å line; ii) the oxygen O i infrared triplet at 7772–5 Å; iii) the OH lines in the near ultraviolet; iv) the OH lines in the infrared. More precisely, the oxygen abundance derived using all these lines agree more or less with each other for moderate metal-deficient disk stars having . However, there are clear discrepancies among the results obtained for metal-poor halo stars with lower metallicities. Some authors find that the [O/Fe] ratio shows a plateau between 0.4 and 0.5 dex in the metallicity range -3[Fe/H] (Barbuy 1988; Kraft et al. 1992; Fulbright & Kraft 1999; Asplund & García Pérez 2001; Caretta et al. 2000; Meléndez & Barbuy 2002), while others find a linear increase with decreasing metallicity, reaching [O/Fe] dex at [Fe/H] (Abia & Rebolo 1989; Tomkin et al. 1992; Cavallo et al. 1997; Israelian et al. 1998, 2001; Boesgaard et al. 1999; Mishenina et al. 2000; and references therein). Recently, Nissen et al. (2002) have analyzed [O i] and [Fe ii] lines within the framework of 3D atmospheric models and LTE line formation concluding that there is a quasi-linear trend for [Fe/H], with [O/Fe] dex at [Fe/H]. Furthermore, an extensive 1D re-analysis of published equivalent widths for the O i IR and the forbidden [O i] lines (see Takeda 2003) shows that the discrepancy between O i and [O i] lines in metal-poor halo stars tends to be smaller for stars with higher effective temperatures () and gravities (), i.e. preferentially for dwarfs and subgiants than for giants. Fulbright & Johnson (2003) support this conclusion. In addition, the oxygen abundances in dwarfs derived from the O i IR lines tend to have values between those obtained with the UV OH and [O i] lines.
1.2 The iron abundance problem in metal-poor stars
A key problem directly related with the [O/Fe] issue in metal-poor stars is the reliability of the iron abundance determinations. In fact, the derivation of the iron abundance from Fe i and/or Fe ii lines is a very complex problem that requires detailed non-LTE investigations (hereafter NLTE) like the one carried by Shchukina & Trujillo Bueno (2001) and in this paper. In general, the Fe i lines suffer from UV overionization in the atmospheres of late-type stars (Athay and Lites 1972; Rutten 1988; Shchukina & Trujillo Bueno 2001). This NLTE effect tends to be substantially more important in metal-poor stars than in solar-like stars as a result of the lower electron density and of the weaker UV blanketing (Thévenin & Idiart 1999; Shchukina and Trujillo Bueno 2001; Israelian et al. 2001, 2004; Shchukina et al. 2003). We should mention also that Gratton et al.(1999) concluded that NLTE effects are rather small in metal-poor stars. However, their calculations presumably overestimated the efficiency of inelastic collisions with hydrogen atoms which thermalize the Fe i levels and thus almost restore LTE conditions.
It is of interest to point out that while the Fe i lines are (in principle) expected to be sensitive to the UV overionization mechanism, the LTE approximation is thought to be suitable for weak lines of Fe ii (see, e.g., Asplund et al 1999; Nissen et al. 2002). However, as we shall see below this does not have to be necessarily the case because many subordinate Fe ii lines whose upper levels are of odd parity (starting at ) might be partially filled by emission due to an optical pumping mechanism similar to that investigated by Cram et al. (1980) for the solar case.
1.3 The solar oxygen abundance problem
Obviously, the solar case constitutes a fundamental reference for a reliable quantification of chemical abundances in other stars. The solar iron abundance appears to be fairly well determined now ((Fe)=7.50; see Shchukina & Trujillo Bueno 2001) — that is, it is similar to the meteoritic value. In fact, this is the value adopted by Nissen et al. (2002) in their study of the O/Fe ratio in metal-poor stars.
Great progress has been also made towards a reliable determination of the solar oxygen abundance. The 1D modeling approach leads to discrepancies between the solar oxygen abundance determined from the permitted O i lines and from the [O i] and OH lines. Abundance determinations from OH lines using the 1D model of Holweger & Mller (1974) suggested first a high oxygen abundance value ((O)=8.93; see Grevesse et al. 1984; Sauval et al. 1984; Anders & Grevesse 1989). Several years later, Grevesse & Sauval (1998) obtained an oxygen abundance that was lower by 0.1 dex. This lower value was found after using improved values and a slightly modified 1D model, which helped to remove the existence of a dependency of the derived oxygen abundance with the excitation potential of the lower level of the OH transitions. The forbidden [O i] line gives also a high oxygen abundance value when the contribution of the blend due to a Ni i line is ignored (Lambert, 1978; Sauval et al. 1984; Holweger 2001). However, the permitted O i lines at 7772–5 Å yield a value for the oxygen abundance that is lower by 0.2 dex (Kiselman 1993; Holweger 2001). Some authors have argued that the existing NLTE calculations for these spectroscopic indicators of the oxygen abundance might not be valid due to the neglect of inelastic collisions with hydrogen. For this reason the solar oxygen abundance derived from the [O i] forbidden line was considered as the most reliable one, because of the suitability of the LTE approximation (hence, uncertainties of collisional rates with hydrogen atoms do not play any role). Another argument used to support a high value for the oxygen abundance is the small scatter in the oxygen abundances obtained from different OH lines. Kiselman & Nordlund (1995) tried to clarify the solar oxygen abundance issue by using a 3D solar photospheric model that is similar but less sophisticated than that of Asplund et al. (2000). They concluded that a downward revision of the solar oxygen abundance is required, with respect to the value derived from [O i] and OH lines. More recently, Allende Prieto et al. (2001) have obtained a more precise estimate by taking into account the influence of the above-mentioned blend by the Ni i line and by using the 3D hydrodynamical model of Asplund’s et al. (2000). They found (O)=8.69, which shows that the [O i]-based abundance derived via the 3D approach is significantly lower than that derived from classical 1D model atmospheres.
In a recent IAU Symposium on modeling of stellar atmospheres Shchukina et al. (2003) reported that the oxygen abundance obtained via NLTE synthesis of the solar O i IR triplet in the 3D solar photosphere model of Asplund’s et al. (2000) is (O). This result is in good agreement with both Allende Prieto’s et al. (2001) conclusion and with the recent 3D analysis of Asplund et al. (2004) who found excellent agreement between the averaged oxygen abundance values derived from [O i], O i, OH vibration-rotation and OH pure rotation lines111It is interesting to mention that the oxygen abundances obtained by Asplund et al. (2004) from OH rotational lines using the 3D modeling approach show a large line-to-line scatter, and with sensitivity to the line strength and to the excitation potential of the transition’s lower level. However, such presumably minor discrepancies are not the topic of this paper. Here we restrict ourselves to consider the NLTE determination of the solar oxygen abundance via O i lines, for consistency with similar computations we have carried out for the metal-poor star HD140283..
1.4 Possible reasons for the abundance discrepancies
It is currently believed that abundance discrepancies in metal-poor halo stars and the sun are dominated by deficiencies in the spectral line modeling. Errors in the measurements of equivalent widths are of minor importance with the exception of weak [O i] and Fe ii lines. All abundance indicators in metal-poor stars are to a different degree sensitive to the adopted stellar parameters (, and [Fe/H]). They have to depend also on atmospheric properties such as the temperature gradient and the ratio of the line to continuous opacity. Large uncertainties could result from neglecting atmospheric inhomogeneities and velocity fields (i.e., granulation inhomogeneities produced by the stellar surface convection process). Part of the discrepancies are probably due to NLTE effects. There is now an abundance of literature concerning the iron and oxygen line formation problems in classical plane-parallel stellar atmospheric models (Thévenin & Idiart 1999; Mishenina et al. 2000; Kiselman 2001; Takeda 2003; and references therein). The recent generation of 3D hydrodynamical models of stellar atmospheres have activated the present debates on the influence of granulation inhomogeneities and of NLTE effects on the determination of chemical abundances in metal-poor stars (see Asplund et al. 1999; Asplund and García Pérez et al. 2001; Shchukina & Trujillo Bueno 2001; Nissen et al. 2002; Asplund et al. 2004). In this respect, it is very important to emphasize that the 3D hydrodynamical simulations of Asplund and coworkers show that the atmospheres of metal-poor halo stars may have substantially lower kinetic temperatures than the radiative equilibrium temperatures of the ‘classical’ theoretical 1D model atmospheres of Kurucz (1993) and the MARCS collaboration (Gustafsson et al. 1975).
1.5 Motivation
The previous discussion makes evident that detailed, 3D+NLTE investigations of the iron and oxygen abundances are urgently needed. However, it is crucial that this type of analyses are carried out jointly for iron and oxygen, and using the same set of atmospheric models, continuum opacity package and radiative transfer code. The present paper presents the results of such an investigation. We study the NLTE formation problem of the Fe i, Fe ii and O i lines in a 3D hydrodynamical model of the atmosphere of the metal-poor star HD140283. This classical halo subgiant is widely used for studies of the very early Galaxy and the origin of the chemical elements. In order to quantify the impact of 3D simulations on the abundance determinations in HD140283 we carry out a detailed comparison with the 1D classical modeling. To this end, we use the 3D hydrodynamical atmospheric model of Asplund’s et al. (1999) for the star HD140283, as well as a suitable grid of Kurucz’s 1D models. Moreover, we evaluate the extent to which 3D+NLTE effects influence the determination of the stellar parameters of this metal-poor subgiant.
Our paper considers also the case of the Sun as a reference for stellar abundance determinations with emphasis on the solar oxygen abundance derived from the O i IR triplet. As in our NLTE+3D analysis of the solar iron abundance (Shchukina & Trujillo Bueno 2001) we investigate here the solar oxygen abundance problem by using the same 3D hydrodynamical solar granulation model.
2 The diagnostic method
In order to determine the stellar abundances of iron and oxygen we have to compare some of the properties of the observed spectral line profiles (e.g., their equivalent widths) with those calculated via the numerical solution of the radiative transfer equation in a given model of the atmosphere of the star under investigation. To this end, we have used the same NLTE code and strategy that we applied in our previous investigation of the iron line formation problem in a 3D hydrodynamic model of the solar photosphere (see Shchukina & Trujillo Bueno 2001), with the only difference that we have now computed flux profiles. Our 3D strategy for investigating the issue of the abundances of iron and oxygen in the metal-poor star HD140283 is similar to that of described by Shchukina & Trujillo Bueno (2001) for solar-like atmospheres, but using a 3D snapshot model from Asplund’s et al. (1999) stellar surface convection simulation. Therefore, we have neglected the effects of horizontal radiative transfer on the atomic level populations -that is, we have used the so-called 1.5D approximation. As discussed by Shchukina & Trujillo Bueno (2001) this is expected to be a good approximation for determining the stellar iron abundance from Fe i and Fe ii lines. Kiselman & Nordlund (1995) already demonstrated that it is also a good approximation for the oxygen IR triplet.
Our NLTE code is based on very efficient iterative methods (Trujillo Bueno & Fabiani Bendicho 1995; Socas-Navarro & Trujillo Bueno 1997; Trujillo Bueno 2003) that were developed to facilitate radiative transfer simulations with complex atomic systems in realistic stellar atmospheric models. We have carried out both LTE and NLTE spectral line syntheses by using both the 1D and 3D models mentioned below. In each case, the abundances of iron and oxygen are modified iteratively till achieving the best fit to the observations.
3 The observations
We have chosen 33 Fe i and 15 Fe ii lines for our 3D and 1D determinations of the iron abundance in the halo subgiant HD140283. The equivalent widths () of all the Fe i lines and of 11 Fe ii lines were obtained from high-resolution spectra observed a few years ago with the Harlan J. Smith 2.7m telescope at McDonald observatory (R. García López, private communication; see also Allende Prieto et al. 1999). The equivalent widths () for the remaining 4 Fe ii lines are taken from Table 3 of Nissen et al. (2002). They are weak lines with in the range 14 mÅ . Their wavelengths are Å. The iron lines used in our analysis are listed in Table 1.
The O i IR triplet lines in the metal-poor star HD140283 are weak. Given uncertainties in the measurements we have averaged their equivalent widths over three sets of observations (Abia & Rebolo 1989; Tomkin et al. 1992, and G. Israelian, private communication). The resulting equivalent widths of the 7772, 7774 and 7775 Å lines used in our oxygen abundance determinations are 7.9, 4.8, 3.4 mÅ, respectively. The equivalent width of the forbidden [O i] 6300 Å line ( mÅ) has been taken from Nissen’s et al. (2002) paper. The oxygen line data are specified in Table 1.
Measurements of the equivalent widths of the solar O i IR lines tend to have an uncertaintly of 5%. Therefore, we have used averaged values of five sets of observations at the solar disk centre (Jungfraujoch atlas of Delbouille et al. 1973; Gurtovenko & Kostik 1989; Altrock 1968; Mller et al. 1968; King & Boesgaard 1995). The resulting averaged solar equivalent widths for the 7771.96, 7774.18 and 7775.40 Å lines are 81.6, 70.4, 57.2 mÅ, respectively.
4 The atmospheric models
In each case (i.e., the solar and the metal-poor star) we have used a single 3D snapshot model taken from realistic radiation hydrodynamical simulations of stellar surface convection (Stein & Nordlund 1998; Asplund et al. 1999, 2000). Such time-dependent simulations have no adjustable free parameters, since they are based on the numerical solution of the equations of mass, momentum and energy conservation for given values of the effective temperature (), surface gravitational acceleration () and chemical composition. In order to facilitate the radiative transfer calculations the original snapshots, which have 82 gridpoints along the vertical direction, were interpolated to grids of and points for the solar and metal-poor star cases, respectively. The improvement in the vertical resolution (i.e., with 102 and 121 gridpoints sampling the line and continuum forming regions) was introduced to enhance the accuracy of the NLTE calculations.
The solar 3D model is that described by Asplund et al. (2000). This 3D model of the solar photosphere has been used by Shchukina & Trujillo Bueno (2001) in their NLTE investigation of the solar iron abundance. We have also used it to determine the solar oxygen abundance via NLTE analysis of the O i IR triplet at 7772–5 Å.
Information on the corresponding 3D model for the star HD140283 can be found in Asplund et al. (1999). The adopted stellar parameters were , K and [Fe/H]=-2.5, which result from the infrared flux method (IRFM) for , from Hipparcos parallaxes for and from published values for the [Fe/H] (see Asplund et al. 1999). In our differential comparison between the results obtained via the 1D and 3D approaches we have used atmospheric models characterized by the same stellar parameters (, and [Fe/H]). In Sect. 8 we will also show results in a grid of ‘classical’ 1D models spanning the range , , .
5 The atomic models
In our spectral synthesis of oxygen and iron lines we adopted the quantum-mechanical approach developed by Anstee & O’Mara (1995); Barklem & O’Mara (1997), and Barklem et al (1998) for the Van der Waals collisional broadening. In the following subsections we provide some information about the atomic models of oxygen and iron we have used for our radiative transfer calculations.
5.1 Oxygen
Our atomic model for oxygen is based on the data of Carlsson & Judge (1993). It has 23 O i fine structure levels and one O ii level. We considered 31 bound-bound and 23 bound-free radiative transitions. The O i Grotrian diagram has a helium-like structure. The triplets and the quintets are only weakly coupled to each other. The two systems differ in one important aspect: the triplets are connected to the ground state by strong resonance lines, while the quintets are not. The latter form a separate system with the level acting as a ground level and the 7772–5 Å IR triplet as resonance lines. O i levels have hydrogen-like energies. As a result, there is an important wavelength coincidence of the O i 1025 Å line with the hydrogen line. We emphasize that the NLTE results for O i are quite insensitive to including additional levels and transitions (Shchukina 1987; Kiselman 1993; Takeda 2003). In agreement with previously published results we have found that the effects of the coupling between the triplet and quintet systems, pumping, and the binding of CO molecules are marginal in the stellar atmospheres studied here (see Shchukina 1987; Kiselman 1993; Carlsson & Judge 1993; Kiselman & Nordlund 1995).
5.2 Iron
Our model atom for Fe iFe iiFe iii is similar to that used by Shchukina & Trujillo Bueno (2001). It has 225 Fe i levels, 23 Fe ii levels and 1 level for Fe iii including their multiplet fine structure. The Fe i levels are interconnected by 330 bound-bound radiative transitions, while we have 25 strong radiative transitions among the Fe ii levels. All levels are coupled via collisional transitions with electrons. The Fe i term diagram is, in fact, complete up to an excitation potential eV. At higher energies it contains about 50% of the terms that have been presently identified. Each term of our atomic model is coupled to its parent term of the next ionization stage by photoionization transitions. For most of the Fe i terms that have 5 eV we used the experimental photoionization cross sections given by Athay & Lites (1972). For the rest of them, and also for the Fe ii terms, the hydrogen-like approximation was used. 222It is interesting to mention that the new radiative cross-sections of Bautista (1997) are substantially larger than those given by the hydrogenic approximation. Therefore, in what respects the influence of photoionization cross sections, we might perhaps be underestimating the NLTE effects.
In our calculations we have not included inelastic collisions with hydrogen atoms. We have also neglected the UV haze opacities. We have carried out several numerical experiments in order to investigate how large could be the uncertainties in the iron abundance determinations due to uncertainties in the hydrogen collisional rates, in the UV haze opacity and in the bound-free cross sections. Considering all factors together we have found that the uncertaintly for the solar iron abundance does not exceed 0.07 dex (see Shchukina & Trujillo Bueno 2001). The problem of the iron abundance uncertainty for the metal-poor star HD140283 is discussed in Section 8.
6 The oxygen abundances
In this section we report on the results we have obtained for the oxygen abundance in the sun and in the metal-poor star HD140283. Our abundance determinations and some recent abundance studies by other authors are briefly summarized in Tables 2 and 3.
6.1 The Sun
We have derived the abundance of oxygen in the solar photosphere by fitting the observed disk centre profiles and equivalent widths of the O i IR triplet via spectral synthesis in the 3D model of the solar photosphere. Taking into account NLTE effects we find (see also Shchukina et al. 2003), while the LTE approximation gives . Note, that the uncertainties reflect the line-to-line scatter for the OI IR triplet lines. In both cases we obtained an almost perfect fit to the observed disk centre profiles and equivalent widths. Our NLTE result is in good agreement with that obtained by Allende Prieto et al. (2001) from the forbidden [O i] 6300 Å line (). It is also consistent with the 3D result of Asplund at al. (2004) for the OH lines () and with their full 3D+NLTE result for the O i triplet (). It is important to note that the small discrepancy between ours and Asplund’s et al. (2004) solar abundance value derived from the O i IR triplet is mainly due to differences in the oscillator strengths used ( dex). The oxygen abundance changes that result from a 5% uncertainty in the solar equivalent width measurements of these spectral lines lie in the same range ( dex).
The NLTE formation of the O i triplet can be easily understood via a two-level atom approach if the line opacity is calculated assuming LTE (Shchukina 1987; Kiselman 1993; Kiselman & Nordlund 1995; Takeda 2003; Shchukina et al. 2003, Asplund et al. 2004, and references therein). The photon losses mechanism lowers the line source functions both in the granular and intergranular regions of the 3D model, which implies that the NLTE profiles of the IR triplet lines are deeper than in LTE. The effect is larger in the intergranular regions, but the spatially averaged emergent profiles are only slightly affected by the granulation inhomogeneities. Consequently, the effects of granulation inhomogeneities on the NLTE solar oxygen abundance determination are small, i.e. dex (Shchukina et al. 2003). More significant are the NLTE abundance corrections for the O i infrared triplet lines observed at the solar disk centre, which amount to , , dex for Å, respectively — that is, the LTE approximation tends to overestimate the derived oxygen abundance. Such NLTE effects are very similar to those reported by Asplund et al. (2004), which result from full 3D+NLTE computations.
6.2 The metal poor halo subgiant HD140283
It is convenient to begin this section by giving the values of the oxygen abundances we have obtained without assuming LTE when using the 1D and 3D models of this metal poor star. As mentioned above, both models are characterized by , K and [Fe/H]. The 1D model gives for the O i IR triplet, while for the [O i] forbidden line at 6300 Å. Concerning the 3D-based determination we find when using the O i IR triplet, but for the [O i] line. Our 1D results differ slightly from those presented by Nissen et al. (2002), probably because we have not used the same continuum opacity package and/or identical 1D atmospheric models. Our estimates indicate that the abundance differences could reach dex.
Having given these values, it is now of interest to note that the NLTE effects in the 1D and 3D atmospheric models of this metal poor star are not negligible, but smaller than in the solar case because the O i IR lines originate in deeper layers where their source functions and the level populations of their upper levels are closer to their LTE values (Shchukina et al. 2003). Adopting LTE for the O i lines leads to an abundance overestimation of 0.18 and 0.16 dex for the 1D and 3D cases, respectively. The determination of the oxygen abundance based on the O i IR triplet is nearly insensitive to 3D effects. The correction does not exceed 0.03 dex.
On the contrary, the forbidden [O i] line at 6300 Å is sensitive to the stellar atmospheric inhomogeneities. In agreement with Nissen et al. (2002) we find that a 3D analysis reduces the oxygen abundance derived from this forbidden line by dex. The NLTE correction is extremely small ( dex).
7 The iron abundance
This section focusses on the iron abundance in the Sun and in HD140283. Our results and a comparison with those of recent publications are given in Tables 2 and 3.
7.1 The Sun
Shchukina & Trujillo Bueno (2001) applied a 3D+NLTE approach to determine the solar iron abundance from 18 Fe i lines that were carefully selected. Ideally, one would like to determine the iron abundance in the Sun and HD140283 employing the same Fe i line list. However, due to the relatively high solar metallicity the solar spectral lines at wavelengths below 5000 Å are much more affected by blends than in the metal-poor star HD140283. As a result, overlapping wings of nearby strong lines cause large uncertainties in the equivalent width measurements of most of the solar Fe i lines listed in Table 1. The only exception are the lines at Å (i.e. only 8 Fe i lines from 33 ones). In any case, the main reason why not the same lines can be used in the Sun and HD140283 is that the line strengths are vastly different in the two cases. Therefore, the weak iron lines in HD140283 are very strong and therefore ill-suited for abundance purposes in the Sun. Thus, to recalculate the iron abundance of the Sun using the lines of Table 1 is hardly possible.
The solar Fe I lines used in our 3D solar abundance determination (see Table 1 in Shchukina & Trujillo Bueno 2001) were selected from the well-known “Kiel+Oxford” line list according to the criteria discussed by Kostik, Shchukina & Rutten 1996. The lines chosen by Shchukina & Trujillo Bueno (2001) account for the iron abundance behaviour versus the lower-level excitation potential -that is, for the existence of both an abundance dependence on and a sizable scatter in the abundance values for each . Such 18 representative Fe i lines yield the largest and lowest abundances for each -value and spaning a large range in which goes from 0 to 4.6 eV. This should be a very suitable choice of lines in order to evaluate the largest 3D effects. Shchukina & Trujillo Bueno (2001) obtained a Fe abundance (Fe)=7.50 for the 3DNLTE case. The 3D+LTE approach gives a lower abundance, i.e. (Fe)=7.43. Neglecting the effect of granulation inhomogeneities leads to a considerably larger value ((Fe)=7.62; e.g. Kostik et al. 1996).
We stress that the Fe i lines we have used for the star HD140283 were chosen to obtain a combination of lines that is comparable to that provided by the 18 solar lines (concerning their equivalent widths and coverage).
7.2 The metal-poor halo subgiant HD140283
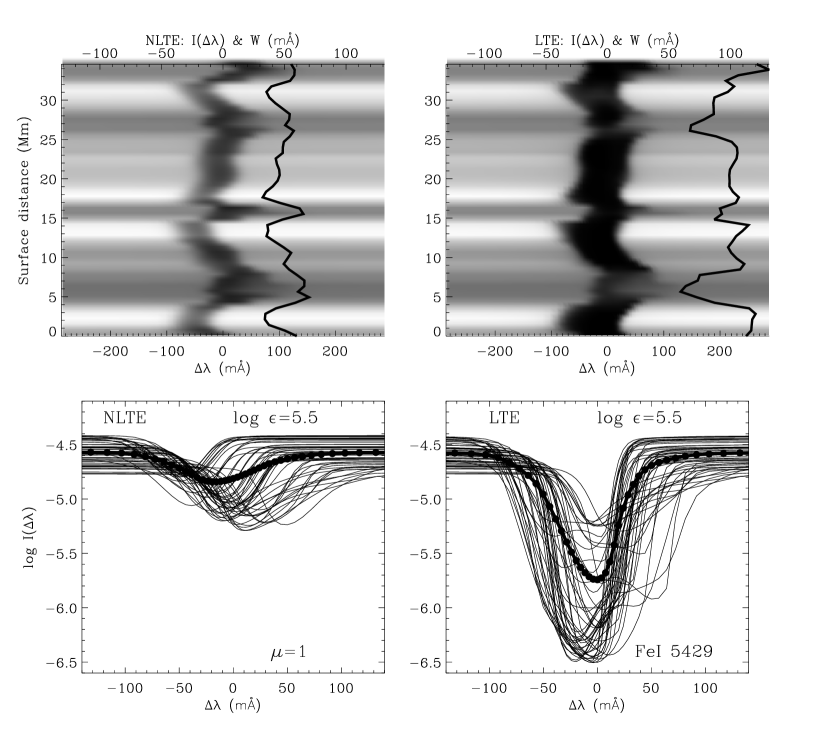
Like in the solar case (Shchukina and Trujillo Bueno 2001), near-UV overionization appears to be the main NLTE mechanism for Fe i in this metal-poor star. Both in the 1D and 3D models it causes an important underpopulation of the Fe i levels and hence a reduction in the opacity of the Fe i lines (Fig. 1, left panel). As a result, the atmospheric heights where the line optical depth reaches unity are shifted toward deeper layers where the line source functions turn out to be close to the Planck function. The relevance of this effect increases with the vertical temperature gradient, which is larger above the granules. For this reason, we find a strong weakening of the Fe i lines that emerge from such granular regions, while above the intergranular lanes the emergent spectral line profiles do not change appreciably. On the whole, the calculated NLTE profiles turn out to be much weaker than when the LTE approximation is used (see Fig. 2).
Concerning NLTE effects in Fe ii lines it is very important to point out that in the granular regions we find a significant overpopulation of the excited levels of odd parity starting at (Fig. 1, right panel). According to Cram et al. (1980) and Rutten (1988) this effect is caused by an excess in the UV continuum radiation field near 2600 Å, which leads to a pumping of the upper level populations of the Fe ii lines. As a consequence, the source functions of the Fe ii lines with high excitation energy of the upper level ( ev) exceed significantly the Planck function values. This implies that such Fe ii lines are weaker than stipulated by the LTE approximation and may even be in emission instead of in absorption. This radiative pumping mechanism takes place in both the 1D and 3D models. Like in the case of Fe i lines it is sensitive to the vertical temperature gradient. The steeper the gradient, the larger the pumping. As a result, in the granular regions where the temperature gradients are larger the effect is much more pronounced (see Fig. 1).
The importance of such an effect is illustrated in Fig. 3, which shows both NLTE and LTE results for two Fe ii lines using the 3D model atmosphere of the metal-poor subgiant HD140283. We point out that emission is much more pronounced for the emergent profiles that originate above the stellar granular regions, while above the intergranular lanes the spectral line profiles are hardly modified with respect to the LTE case. Allowing for departures from LTE produces a drastic change in the calculated spatially averaged flux of the weak Fe ii 6247.56 Å line in the 3D model: the absorption profile is replaced by one in emission. Note, that this spectral line is taken from the set of weak Fe ii lines that Nissen et al. (2002) assumed to be insensitive to NLTE effects. However, we find that such type of lines do suffer from the above-mentioned UV pumping mechanism because all of them belong to the aforementioned category of lines, i.e. their upper levels are of odd parity and are situated above the -level. The stronger Fe ii 5316.62 Å line displayed in Fig. 3 is also from this category. Figure 3 clearly demonstrates that the stronger the spectral line the smaller the relative effect of the UV-pumping. For this line emission arises only at the core of the “granular” profiles. Spatial averaging masks completely such an emission, but makes the flux profile weaker than in LTE. It is also of interest to mention that in the 1D stellar atmosphere model departures from LTE produce similar changes in the Fe i and Fe ii lines but they are less pronounced than in the 3D case. For instance, the flux profile of the weak Fe ii 6247.56 Å line turns out to be in absorption for the 1D+NLTE case.
How large could be the impact of UV-overionization and UV-overexcitation on the iron abundance determination in the star considered? It is obvious that in order to compensate for a weakening of the emergent spectral line profiles in the stellar atmosphere model under consideration the iron abundance must be increased in comparison with the LTE case. Figure 4 quantifies this conclusion. It shows the LTE versus NLTE iron abundances derived from either Fe i or Fe ii lines in the 3D and 1D stellar atmospheric models of the metal poor star HD140283. As seen in the figure, the NLTE abundance corrections for the Fe i lines are extremely large in the 3D model ( dex) and a bit smaller in the 1D case ( dex). On the other hand, it is very important to point out that NLTE effects on the iron abundance are most pronounced for the weak Fe ii lines. The four lines used by Nissen et al (2002) for their iron abundance determinations reveal strikingly large deviations from LTE. On average, the NLTE abundance corrections for the Fe ii lines increase from dex in the 1D case to dex in the 3D model.
When NLTE effects are taken into account we find no difference between the mean Fe i-based abundances obtained via the 1D and 3D models (). Therefore, when NLTE effects are taken into account the Fe i lines formed in the 3D model are hardly sensitive to granulation inhomogeneities. However, for the Fe ii lines the 3D abundance correction (3D+NLTE 1D+NLTE) is significant — that is, 0.26 dex.
When the LTE approximation is used the mean iron abundance obtained via spectrum synthesis of Fe i lines in the 3D model is lower than for the 1D case (cf. Asplund et al. 1999; Nissen et al. 2002). The differences between the 1D and 3D determinations depend on the lower excitation potential of the spectral line under consideration. They range from dex at eV to dex at eV, while the mean difference is smaller ( dex). In contrast, on average the Fe ii lines are insensitive to 3D effects when LTE is assumed.
8 Revising the stellar parameters
There are several discrepancies indicating that the iron abundance obtained in Sect. 7.2 for the star HD 140283 cannot be considered as reliable, neither in the 1D case nor in the 3D case. For example, we have (1) a divergence of the average abundances derived from both ionization stages, (2) a correlation of the abundances derived from Fe i lines with the lower-level excitation potential and (3) a large scatter in the abundances derived from Fe ii lines (particularly, the weak ones). The elimination of any of such discrepancies cannot be simply achieved in terms of uncertainties in observed equivalent widths, oscillator strengths, inelastic electron collisional rates and photoionization cross sections. Our numerical experiments show that the typical errors introduced by uncertainties in such quantities do not exceed 0.1 dex (see Shchukina and Trujillo Bueno 2001). The iron abundance error that results from neglecting the UV haze opacity for the metal-poor star HD140283 is even smaller than 0.1 dex. In our opinion, a reasonable possibility for explaining the reported discrepancies is to revise the stellar parameters of the subgiant HD140283.
In this section we aim at finding the “best-choice” of stellar parameters for the star HD140283, both for the NLTE and LTE cases. It is important to emphasize from the outset that in our NLTE computations we have neglected inelastic collisions with neutral hydrogen atoms for excitation and ionization. At present, there are no reliable values for the ensuing collisional rates. The often-used classical Drawin (1968) formula leads to very uncertain estimates and to a substantial overestimation of the collisional rates when detailed quantum mechanical and/or laboratory data is available, such as for Li and Na (see Biberman et al. 1987; Lambert 1993; Holweger 1996; Barklem et al. 1998, 2003; Belyayev et al. 1999; Shchukina & Trujillo Bueno 2001; Asplund et al. 2004), which explains why the conclusions of Gratton et al. (1999) have been critized. Obviously, inelastic collisions with neutral hydrogen atoms would tend to reduce the NLTE effects. Therefore, the difference between the NLTE and LTE iron abundances may be considered as the maximum effect that inelastic collisions might produce. In our opinion, the tentative conclusion of Korn, Shi & Gehren (2003), achieved via a 1D+NLTE analysis, that hydrogen collisions might be efficient in the atmosphere of HD140283 needs to be re-investigated in the light of 3D hydrodynamical models because, as pointed out by these authors, the lower temperatures of the 3D models would alleviate their need of invoking thermalizing collisions to counterbalance photoionization.
Our analysis for the revision of the stellar parameter is based on the following criteria:
i) the average abundances obtained from Fe i and Fe ii lines have to be equal.
ii) the “best choice” solution has to give the minimum mean standard deviation () for the abundances derived from Fe i and Fe ii lines.
iii) abundances have to be independent of the lower excitation potential (). We restrict ourselves to revise only the metallicity and the effective temperature. The given surface gravity of the star HD140283 is reliable, since it has been obtained from accurate Hipparcos parallaxes.
Figure 5 helps us to find the “best-choice” of stellar parameters for the star HD140283. The left panels show the variation of the Fe i and Fe ii abundances with metalicity, , and in a suitable grid of 1D model atmospheres. Our results clearly demonstrate that changes in seriously affect the Fe i-based abundances. However, such changes in are unimportant for abundance determinations from Fe ii lines. On the other hand, the Fe ii-based abundances are slightly sensitive to the changes in , which is not the case for the abundances obtained from Fe ii lines. In addition, the dependence on metallicity is more pronounced for Fe i lines, while for Fe ii lines there is no such a variation. It is interesting to note that when LTE is assumed, then only the correlation of the inferred Fe i abundances with is present.
8.1 Stellar parameter determinations: 1D case
Consider first the 1D+LTE modeling case for the iron lines. Figure 5 (middle panel to the lhs) and Fig. 4 (bottom panel to the rhs) show that in this case identical abundances from both Fe i and Fe ii lines could be obtained around close to 5700 K. In fact, our detailed analysis gives K and [Fe/H]. With these stellar parameters Fe ii-based abundances turn out to be insignificantly scattered ( dex) around the average value. However, the abundances derived from Fe i lines show a sensitivity to the lower-level excitation potential () that is similar to the trend seen in the bottom panel to the rhs of Fig. 4.
Secondly, consider the 1D+NLTE modeling case. In order to reach a good agreement between NLTE abundances derived from Fe i and Fe ii lines we would have to reduce the effective temperature down to K and to increase the stellar metallicity up to [Fe/H]. With such stellar parameters the -dependence of the Fe i abundances vanishes. However, the abundances derived from Fe ii lines become undesirably spread around the mean value ( dex).
8.2 Stellar parameter determinations: 3D case
In order to achieve a reasonable estimation of the “best choice” of stellar parameters the curves of Fig. 5 (left panels) have to be corrected for the 3D effects of granulation inhomogeneities. This means that we need to know how the 3D abundance corrections change with [Fe/H], and for both the LTE and NLTE cases. Unfortunately, a suitable grid of 3D models for several effective temperatures and metalicities similar to that provided by Kurucz for the 1D case is not yet available, besides the fact that NLTE computations in 3D are presently very computationally costly. However, we can try to estimate the true stellar parameters of the star HD140283 via the following strategy, which is inspired by our conclusion that 3D effects are important for the Fe i lines only if LTE is assumed and that 3D effects are relevant for the Fe ii lines only when we allow for departures from LTE.
Firstly, let us choose the 3D+LTE modeling approach. As we have seen, if LTE is assumed then the Fe i lines are sensitive to the 3D effects while the Fe ii lines are not. Therefore, if the LTE approximation is used it is much safer to revise the stellar parameters via iron abundances derived from Fe ii lines. We find and [Fe/H] (see the bottom panel to the rhs of Fig. 4).
Secondly, consider the 3D+NLTE approach. It is obvious that in this case we better avoid the use of Fe ii lines because we have shown that they are sensitive to both 3D and NLTE effects. However, we have demonstrated also that at least for the available 3D model of the star HD140283 the NLTE iron abundance derived from Fe i lines is very similar to that obtained via the 1D+NLTE modeling approach. For this reason, we think that we can estimate the true stellar parameters by choosing Fe i lines and a 1D+NLTE modeling approach. We find that the standard deviation minimizes at K and [Fe/H]. Now the mean iron abundance turns out to be . Moreover, the dependence of the derived iron abundances with becomes negligible.
8.3 Uncertainties in the determination of the stellar parameters and the oxygen abundance
As we have just seen, depending on the approach used for modeling the iron lines we get four “best choice” sets for the stellar parameters of the star HD140283, with in the range K and [Fe/H] between and (see Table 4). How large could be the impact of such uncertainties in the stellar parameters of the star HD140283 on the determination of the oxygen abundance? The right panels of Fig. 5 clarify this issue. We can see that when 1D models are used then both the O i and [O i]-based abundances are sensitive to changes in , but not too much to changes in and/or in metallicity. The sensitivity of the NLTE abundance corrections to these parameters ( and metallicity) is much smaller. On average, they vary between 0.17 and 0.19 dex for O i lines, while it is negligible for the [O i] line ( dex). Our 1D+NLTE modeling of oxygen lines shows that abundances derived from O i and [O i] lines give the same value (i.e., ) for K. We now point out that among our “best choice” sets of stellar parameters only one has a -value ( K) which considerably deviates from that with 5650 K. Such relatively low value for the effective temperature (i.e., K) causes a large disagreement between the NLTE O i and [O i]-based abundances amounting to dex. Moreover, as we have indicated above the set of parameters K and [Fe/H] produces an unpleasant scatter of the Fe ii-based abundances around the mean value. In view of these factors we think reasonable to eliminate such particular set of stellar parameters.
The remaining three sets of stellar parameters, i.e. K & [Fe/H], K & [Fe/H], and K & [Fe/H], correspond to the case of 1D+LTE modeling for both Fe i and Fe ii lines, to 3D+LTE modeling of Fe ii lines, and to 3D+NLTE modeling of Fe i lines, respectively. It is important to note that this range of effective temperatures is similar to the typical uncertainty in the determination of via the application of the infrared flux method. The small differences in the effective temperature implies a rather small oxygen abundance variation. In particular, our 1D+NLTE oxygen abundance determination from the O i IR lines using the former set gives , while the latter set leads to . For the [O i] line we get and , respectively.
We must consider now how the dependencies shown for the oxygen lines in the rhs panels of Fig. 5 are going to be modified due to the effect of granulation inhomogeneities. As mentioned above, a major obstacle to investigate this point is the lack of a suitable grid of 3D models. In any case, this 3D issue concerns especially the [O i] line given its significant sensitivity to granulation inhomogeneities. According to Nissen et al. (2002) the main effect is due to differences in the continuum opacities between the 1D and 3D models. Since the opacity is provided primarily by atoms the strength of the weak [O i] line turns out to be inversely proportional to electron density. In the 3D hydrodynamical model of the star HD140283, which has been obtained assuming K and [Fe/H], the deficit of electrons is particularly large in the cool surface layers of the granular regions, while it is less pronounced in both the intergranular plasma and in the 1D model. As a result, the spatially averaged equivalent width of the [O i] line in such a 3D model increases and, consequently, the derived oxygen abundance decreases in comparison with the 1D modeling result. Obviously, the 3D correction obtained in Sect. 6.2 for this forbidden line assuming that the stellar parameters are K and [Fe/H] cannot be used for the 3D+NLTE case with lower effective temperature ( K) and higher metalicity ([Fe/H]).
As pointed out by Asplund et al. (1999) the deficit in the number density of electrons depends mainly on the metalicity. 3D hydrodynamical simulations for higher [Fe/H] values will have larger surface temperatures and electron densities. Thus, one can expect that at [Fe/H] the 3D abundance correction for the [O i] line has to be smaller. Obviously, the exact value of such corrections will have to await the development of a new 3D model for the revised stellar parameters. It should be noted that such a sensitivity to 3D effects may be assumed also for the UV lines of OH. However, the impact on 3D abundance corrections when changing the metallicity from to seems to be rather small if we suppose that the results obtained by Asplund & García Pérez (2001) for dwarfs can be applied to the subgiant HD140283 (see their Table 2, which shows that the 3D effects on the UV lines of OH is at [Fe/H] and at [Fe/H]). The additional conclusion that follows from their Table 2 is a high sensitivity of the oxygen abundances derived from the OH molecules to the metallicity of the star. As a result, a 3D model with higher metallicity ([Fe/H]) might bring the oxygen abundances derived from molecules ( for ) to closer agreement with the abundance derived from the O i triplet ( for K.)
An extra problem is related with observations of the [O i] line in the star HD140283. According to Nissen et al. (2002) this weak line ( mÅ) is blended with a stronger line ( mÅ). These authors estimated that the available equivalent width measurements have an uncertainty of mÅ . Such an uncertainty is very large, because it is about 50% of the observed equivalent width, and implies an uncertainty of dex in the derived oxygen abundance (Fig. 5, middle right panel).
Alternatively, in a first approximation we could neglect the sensitivity of the O i lines to the granulation inhomogeneities. Furthermore, the observation errors for these lines in HD140283 are relatively small. For example, the observed equivalent widths of the O i triplet that have been published in the literature (Abia & Rebolo 1989; Tomkin et al. 1992; Nissen et al. 2002; G. Israelian, private communication), and which we have used in our investigation, differ by about mÅ. Their impact on the derived oxygen abundance lies in the range dex (Fig. 5, middle right panel). It is clear that the O i lines seem to be the most reliable lines for deriving the oxygen abundance in the star HD140283.
Therefore, when the stellar parameters are revised neglecting 3D and NLTE effects for the iron lines, and when the oxygen abundance derived from the O i lines is corrected for NLTE effects, then the mean value of the oxygen-to-iron ratio seems to be [O/Fe] at [Fe/H]=. This value is in good agreement with the quasi-linear trend of [O/Fe] vs. [Fe/H] obtained by Nissen et al. (2002) using standard 1D modeling. However, the key point to keep in mind is that a 3D+NLTE modeling of the O i IR triplet (using the 3D+NLTE stellar parameters derived from the Fe i lines) would give [O/Fe] at [Fe/H]=. Obviously, the analysis of a single metal-poor star is not enough to opt for one of the following two possibilities: (a) a linear rise in the [O/Fe] ratio vs. metallicity (see, e.g., Fig. 11 of Israelian et al. 2001) or (b) a plateau between 0.4 and 0.5 dex in the metallicity range -3[Fe/H]. 333We point out that with the stellar parameters used by Asplund et al. (1999) for the 3D modelling of the star HD140283 (i.e., and [Fe/H]=) the NLTE oxygen abundance () derived from the O i IR triplet and the NLTE Fe i-based iron abundance () leads to a small oxygen-to-iron ratio ([O/Fe] dex). Moreover, there is no overabundance of oxygen at all if one uses the [O i]-based abundance. It is also of interest to mention that in our preliminary study (see Shchukina et al. 2003) we obtained a slightly larger value for [O/Fe] because we used a smaller number of Fe i lines. However, we think that our investigation indicates the “road to be taken” towards the resolution of the problem.
9 Conclusions
We have derived the solar oxygen abundance from the O i IR triplet using Asplund’s et al. (2000) 3D hydrodynamical model of the solar photosphere and a NLTE modeling approach. We find , which is in good agreement with the determinations of Allende Prieto et al. (2001), Shchukina et al. (2003) and Asplund et al. (2004). Actually, if for the O i IR triplet we use the same oscillator strengths adopted by Asplund et al. (2004) we then obtain a value very similar to that reported by them (i.e., ).
In agreement with previous investigations, we confirm that LTE synthesis of Fe i lines in the 3D hydrodynamical model of this star gives flux profiles significantly different from those obtained in a 1D model for the same stellar parameters. However, when the LTE approximation is used for the synthesis of Fe ii lines we find negligible differences between the 1D and 3D cases.
The differences between the iron abundances obtained from Fe i lines when assuming LTE in the 1D and 3D models of the star HD140283 turn out to depend on the lower excitation potential of the spectral line under consideration. The NLTE abundance corrections for Fe i lines are significant, especially for the low-excitation lines in the 3D model.
We have three particularly important results concerning the determination of the iron abundance in metal poor stars like HD140283:
(1) If NLTE effects are taken into account when synthetizing the Fe i lines in the 1D and 3D models of this star, then the derived iron abundance turns out to be practically the same in both cases.
(2) Contrary to a generally accepted belief, the Fe ii lines turn out to be significantly affected by NLTE effects. In particular, a full NLTE modeling should be carried out for the Fe ii lines with upper levels of odd parity starting from , and especially the weaker lines.
(3) The iron abundance of the star HD140283 is estimated to be dex higher than previously thought.
For the O i IR triplet the NLTE correction of the oxygen abundance in the 1D and 3D models is practically the same and less than 0.2 dex. Such a NLTE correction is negligible for the [O i] line. We have confirmed that the mean value of the oxygen abundance derived from the O i IR lines is insensitive to 3D effects, while such effects reduce the abundance derived from the [O i] line by dex.
With the here presented NLTE calculations for Fe and O, both the 1D and 3D models lead to inconsistencies in the iron and oxygen abundance determinations. The discrepancies in the derived iron and oxygen abundances cannot be removed by taking into account NLTE and/or 3D effects. This result has led us to investigate whether these discrepancies can be resolved by a modification of the stellar parameters of the star HD140283. We have shown that previous studies may have underestimated the metallicity of this star and overestimated its effective temperature. We find [Fe/H] (instead of [Fe/H]) and (instead of ). With these new stellar parameters the iron and oxygen abundances in the star HD140283 would be and , respectively. Taking into account the low value for the solar oxygen abundance (i.e., (O)=8.70) and our previously determined value of the solar iron abundance (i.e., (Fe)=; see Shchukina & Trujillo Bueno 2001) we find that the oxygen-to-iron abundance ratio is at [Fe/H]=.
Besides the reported NLTE effects for the Fe ii lines, our main conclusion here is that the metalicity of this type of metal-poor stars might well be significantly larger than previously thought. Obviously, the analysis of a single metal-poor star is not enough to fully resolve the puzzling behavior of the O/Fe ratio in metal-poor stars. However, we think that the present investigation at least indicates the road to be taken.
References
- Abia and Rebolo (1989) Abia, C., & Rebolo, R. 1989, ApJ, 347, 186
- Allende Prieto et al. (1999) Allende Prieto, C., García López, R. J., Lambert, D. L., & Gustafsson, B. 1999, ApJ, 526, 991
- Allende Prieto et al. (2001) Allende Prieto, C., Lambert, D. L., & Asplund, M. 2001, ApJ, 556, L63
- Altrock (1968) Altrock, R. C. 1968, Sol.Phys., 5, 260
- Anders and Grevesse (1989) Anders, E., & Grevesse, N. 1989, Geochim. Cosmochim. Acta, 1989, 53, 197
- Anstee and O’Mara (1995) Anstee, S. D., & O’Mara, B. J. 1995, MNRAS, 276, 859
- Asplund et al. (1999) Asplund, M., Nordlund, Å., Trampedach, R., & Stein, R. F. 1999, A&A, 346, L17
- Asplund et al. (2000) Asplund, M., Ludwig, H.-G., Nordlund, Å., & Stein, R. F. 2000, A&A, 359, 669
- Asplund and Garcia Pepez (2001) Asplund, M., & García Pérez, A. E. 2001, A&A, 372, 601
- Asplund (2003) Asplund, M., 2003, in IAU Symp. 210, Modelling of Stellar Atmospheres, N. Piskunov, W. W. Weiss, D. F. Gray, eds., (17-21 June 2002, Uppsala, Sweden), 273
- Asplund et al. (2004) Asplund, M., Grevesse, N., Sauval, A. J., Allende Prieto, C., & Kiselman, D. 2004, A&A, 417, 751
- Athay and Lites (1972) Athay, R. G., & Lites, B. W. 1972, ApJ, 176, 809
- Barbuy (1988) Barbuy, B. 1988, A&A, 191, 121
- Barklem and O’Mara (1997) Barklem, P. S. & O’Mara, B. J. 1997, MNRAS, 290, 102
- Barklem et al. (1998) Barklem, P. S., O’Mara, B. J., & Ross, J. E. 1998, MNRAS, 296, 1057
- Barklem et al. (2003) Barklem, P. S., Belyaev, A.K. & Asplund, M., A&A, 409, L1
- Bautista (1997) Bautista, M.A., A&AS, 122, 167
- Belyaev et al. (1999) Belyaev, A., Grosser, J., Hahne, J., & Menzel, T. 1999, Phys. Rev. A, 60, 2151
- Biberman et al. (1987) Biberman, L. M., Vorobjev, V. S., & Yakubov, I. T. 1987, Kinetics of Nonequilibrium Low-Temperature Plasma (New York: Plenum)
- Boesgaard et al. (1999) Boesgaard, A. M., King, J. R., Deliyannis, C. P., & Vogt, S. 1999, AJ, 117, 492
- Carlsson and Judge (1993) Carlsson, M., & Judge, P. 1993, ApJ, 402, 344
- Carretta et al. (2000) Carretta, E., Gratton, R. G., & Sneden, C. 2000, A&A, 356, 238
- Cavallo et al (1997) Cavallo, R. M., Pilachowski, C. A., & Rebolo, R. 1997, PASP, 109, 226
- Cram et al. (1980) Cram, L. E., Rutten, R. J., & Lites, B. W. 1980, ApJ, 241, 374
- Delbouille et al. (1973) Delbouille, L., Neven, L., & Roland, G. 1973, Photometric Atlas of the Solar Spectrum from 3000 to 10,000 (Liegè: Institut d’Astrophysique de l’Université de Liegè)
- Drawin (1968) Drawin, H. W. 1968, Z. Phys., 211, 404
- Fuhr et al. (1988) Fuhr, J. R., Martin, G. A., & Wiese, W. L. 1988, J. Phys. Chem. Ref. Data, 17, 24
- Fulbright and Kraft (1999) Fulbright, J., & and Kraft, R. 1999, AJ, 118, 527
- Fulbright and Johnson (2003) Fulbright, J., & and Johnson, J. 2003, ApJ, 595, 115
- Gratton et al. (1999) Gratton, R.G., Caretta, E., Eriksson, K., & Gustafsson, B. 1999, A&A, 350, 955
- Grevesse et al. (1984) Grevesse, N., Sauval, A. J., & van Dishoeck, E. F. 1984, A&A, 141, 10
- Grevesse and Sauval (1998) Grevesse, N., Sauval, A. J. 1998, Space Sci. Rev., 85, 161
- Gurtovenko and Kostik (1989) Gurtovenko, E. A. & Kostik, R. I. 1989, Fraunhofer Spectrum and the System of Solar Oscillator Strengths (Russian language ed.; Kiev: Naukova Dumka)
- Gustafsson et al. (1975) Gustafsson, B., Bell, R.A., Eriksson, K., & Nordlund, Å, A&A, 42, 407
- Holweger (1996) Holweger, H. 1996, Physica Scr., T65, 151
- Holweger (2001) Holweger, H. 2001, in Joint SOHO/ACE workshop, Solar an Galactic Composition, R. F. Wimmer-Schweingruber ed., AIP Conf. Proc., 598, 23
- Holweger and Mller (1974) Holweger, H. & Mller, E. 1974, Sol. Phys., 39, 19
- Israelian et al. (1998) Israelian, G., García López, R. J., & Rebolo, R. 1998, ApJ, 507, 805
- Israelian et al. (2001) Israelian, G., Rebolo, R., García López, R. J., Bonifacio, P., Molaro, P., Basri, G., & Shchukina, N. 2001, ApJ, 551, 833
- Israelian et al. (2004) Israelian, G., Shchukina, N., Rebolo, R., Basri, G., González Hernández, J. I., & Kajino, T. 2004, A&A, in press
- King and Boesgaard (1995) King, J. R., & Boesgaard, A. M. 1995, AJ, 109, 383
- Kiselman (1993) Kiselman, D. 1993, A&A, 275, 269
- Kiselman (2001) Kiselman, D. 2001, New Astronomy Rev., 45, 559
- Kiselman and Nordlund (1995) Kiselman, D. & Nordlund, Å. 1995, A&A, 302, 578
- Korn et al. (2003) Korn, A.J., Shi, J. & Gehren, T. 2003, A&A, 407, 691
- Kostik et al. (1996) Kostik, R. I., Shchukina, N. G., & Rutten, R. J. 1996, A&A, 305, 325
- Kraft et al. (1992) Kraft, R. P., Sneden, C., Langer, G. E., & Prosser, C. F. 1992, AJ, 104, 645
- Kurucz and Bell (1995) Kurucz, R. L. & Bell, B. 1995, Kurucz CD-ROM No. 23 (Harvard-Smithsonian Center for Astrophysics)
- Lambert (1978) Lambert, D. L.,1978, MNRAS, 182, 249
- Lambert (1993) Lambert, D. L.,1993, Physika Scripta, T47, 186
- Meléndez and Barbuy (2002) Meléndez, J., & Barbuy, B. 2002, ApJ, 575, 474
- Mishenina et al. (2000) Mishenina, T., Korotin, S., Klochkova, V., & Panchuk, V. 2000, A&A, 353, 978
- Moore (1959) Moore, Ch. 1959, A Multiplet Table of Astrophysical Interest, NBS Technical Note, Washington
- Mller et al. (1968) Mller, E., Baschek, B., & Holweger, H. 1968, Sol. Phys., 3, 125
- Nissen et al. (2002) Nissen, P. E., Primas, F., Asplund, M., & Lambert, D.L. 2002, A&A, 390, 235
- Rutten (1988) Rutten, R. J. 1988, in IAU Colloq. 94, Physics of Formation of Fe II Lines Outrside LTE, ed. R. Viotti, A. Vittone, & M. Friedjung (Dordrecht: Reidel), 185
- Sauval et al. (1984) Sauval, A. J., Grevesse, N., Brault, J. B., Stokes, G. M., & Zander, R. 1984, ApJ, 282, 330
- Shchukina (1987) Shchukina, N. G. 1987, Kinemat. Phys. Celest. Bodies, 3(6), 33
- Shchukina and Trujillo Bueno (2001) Shchukina, N., & Trujillo Bueno, J. 2001, ApJ, 550, 970
- Shchukina et al. (2003) Shchukina, N. G., Vasiljeva, I. E., Trujillo Bueno, J., Asplund, M. 2003, in IAU Symp. 210, Modelling of Stellar Atmospheres, N. Piskunov, W. W. Weiss, D. F. Gray, eds., (17-21 June 2002, Uppsala, Sweden), B10
- Socas-Navarro and Trujillo Bueno (1997) Socas-Navarro, H., & Trujillo Bueno, J. 1997, ApJ, 490, 383
- Stein and Nordlund (1998) Stein, R. F., & Nordlund, Å. 1998, ApJ, 499, 914
- Takeda (2003) Takeda, Y. 2003, A&A, 402, 343
- Thevenin and Idiart (1999) Thévenin, F., & Idiart, T. 1999, ApJ, 521, 753
- Tomkin et al. (1992) Tomkin, J., Lemke, M., Lambert, D. L., & Sneden, C. 1992, AJ, 104, 1568
- Trujillo Bueno and Fabiani Bendicho (1995) Trujillo Bueno, J. & Fabiani Bendicho, P. 1995, ApJ, 455, 646
- Trujillo Bueno (2003) Trujillo Bueno, J. 2003, in “Stellar Atmosphere Modeling”, I. Hubeny, D. Mihalas and K. Werner (eds.), ASP Conf. Series Vol. 288, 551.


| Ion | (Å) | log gf | (eV) | (mÅ) |
|---|---|---|---|---|
| O i | 6300.230 | 0.00 | 0.5 | |
| O i | 7771.960 | 9.11 | 7.9 | |
| O i | 7774.180 | 9.11 | 4.8 | |
| O i | 7775.400 | 9.11 | 3.4 | |
| Fe i | 3906.482 | 0.11 | 78.5 | |
| Fe i | 3917.185 | 0.99 | 44.1 | |
| Fe i | 4005.246 | 1.55 | 79.4 | |
| Fe i | 4147.673 | 1.48 | 24.1 | |
| Fe i | 4152.172 | 0.95 | 9.1 | |
| Fe i | 4177.597 | 0.91 | 24.3 | |
| Fe i | 4202.031 | 1.38 | 78.3 | |
| Fe i | 4216.186 | 0.00 | 38.9 | |
| Fe i | 4222.219 | 2.44 | 30.5 | |
| Fe i | 4250.125 | 2.46 | 52.4 | |
| Fe i | 4271.159 | 2.44 | 60.0 | |
| Fe i | 4375.932 | 0.00 | 55.0 | |
| Fe i | 4447.722 | 2.21 | 25.0 | |
| Fe i | 4489.741 | 0.12 | 11.2 | |
| Fe i | 4494.568 | 2.19 | 34.8 | |
| Fe i | 4733.596 | 1.48 | 5.5 | |
| Fe i | 4939.690 | 0.86 | 9.9 | |
| Fe i | 4994.133 | 0.91 | 13.8 | |
| Fe i | 5012.071 | 0.86 | 32.3 | |
| Fe i | 5083.342 | 0.95 | 15.5 | |
| Fe i | 5110.414 | 0.00 | 24.8 | |
| Fe i | 5123.723 | 1.01 | 12.3 | |
| Fe i | 5194.943 | 1.55 | 25.7 | |
| Fe i | 5198.714 | 2.21 | 8.5 | |
| Fe i | 5429.699 | 0.95 | 67.9 | |
| Fe i | 5701.553 | 2.55 | 2.5 | |
| Fe i | 6065.487 | 2.60 | 9.9 | |
| Fe i | 6136.620 | 2.44 | 19.7 | |
| Fe i | 6219.290 | 2.19 | 3.2 | |
| Fe i | 6252.561 | 2.39 | 14.4 | |
| Fe i | 6265.140 | 2.17 | 5.0 | |
| Fe i | 6593.878 | 2.42 | 5.5 | |
| Fe i | 6750.152 | 2.41 | 3.1 | |
| Fe ii | 4173.450 | 2.57 | 27.1 | |
| Fe ii | 4178.855 | 2.57 | 20.3 | |
| Fe ii | 4303.166 | 2.69 | 19.1 | |
| Fe ii | 4416.817 | 2.77 | 11.2 | |
| Fe ii | 4491.401 | 2.84 | 7.9 | |
| Fe ii | 4555.890 | 2.82 | 16.9 | |
| Fe ii | 4583.829 | 2.79 | 41.5 | |
| Fe ii | 4923.921 | 2.88 | 57.2 | |
| Fe ii | 5197.569 | 3.22 | 10.2 | |
| Fe ii | 5234.620 | 3.21 | 13.2 | |
| Fe ii | 5316.609 | 3.14 | 24.1 | |
| Fe ii | 6149.238 | 3.87 | 1.2 | |
| Fe ii | 6247.562 | 3.87 | 2.1 | |
| Fe ii | 6432.654 | 2.88 | 1.3 | |
| Fe ii | 6456.376 | 3.89 | 4.0 |
| Lines | Approach | Present | Asplund | Allende Prieto | Shchukina & | Kostik |
|---|---|---|---|---|---|---|
| study | et al. | et al. | Trujillo Bueno | et al. | ||
| (2004) | (2001) | (2001) | (1996) | |||
| 3D solar model | ||||||
| O i IR | NLTE | 8.700.06 | 8.650.01 | |||
| O i IR | LTE | 8.930.06 | 8.890.02 | |||
| [O i] | LTE | 8.680.01 | 8.69 | |||
| OH vib-rot | LTE | 8.610.03 | ||||
| OH rot | LTE | 8.650.02 | ||||
| Fe i | NLTE | 7.500.10 | ||||
| Fe i | LTE | 7.430.11 | ||||
| 1D model | ||||||
| O i | NLTE | 8.640.06 | 8.610.01 | |||
| Fe i | LTE | 7.620.04 | ||||
| Lines | Approach | Present study | Nissen et al. (2002) | Asplund et al. (1999) |
|---|---|---|---|---|
| 3D model ( K, log g=3.7, [Fe/H]=2.5) | ||||
| O i IR | NLTE | 7.080.06 | ||
| O i IR | LTE | 7.240.06 | 7.20 (7772) | |
| [O i] | LTE | 6.96 | 6.83 | |
| Fe i | NLTE | 5.770.19 | ||
| Fe i | LTE | 4.850.15 | 4.570.16 | |
| Fe ii | NLTE | 5.600.48 | ||
| Fe ii | LTE | 5.180.11 | 5.130.06 | 5.160.10 |
| 1D models | ||||
| log g=3.7 | log g=3.69 | log g=3.7 | ||
| [Fe/H]=2.5 | [Fe/H]=2.42 | [Fe/H]=2.5 | ||
| O i IR | NLTE | 7.110.06 | 7.02 | |
| O i IR | LTE | 7.290.06 | 7.11 | 7.15 (7772) |
| [O i] | LTE | 7.18 | 7.09 | |
| Fe i | NLTE | 5.770.15 | ||
| Fe i | LTE | 5.200.14 | 5.020.17 | |
| Fe ii | NLTE | 5.340.21 | ||
| Fe ii | LTE | 5.180.11 | 5.080.06 | 5.080.11 |
| Case | (K) | [Fe/H] | log |
|---|---|---|---|
| 1D+LTE | 5670 | 3.7 | |
| 1D+NLTE | 5450 | 3.7 | |
| 3D+LTE | 5700 | 3.7 | |
| 3D+NLTE | 5600 | 3.7 |