Shock-Heated Gas in the Large Scale Structure of the Universe
Abstract
Cosmological shock waves are a ubiquitous consequence of cosmic structure formation. They play a major role in heating baryonic gas in the large scale structure of the universe. In this contribution we study the shock-heated gas in connection with shocks themselves, using a set of N-body/hydrodynamic simulation data of a CDM universe. The distributions of shock speed and temperature of shock-hated gas both should reflect the depth of gravitational potential of associated nonlinear structures, so their morphology. From their distributions we find, in addition to hot gas in and around clusters/groups and warm-hot intergalactic medium (WHIM) with mostly in filaments, there is a significant amount of low temperature WHIM with distributed mostly as sheet-like structures. The low temperature WHIM was heated and collisionally ionized mainly by shocks with , while photo-ionization by the UV and X-ray background radiations is important for metal ions. Not only the WHIM with but also the WHIM with make up a significant fraction of gas mass, implying the low temperature WHIM could be important in resolving the missing baryon problem. The shock-heated gas in filaments and sheets are manifested best through emissions and absorptions in soft X-ray and far UV. We confirm that the WHIM with makes significant contributions to the soft X-ray background, absorptions of highly ionized species such as OVII and OVIII in AGN spectra, and line emissions from OVII and OVIII ions, as pointed by previous studies. However, the WHIM with is the major contributor to absorptions of lower ionized species such as OV and OVI, because these photo-ionized ions are most abundant in sheets of low density and temperature. On the contrary, lines of OV (630 Å) and OVI (1032 Å) are emitted mostly from the WHIM with , because they are from collisionally excited ions.
1 Introduction
In the current paradigm of the cold dark matter cosmology, the large scale structure of the universe has formed through hierarchical clustering of matter. Deepening of gravitational potential wells caused baryonic matter to accrete onto nonlinear structures. It was postulated that the baryonic matter behaved like a gas and “collisionless shocks” formed in the tenuous, magnetized, cosmic plasma via collective electromagnetic viscosities (Kang et al., 1996; Quilis et al., 1998; Miniati et al., 2000; Gabici & Pasquale, 2003; Ryu et al., 2003). In fact, the gravitational energy of the baryonic gas associated with structure formation was dissipated into heat primarily via such shocks. The dissipated energy, then, governs the thermal history and nature of the gas in the universe, and manifests the large scale structure as well as its dynamics through emitted radiation (Kang et al., 1994; Cen et al., 1995; Cen & Ostriker, 1999a; Davé et al., 2001; Valageas et al., 2002; Furlanetto & Loeb, 2003).
In a recent work, Ryu et al. (2003) studied the properties of “cosmological shock waves” and their roles on thermalization of gas and acceleration of nonthermal particles in the large scale structure, using cosmological N-body/hydrodynamic simulations. The cosmological shocks were classified into two types. “External shocks” form around outermost surfaces that encompass nonlinear structures, so they are by nature accretion shocks that decelerate the never-shocked intergalactic gas infalling toward sheets, filaments and knots. “Internal shocks” are produced within those nonlinear structures by infall of previously shocked gas to filaments and knots, during subclump mergers, as well as by chaotic flow motions. External shocks have high Mach numbers of up to due to low temperature of the accreting gas. Internal shocks, on the other hand, have mainly low Mach numbers of a few, because the gas inside nonlinear structures has been previously heated by shocks (external and/or internal) and so has high temperature. However, internal shocks are more important in energetics, because of higher preshock density. As a result, thermalization of gas and acceleration of cosmic rays occurred mostly at internal shocks.
The intergalactic gas was heated mostly by cosmological shock waves. The shock-heated gas with was studied previously, utilizing cosmological hydrodynamic simulations (Cen & Ostriker, 1999a; Davé et al., 2001). This component, which is called a warm-hot intergalactic medium (WHIM), was estimated to contain of baryon mass at the present epoch and resides mostly in filaments with a median overdensity of . Such WHIM can count for a significant fraction of the missing baryons at low redshifts (Fukugita et al., 1998; Fukugita, 2003). X-ray emission from the WHIM may contribute to a fraction of the soft X-ray background radiation (XBR) according to Phillips et al. (2001). While there were recent reports of observations of the WHIM around clusters (see, e.g., Finoguenov, 2003; Zappacosta et al., 2004b), detection of such emission still remains a challenging task due to low surface brightness. On the other hand, the WHIM may be better detected through absorption systems and emission lines in soft X-ray and far UV. For instance, the possibility of probing the WHIM with OVI absorbers was explored by Cen et al. (2001) and Fang & Bryan (2001). Absorption systems due to other Oxygen and metal ions in the intervening WHIM were studied by Hellsten et al. (1998), Chen et al. (2003) and Viel et al. (2003). Detections of such absorbers in X-ray observations including Chandra were reported (see, e.g., Nicastro et al., 2003; McKernan et al., 2003, among many). Emission lines from metal ions in the WHIM were studied by Yoshikawa et al. (2003), Furlanetto et al. (2003), and Fang et al. (2003). A possible detection of such emission lines from a filament around Coma was reported (Finoguenov, 2003).
In this paper, we study the shock-heated gas in the large scale structure of the universe and evaluate its observational manifestations with data from a set of cosmological hydrodynamic simulations where shock waves were identified (see Ryu et al., 2003). Specifically, the properties of shock-heated gas are analyzed in connection with those of cosmological shock waves. From the shock speed and gas temperature distributions, we see that 1) the shocks with and the hot gas with are distributed in and around clusters/groups, 2) the shocks with and the WHIM with are mostly in filamentary structures, and 3) the shocks with and the WHIM with are mostly in sheet-like structures. Here we refer the uncollpased, collisionally ionized, shock-heated gas as the WHIM and extend the low temperature bound of the WHIM to well below K. While the WHIM with K has been studied extensively in many previous works, the “low temperature WHIM” with K has not received much attention and will be the main subject of this study.
In the next section, simulation data are described along with numerical details. The properties of shock-heated gas are described in §3, and its observational manifestations are discussed in §4. Summary is followed in §5.
2 Simulation Data
We used the data from a set of N-body/hydrodynamic simulations of a CDM universe with radiative cooling. The simulations were performed using a PM+Eulerian hydrodynamic cosmology code that was specifically designed to capture shocks with a high accuracy. It is an updated version of the code described in Ryu et al. (1993). For instance, the code now adopts the MC (monotonized central difference) limiter, instead of the original minmod limiter to achieve sharper resolution of discontinuities (see, e.g., LeVeque, 1997). The CDM model adopted the currently favored values of the following cosmology parameters: , , (), /(100 km/s/Mpc) = 0.7, and . These values are consistent with those fitted with the recent WMAP data (see, e.g., Bennett et al., 2003; Spergel et al., 2003). A cubic region of size at present was simulated inside the computational box with , and grid zones for gas and gravity and with , and particles for dark matter, allowing a “fixed” spatial resolution of kpc kpc. We note that the simulations of different resolution have the exactly same large scale structure. The only difference is the Nyquist frequency in the initial condition, apart from spatial and mass resolutions.
We adopted the tabulated cooling rate that had been calculated by following the non-equilibrium collisional ionization of gas with a given metallicity, cooling from K to K under the isobaric condition (Sutherland & Dopita, 1993). The radiative cooling rate based on equilibrium collisional ionization is not a good approximation for , since recombination lags cooling and so ionization fractions depend on thermal and ionization history of gas. The non-equilibrium cooling rate for the gas cooling under the isobaric condition, however, becomes a function of temperature only, if the initial temperature is high enough to ensure the initial ionization equilibrium (e.g., ) and if only two-body collisional processes are included (see, e.g., Sutherland & Dopita, 2002). In our simulations, gas was allowed to cool only down to and cooling was set equal to zero for K. For void gas, the minimum temperature was set as the temperature of cosmic microwave background radiation, i.e., . For metallicity, we adopted the mean metallicity-density relation,
| (1) |
which had been suggested by Cen & Ostriker (1999b), using the data from a cosmological simulation with feedbacks into the IGM from stars. The simulations are the same ones previously used in Ryu et al. (2003) for the study of cosmological shock waves, except radiative cooling is included.
A few points on numerical details are noted. 1) Our simulations did not include star and galaxy formations and feedbacks from those stars, galaxies and AGNs, nor photo-ionization heating of the intergalactic gas. This is because our primary focus is the heating by cosmological shock waves and the properties of shock-heated gas in filaments and sheets. Non-gravitational feedbacks are expected to be most important in high density regions inside clusters and groups. Through previous studies by Cen & Ostriker (1999a) and Davé et al. (2001), it is known that the intergalactic gas was heated primarily by cosmological shock waves. Feedbacks may have contributed only or so of the thermal energy of the intergalactic gas, so they should have played only minor roles in the thermal evolution of the WHIM in filaments and sheets. On the other hand, photo-ionization heating should have affected mostly diffuse gas in void regions and Ly clouds, heating it to (see, e.g., Valageas et al., 2002). But it should not have affected much the properties of the WHIM, since most of the WHIM has in our simulations. When we estimated the amount of shock-heated gas, we excluded the components that would have been heated primarily by photo-ionization (see the next section for details). However, the photo-ionization of metal ions, such as Oxygen, due to the background radiation was taken into account in post-processing data analyses, since such photo-ionization dominates over collisional ionization for the WHIM in filaments and sheets. 2) Because of the fixed-grid-based nature, our data have a limitation in studies of high density regions such as cores of clusters and groups of galaxies, compared to those using SPH or AMR codes (Kang et al., 1994; Frenk et al., 1999). However, the same nature of fixed grid-spacing turns out to be an advantage in studying the low density gas in filaments and sheets. The typical thickness of filaments and sheets is or larger (see Fig. 2 below). In addition, the internal shocks inside those nonlinear structures have a mean separation of too (Ryu et al., 2003). As shown below, numerical resolution is important in studies of the gas inside those nonlinear structures. The fixed grid-spacing of kpc, of those scales, in our highest resolution simulation seems to be good enough to resolve filaments and sheets and shocks in those structures (Ryu et al., 2003). 3) In order to establish the connection between shock-heated gas and cosmological shocks, we identified shock surfaces by the procedure described in Ryu et al. (2003). Only the shocks with were identified, although the code itself captures shocks of any speed.
3 Shock-Heated Gas in Filaments and Sheets
3.1 Temperature and Density of Shock-Heated Gas
We begin our discussion with the temperature and density of shock-heated gas in the simulated universe. Figure 1 shows the mass distribution in the plane of gas density and temperature at from different simulations. The purple line along K in high density regime in the simulations with and grid zones is an artifact of numerical simulation. In order to isolate the shock-heated WHIM, we draw two lines in the figure: 1) The straight line represents the “Lyman- equation of state” of Valageas et al. (2002),
| (2) |
which was adjusted for different values of cosmological parameters employed (see also Hui & Gnedin, 1997, among many references). The line comes from the interplay of radiative heating by the UV background with the expansion of the universe. The region of overdensity that lies below this line would have been heated primarily by the background UV radiation to the temperature depicted by the line. 2) The curved line in the high density regime delineates the “fast-cooling” dense region, which was adopted also from Valageas et al. (2002) again with a suitable modification due to different values of parameters. It comes from the equality of the effective cooling time due to radiative cooling plus heating by the background UV radiation and the Hubble time. The high density region () below the Lyman- line and right to the fast-cooling line would have been collapsed into objects such as stars and galaxies or would be in the form of bound objects, if resolution were not limited by fixed grid-spacing in our simulations (see e.g., Furlanetto et al., 2003, for the distribution of gas from an SPH simulation). Since our focus is on the intergalactic gas that was mainly heated by shock waves, we exclude in our discussion and analyses below the photo-heated gas as well as the gas in collapsed/bound objects.
Several points are apparent in Figure 1. 1) In addition to the hot component with and the WHIM with , which were discussed in previous studies of shock-heated gas (Cen & Ostriker, 1999a; Davé et al., 2001), there exists a significant amount of low temperature WHIM in the range of . The mass fraction of the gas in each component is the followings: the hot component , the WHIM with and the the WHIM with in our highest resolution simulation data (see Table 1). In the hot component, the gas within 1 Mpc of clusters/groups hotter than 1keV was not included. Most of the low temperature WHIM has the temperature of , while the mass of the WHIM with is of total gas mass. 2) Our estimate of mass fraction for the WHIM with is comparable to, although a little smaller than, from simulations using the PTreeSPH and AMR codes (Davé et al., 2001). A part of the difference would be due to feedbacks from stars, galaxies, and AGNs, which were ignored in our simulations. 3) It is interesting to note that the distribution of our WHIM follows very closely the “equation of state for the warm IGM”, analytically suggested by Valageas et al. (2002). However, their estimation of mass fraction for the “warm IGM”, , is somewhat smaller than our estimation for all the WHIM with . 4) Gas density reaches to higher values and cooling becomes even more efficient with the dependence at higher resolution. The resulting trend is that there is more gas with high density and low temperature in higher resolution simulations. As a result, the mass fraction of the WHIM continues to decrease as resolution increases in our simulations (see Table 1).
3.2 Spatial Distributions of Shock Waves and Shock-Heated Gas
In this subsection, we investigate the spatial distribution of shock-heated gas in conjunction with that of shock waves themselves. As mentioned in the introduction, two types of shocks can be distinguished. “External shocks” are accretion shocks around nonlinear structures, whose speed is basically the infall velocity of accreting flows. “Internal shocks” are products of infall, merging, and chaotic flow motions induced by gravitational interactions inside nonlinear structures. So the shock speed of both types should reflect the depth of gravitational potential wells of nonlinear structures, and hence their morphology. In our simulations, 1) high-speed shocks with are found mostly around and inside knot-like structures of clusters/groups, 2) shocks with mostly around and inside filamentary structures, and 3) low-speed shocks with mostly around and inside sheet-like structures. The left panels of Figure 2 show the locations of external shocks, divided into the three speed groups, in a two-dimensional slice at from the simulation. The shocks encompass and outline nonlinear structures. The structures with width of in the top-left panel are mostly sheet-like structures with shallow potentials, while the thicker structures with width of in the mid-left panel are filaments (see also Fig. 3 below). The structure in the bottom-left panel contains a cluster with X-ray emission-weighted temperature, keV, and X-ray luminosity, erg s-1 (note this cluster has a high luminosity for its temperature due to excessive cooling without feedbacks from stars and galaxies).
The morphological distinction can be revealed more clearly in three-dimensional volume renderings for the distribution of shocks waves. The image in Figure 3(a) displays all shocks (external and internal) inside the full box of (100 )3. At a quick glance, filamentary structures look dominant. However, a careful inspection, especially near the edges of the box where structures do not overlap, exhibits lots of of sheet-like structures. In order to take a close look at sheet-like structures, we show in Figures 3(c) and (d) the distribution of low speed shocks with in a region of (25 )3, which is marked in the top-left panel of Figure 2. For filamentary structures we show in Figures 3(e) and (f) the distribution of shocks with in a region of (31 )3, which is marked in the mid-left panel of Figure 2. For further reference, volume rendering movies for shocks of different speed groups in the two regions shown in Figure 3(c) to (f) as well as in the region covering the complex in the bottom-left panel of Figure 2 are posted at “http://canopus.chungnam.ac.kr/ryu/shock.html”. The figures (along with the movies) demonstrate that the morphology of nonlinear structures can be revealed through the distributions of shocks of the three speed groups.
Naturally, it is expected that the spatial distribution of shock-heated gas is closely related to that of cosmological shock waves. Figure 3(b) shows a three-dimensional volume rendering image for the temperature of shock-heated gas in the same perspective as that of Figure 3(a). The images confirms that the two distributions are indeed very similar. The right panels of Figure 2 show the gas distribution in three temperature ranges, , , and , in the same two-dimensional slice as in the left panels. With the choice of temperature ranges, different morphology defined by shock waves is revealed once again by gas temperature too: i.e., the hot component mostly in knot-like structures, the WHIM with mostly in filaments, and the low temperature WHIM with mostly in sheet-like structures. Hence our results suggest the existence of a component of the intergalactic gas, the low temperature WHIM with , that has not been explored in details in previous studies.
4 Shock-Heated Gas in Observations
4.1 X-Ray Emission from Shock-Heated Gas
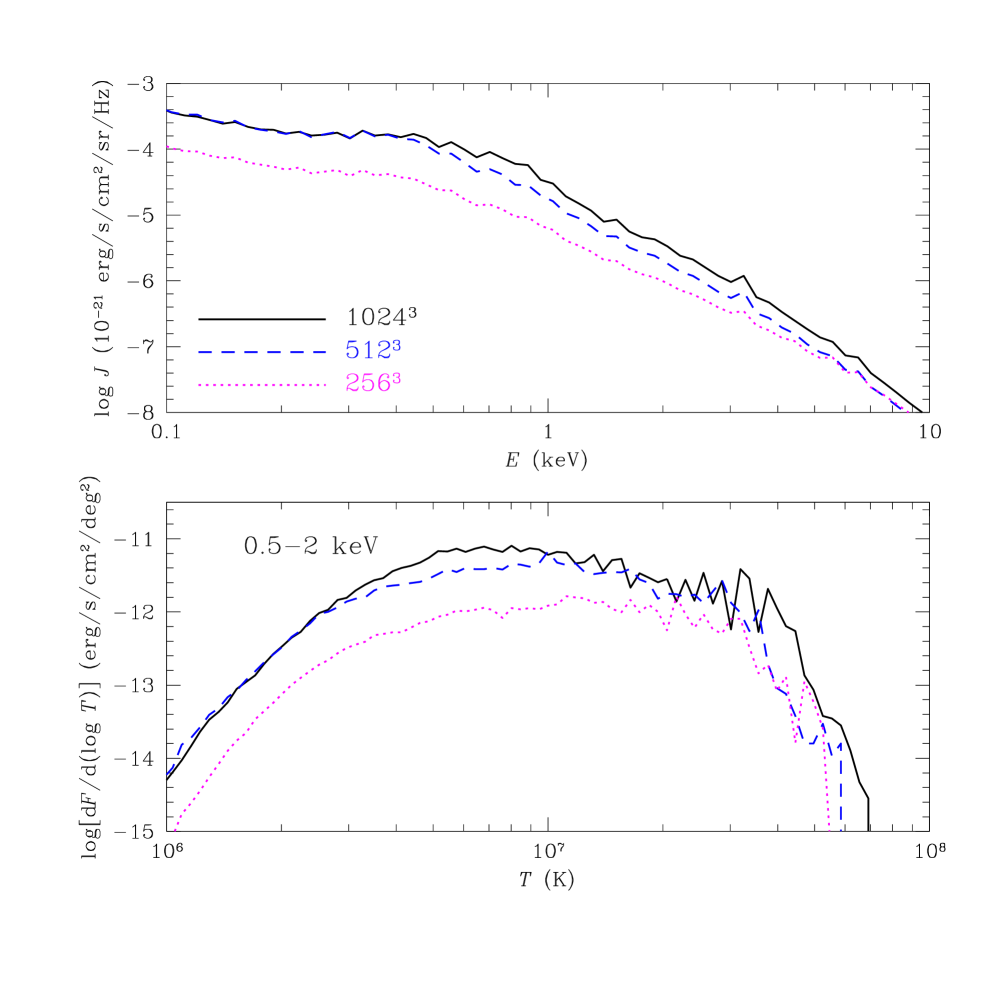
As noted in the introduction, it was suggested that the X-ray emission from the WHIM may contribute significantly to the soft XBR. Phillips et al. (2001) estimated that the emission would contribute of the observed XBR in the keV range. They used CDM simulation data in which radiative cooling, feedbacks from galaxies and photo-ionization were included, and grid zones were used for the box of size. On the other hand, based on analyses of observational data, Zappacosta et al. (2004a) suggested that most of the soft XBR could come from the WHIM. In order to asses how numerical details including finite resolution would affect the prediction, we calculated the X-ray emission from the shock-heated gas outside clusters/groups using our simulation data with , , and grid zones. Similarly as Phillips et al. (2001), the gas in spherical regions of radius around clusters/groups with keV was excluded, since they would be identified as discrete X-ray sources and be removed from contributors to the background radiation. Also the gas below the Lyman- and fast-cooling lines in Figure 1 was excluded. The X-ray spectrum code for an optically thin gas, MEKAL (Mewe et al., 1985), was used to calculate the mean proper volume emissivity, , from the entire simulation box at , 1.5, 1, 0.5, 0.2, and 0. The mean background intensity at , , was calculated then by integrating from to . Also the energy flux, , in the X-ray band of keV from the gas with temperature between and was calculated from the proper volume emissivity, , as in the calculation of . The upper and lower panels of Figure 4 show and , respectively, from the simulation data of different resolution.
Two points are noticed in Figure 4. 1) From the bottom panel, we confirm that among the shock-heated gas, it is the WHIM with that contributes most to the soft XBR. 2) The amount of X-ray emission increases with resolution, although the amount of shock-heated gas that emits such radiation decreases (see Table 1). It is because there is systematically more gas with higher density in higher resolution simulations. The X-ray emission in our two high resolution simulation ( and ) differs by only a factor of two or so in keV. The fractional contribution to the observed XBR (see Phillips et al., 2001, for discussions on observations) is largest in the keV range, and estimated to be in the simulation and in the simulation. Our estimation from the simulation is comparable to, although a little larger than, of Phillips et al. (2001), which has the same spatial resolution. Although our simulations and that in Phillips et al. (2001) were performed with the same numerical code, different treatments of additional physical processes as well as details of numerical schemes should have led to the difference. However, our estimation from the highest resolution simulation with grid zones is times larger than theirs, indicating that the WHIM could be a major contributor to the soft XBR.
4.2 Absorption Systems of Shock-Heated Gas
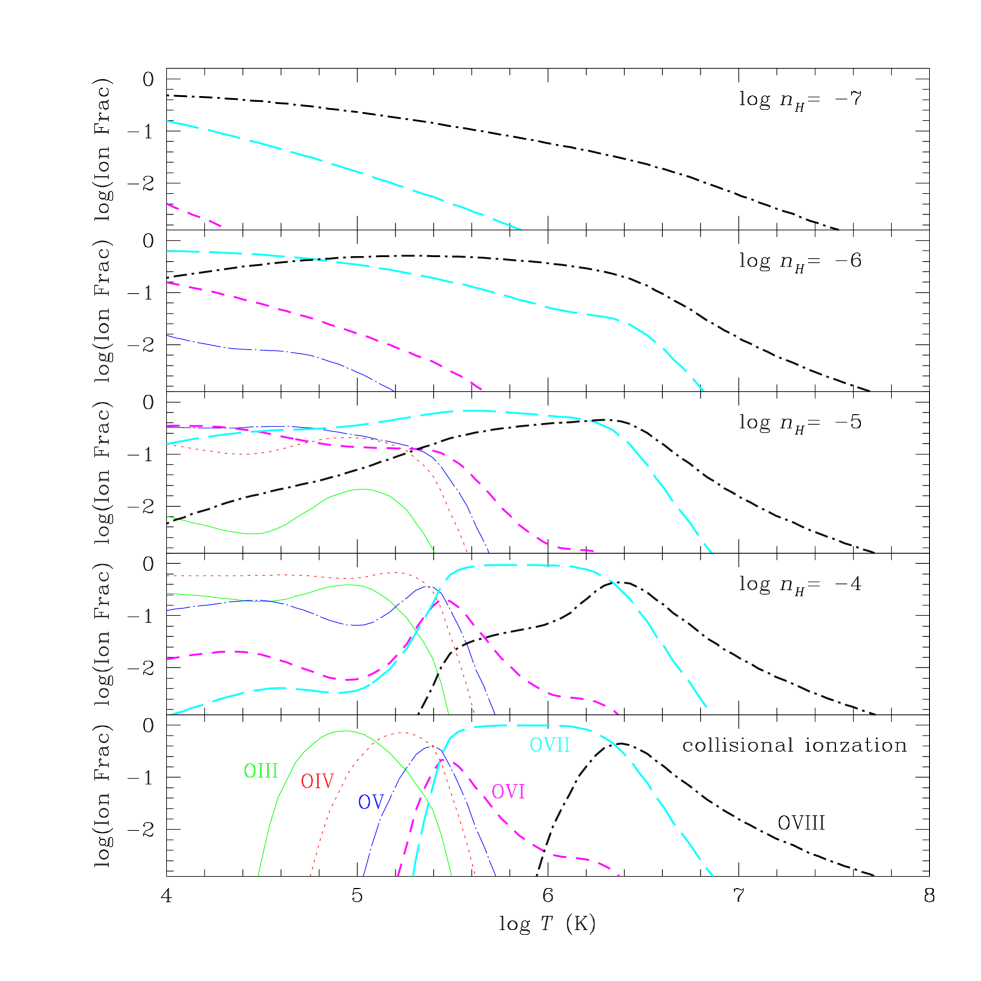
It was suggested that the properties of the shock-heated gas in filaments and sheets may be studied best by analyzing the soft X-ray and far UV “absorption systems” or “X-ray forests” in the spectra of distance quasars and AGNs. Especially, the OVI absorption systems in far UV and the OVII and OVIII absorption systems in soft X-ray were studied extensively by several authors (see §1 for references). We also study the properties of such absorbers in our simulated local universe at , following the procedure described below. First, we constructed a table for the fractions of Oxygen ions as a function of gas temperature and density. Since photo-ionization of Oxygen ions is important for the low density gas in filaments/sheets, the X-ray background radiation of Miyaji et al. (1998) and the UV background radiation of Shull et al. (1999) were included, following Chen et al. (2003). The photo-ionization code, CLOUDY (Ferland et al., 1998), was used to compute the fractions of Oxygen ions in a grid of temperature and density. Figure 5 shows the resulting fractions of Oxygen ions at hydrogen number density as a function of temperature. For comparison, the fractions when no ionizing background radiation presents are also shown. It is obvious that the photo-ionization of Oxygen ions by the adopted background radiations is very significant in the temperature range that corresponds to filaments and sheets (). The most noticeable point is that, with the ionizing background radiations, the fractions of highly ionized Oxygen ions increase at lower density. According to Figure 1 the WHIM have the hydrogen number density, , so the fractions of OVI, OVII and OVIII ions are highest in those components. This is one of the reasons why these Oxygen ions were studied extensively in previous works.
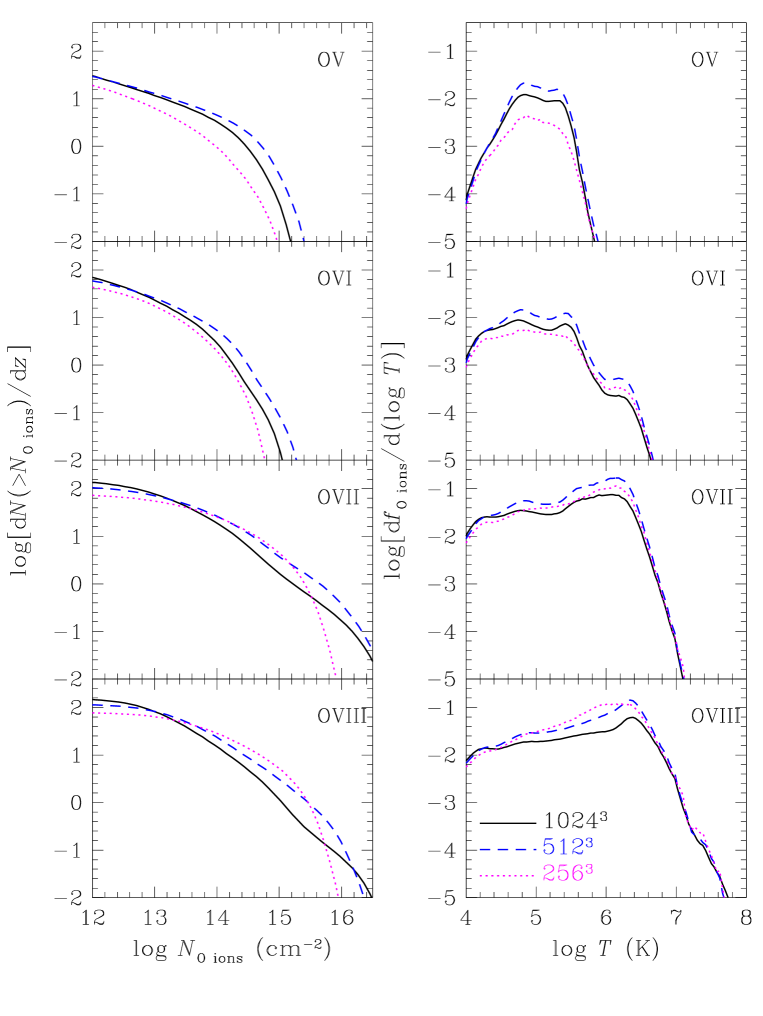
Next we calculated the column density distributions of absorption systems due to these Oxygen ions. In simulation data, clouds of shock-heated gas were identified along the ( the number of grid zones in one-direction) line paths of at . Again the gas in spherical regions of radius around clusters/groups with keV as well as the gas below the Lyman- and fast-cooling lines were excluded. The metallicity was assigned at each grid zone according to equation (1). The left panels of Figure 6 show the cumulative distributions of absorption system column density for OV-OVIII ions:
| (3) |
where is the number of absorption lines with column density, , greater than given values. As expected from Figure 5, the OVII and OVIII absorption systems are strongest. In the simulation data, for both and , which is in a good agreement with Chen et al. (2003) and Viel et al. (2003). The column densities of OV and OVI ions are smaller, so for and . We note the column density distributions in the and simulation data are converged within a factor of two.
The right panels of Figure 6 show the mass fractions of OV-OVIII ions due to the gas with temperature between and ,
| (4) |
which was normalized with the total Oxygen mass . We find that the WHIM with contributes to most of the absorption systems of OVII () and OVIII (). Hence the observations of those absorption systems would explore filamentary structures, as pointed out in Viel et al. (2003). However, the low temperature WHIM with is the major contributor to the OV and OVI absorption systems, accounting for and , respectively. This emphasizes the importance of the low temperature WHIM in some observations, as noted by Bergeron et al. (2002) in the study of OVI systems in a quasar spectrum.
4.3 Emission Lines from Shock-Heated Gas
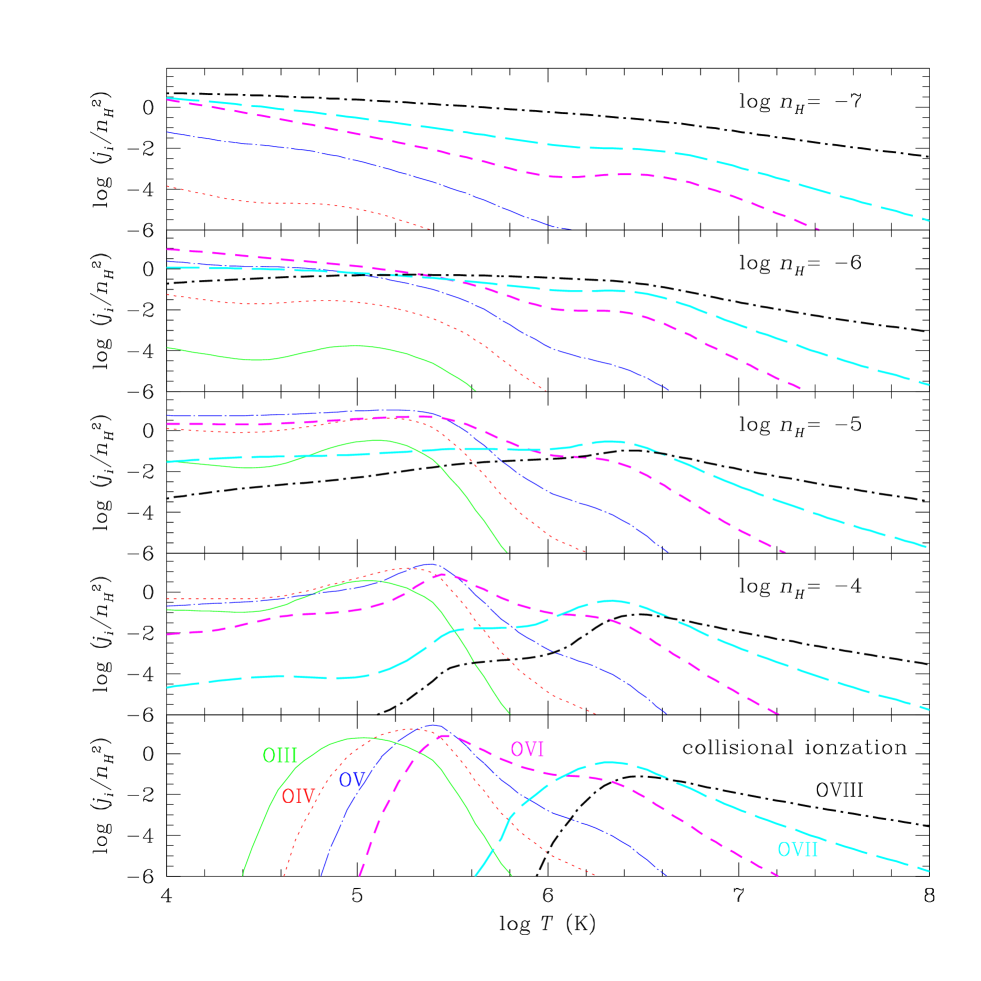
Observations of emission lines from the shock-heated gas in filaments and sheets still remain technically challenging. However, it was suggested that detections of such emissions could be possible in future X-ray missions such as MBE (see http://www.ssec.wisc.edu/baryons/) and DIOS (Ohashi et al., 2004). In this subsection, we study the Oxygen emission lines radiated by the WHIM in our simulation data. First, a table for the emissivity of OIII (698 Å), OIV (549 Å), OV (630 Å), OVI (1032 Å), OVII (574 eV), and OVIII (653 eV) lines was constructed on a grid of gas temperature and density, using CLOUDY (Ferland et al., 1998). Collisional ionization as well as photo-ionization due to the UV and X-ray background radiations described in §4.2 were included. Figure 7 shows the resulting emissivity from the optically thin gas of hydrogen number density . For comparison, the emissivity when no ionizing background radiation presents is also shown. From this figure one can expect that for the strongest lines from the gas with in filaments and sheets (see Fig. 1) would be the OVII and OVIII lines. However, for , OV and OVI would produce emission lines stronger than OVII and OVIII lines.
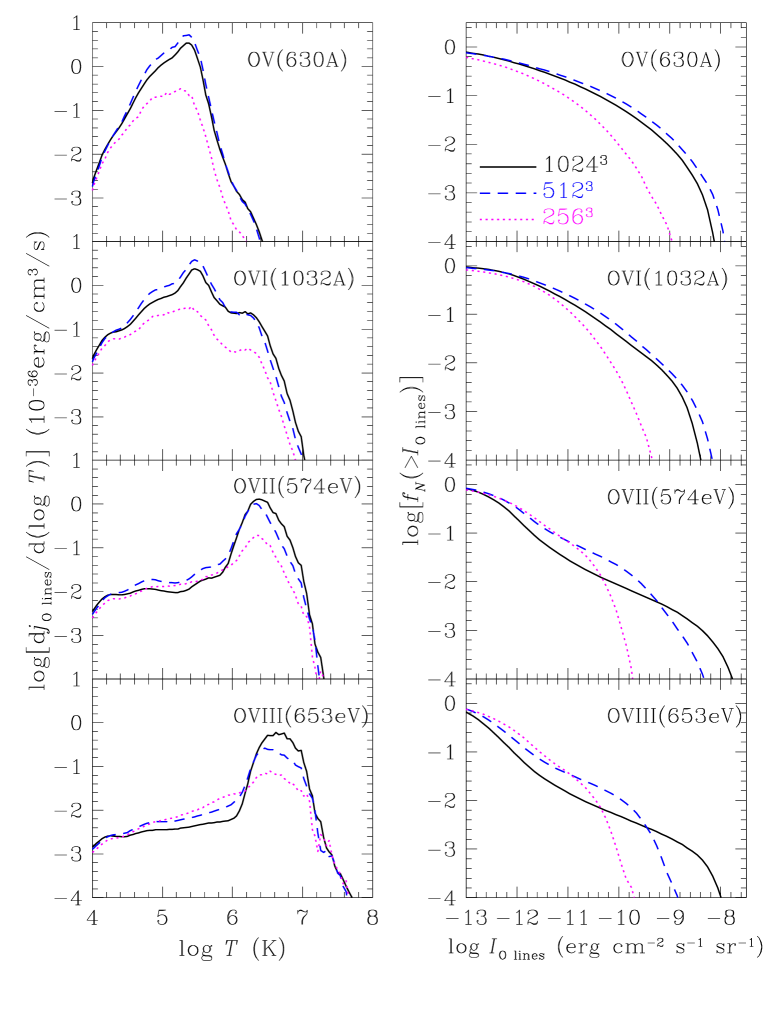
Using the emissivity table, the Oxygen line emissivity from the gas in simulation data was calculated at . As in the calculation of absorption column density, only the shock-heated gas was included and the same metallicity-density relation was adopted. The left panels of Figure 8 show the mean emissivity, , of OV - OVIII lines from the gas with temperature between and . Overall the strength is greatest for the OV and OVI lines, followed by the OVII and OVIII lines. While virtually all emissions of the OVII and OVIII lines come from the higher temperature WHIM with ( for both lines), the OV and OVI lines are emitted mostly from the WHIM with , and , respectively. Contrary to the OV and OVI absorptions which get significant contributions from the WHIM with , the line emissions of OV (540 Å) and OVI (1032 Å) come mostly from the WHIM with . Our estimates of line emissions are converged again within a factor of two in the and simulation data.
Our results indicate that the exploration of shock-heated gas through emissions in soft X-ray, such as the MBE and DIOS missions, would pick up a fraction of the WHIM with ( of total gas mass in our estimate), missing the lower temperature WHIM with . A search mission using the OV and OVI line emissions in far UV would detect a larger fraction of the low temperature WHIM with ( of total gas mass), complementing the proposed missions in the soft X-ray band.
We also calculated the specific intensity of Oxygen lines, , by integrating the emissivity/ along columns of at . Note that the Hubble expansion speed over the scale of is , and the angular size of a single grid of at a distance of is radian. So corresponds effectively to the intensity measured over a band of width with a beam of solid angle or smaller, when computed with the simulation data. We integrated along different line paths in the simulation box. The right panels of Figure 8 show the cumulative fraction of line paths with larger than given values. They show that the fraction of randomly-chosen line paths with erg cm-2 s-1 sr-1 would be for the OV and OVI lines, while it would be for the OVII and OVIII lines. However, the fractions of erg cm-2 s-1 sr-1 are for the OVII and OVIII lines and larger than those for the OV and OVI lines. This reflects the fact that while the OV and OVI lines are stronger overall, the OVII and OVIII lines are from the WHIM with and density higher than the mean density of shock-heated gas.
5 Summary
Hierarchical clustering induces cosmological shock waves in the course of large scale structure formation in the universe (Ryu et al., 2003). The intergalactic gas was heated mostly by such shocks (Cen & Ostriker, 1999a; Davé et al., 2001; Valageas et al., 2002). In this paper, we studied the properties, spatial distribution, and possible observational manifestations of the shock-heated gas in filaments and sheets with a set of simulation data of a CDM universe from a grid-based N-body/hydrodynamic code (Ryu et al., 1993). The nature of fixed grid-spacing makes such data suitable to the study of the shock-heated gas in filaments and sheets. Shock-heating was focused, so feedbacks from stars, galaxies and AGNs, and photo-ionization heating were ignored, although the photo-ionization of metal ions by the background radiation were taken into account in post-processing data analyses. We expect that exclusion of such processes should not have weakened significantly the main results of this work, since the gas in filaments and sheets was heated mostly by cosmological shocks.
The speed of cosmological shock waves reflects the depth of gravitational potential of the associated nonlinear structures, so their morphology. We saw that 1) the shocks with are distributed mostly around and inside clusters/groups, 2) the shocks with are mostly around and inside filamentary structures, and 3) the shocks with are mostly around and inside sheet-like structures. The distribution of the shock-heated gas should be closely related to that of shock waves. We found that the WHIM with is distributed mostly in filamentary structures, while the low temperature WHIM with K is mostly in sheet-like structures. The hot gas with K resides on knot-like structures as the intra-cluster/intra-group medium and the low density medium around them. The amount of shock-heated gas was estimated as follows: the hot component with (excluding the gas inside clusters/groups) accounts for of total gas mass, the WHIM with for , and the WHIM with for in our highest resolution simulation. Thus our results indicate the existence of the WHIM with , which was heated by shocks of low speed with and is distributed as sheet-like structures. We suggest that the low temperature WHIM with contributes to a significant fraction of the missing baryons at low redshifts (Fukugita et al., 1998; Fukugita, 2003).
It has been suggested in previous studies (see §1 for references) that the shock-heated gas in filaments and sheets can be manifested through emissions and absorptions in soft X-ray and far UV. 1) We found that the soft X-ray emission from the shock-heated gas in our highest resolution data contributes to of the observed XBR in the keV range. This is somewhat larger than that previously suggested by Phillips et al. (2001). 2) Column densities of Oxygen ions along randomly selected line paths in the computational box were calculated. Such column densities can produce the absorption systems or X-ray forests in the spectra of distant quasars and AGNs (see, e.g., Hellsten et al., 1998). The photo-ionization of Oxygen ions by the background UV and X-ray radiations is important for the gas in filaments and sheets due to low density and temperature. As a result, the fractions of Oxygen ions depend strongly on the local gas density. We found that, for OVII and OVIII, the absorption systems associated with the WHIM with account for of the identified absorption systems, while the low temperature WHIM with contributes of the OVI and OV absorption systems. 3) Finally, the emission lines from Oxygen ions were calculated. They are emitted mostly from collisionally excited ions. We estimated that of the OVII line (574 eV) and OVIII line (653 eV) emissions come from the WHIM with , while of the OVI line (1032 Å) and of the OV line (630 Å) are emitted by the WHIM with . Hence, we conclude that absorption systems in UV due to species such as OV and OVI provide the best chance to detect the low temperature WHIM with .
References
- Bennett et al. (2003) Bennett, C. L. et al. 2003, ApJS, 148, 1
- Bergeron et al. (2002) Bergeron, J., Aracil, B., Petitjean, P, and Pichon, C. 2002, A&A, 396, L11
- Cen et al. (1995) Cen, R., Kang, H., Ostriker, J. P., & Ryu, D. 1995, ApJ, 451, 436
- Cen & Ostriker (1999a) Cen, R. & Ostriker, J. P. 1999, ApJ, 514, 1
- Cen & Ostriker (1999b) Cen, R. & Ostriker, J. P. 1999, ApJ, 519, L109
- Cen et al. (2001) Cen, R., Tripp, T. D., Ostriker, J. P. & Jenkins, E. B., 2 2001, ApJ, 559, L5
- Chen et al. (2003) Chen, X., Weinberg, D. H., Katz, N., & Davé R. 2003, ApJ, 594, 42
- Davé et al. (2001) Davé, R. et al. 2001, ApJ, 552, 473
- Fang & Bryan (2001) Fang, T., & Bryan, G. L., 2001, ApJ, 561, L31.
- Fang et al. (2003) Fang, T., et al. 2003, preprint (astro-ph/0311141)
- Ferland et al. (1998) Ferland, G. J., Korista, K. T., Verner, D. A., Ferguson, J. B., Kingdon, J. B., & Verner, E. M. 1998, PASP, 110, 761
- Finoguenov (2003) Finoguenov, A., Briel, U. G., & Henry, J. P. 2003, A&A, 410, 777
- Frenk et al. (1999) Frenk, C. S. et al. 1999, ApJ, 525, 554
- Fukugita et al. (1998) Fukugita, M., Hogan, C. J., & Peebles, P. J. E. 1998, ApJ, 503, 518
- Fukugita (2003) Fukugita, M. 2003, preprint (astro-ph/0312517)
- Furlanetto & Loeb (2003) Furlanetto, S. R. & Loeb, A. 2003, preprint (astro-ph/0312435)
- Furlanetto et al. (2003) Furlanetto, S. R., Schaye, J., Springel, V., & Hernquist, L., 2003, preprint (astro-ph/0311006)
- Gabici & Pasquale (2003) Gabici, S. & Pasquale, B. 2003, ApJ, 583, 695
- Hellsten et al. (1998) Hellsten, U., Gnedin, N. Y., & Miralda-Escudé, J. 1998, ApJ, 509, 56
- Hui & Gnedin (1997) Hui, L. & Gnedin, N. Y. 1997, MNRAS, 292, 27
- Kang et al. (1994) Kang, H., Cen R., Ostriker, J. P., & Ryu, D. 1994, ApJ, 428, 1
- Kang et al. (1996) Kang, H., Ryu, D., & Jones, T. W. 1996, ApJ, 456, 422
- Kang et al. (1994) Kang, H., Ostriker, J. P., Cen, R., Ryu, D., Hernquist, L., Evrard, A. E., Bryan, G. L., & Norman, M. L. 1994, ApJ, 430, 83
- LeVeque (1997) LeVeque, R. J. 1997, in 27th Saas-Fee Advanced Course Lecture Notes “Computational Methods in Astrophysical Fluid Flows”, ed. O. Steiner & A. Gautschy (Berlin: Springer)
- Mewe et al. (1985) Mewe, R., Gronenschild, E. H. B. M., & van den Oord, G. H. J. 1985, A&AS, 62, 197
- McKernan et al. (2003) McKernan, B., Yaqoob, T., Mushotzky, R., George, I. M., & Turner, T. J. 2003, preprint (astro-ph/0310476)
- Miyaji et al. (1998) Miyaji, T., Ishisaki, Y., Ogasaka, Y., Ueda, Y., Freyberg, M. J., Hasinger, G., & Tanaka, Y., 1998, A&A, 334, L13
- Miniati et al. (2000) Miniati, F., Ryu, D., Kang, H., Jones, T. W., Cen, R., & Ostriker, J. 2000, ApJ, 542, 608
- Nicastro et al. (2003) Nicastro, F. et al. 2003, Nature, 421, 719
- Phillips et al. (2001) Phillips, L. A., Ostriker, J. P., & Cen, R. 2001, ApJ, 554, L9
- Quilis et al. (1998) Quilis, V., Ibanez, J. M. A., & Saez, D. 1998, ApJ, 502, 518
- Ryu et al. (2003) Ryu, D., Kang, H., Hallman, E., & Jones, T.W., 2003, ApJ, 593, 599
- Ryu et al. (1993) Ryu, D., Ostriker, J. P., Kang, H., & Cen, R. 1993, ApJ, 414, 1
- Shull et al. (1999) Shull, J. M., Robers, D., Giroux, M. L., Penton, S. V., & Fardal, M. A. 1999, AJ, 118, 1450
- Spergel et al. (2003) Spergel, D. N. et al. 2003, ApJS, 148, 175
- Sutherland & Dopita (1993) Sutherland, R., S. & Dopita, M., A. 1993, ApJS, 88, 253
- Sutherland & Dopita (2002) Sutherland, R., S. & Dopita, M., A. 2002, in Astrophysics of the Diffuse Universe (Springer)
- Ohashi et al. (2004) Ohashi, T. et al., 2004, preprint (astro-ph/0402546)
- Valageas et al. (2002) Valageas, P., Schaeffer, R., & Silk, J. 2002, A&A, 388, 741
- Viel et al. (2003) Viel, M., Branchini, E., Cen, R., Matarrese, S., Mazzotta, P., & Ostriker, J. P. 2003, MNRAS, 341, 792
- Yoshikawa et al. (2003) Yoshikawa, K., Yamasaki, N. Y., Suto, Y., Ohashi, T., Mitsuda, K., Tawara, Y., & Furuzawa, A. 2003, PASJ, 55, 879
- Zappacosta et al. (2004a) Zappacosta, L., Maiolino, R., Mannucci, F., Gilli, R., Finoguenov, A., & Ferrara, A. 2004a, preprint (astro-ph/0401202)
- Zappacosta et al. (2004b) Zappacosta, L., Maiolino, R., Mannucci, F., Gilli, R., & Schuecker, P. 2004b, preprint (astro-ph/0402575)
| Component | |||
|---|---|---|---|
| Hot with aaThe gas within 1 Mpc of clusters/groups hotter than 1keV was not counted. | 0.022 | 0.024 | 0.029 |
| WHIM with | 0.24 | 0.37 | 0.43 |
| WHIM with | 0.13 | 0.13 | 0.10 |