Molecular gas structure around an AGN with nuclear starburst: 3-D Non-LTE calculations of CO lines
Abstract
We have performed three-dimensional, non-LTE (non-Local Thermodynamic Equilibrium) radiative transfer calculations for 12CO and 13CO lines, applying them to our high-resolution hydrodynamic models of the ‘torus’ around a supermassive black hole in an active galactic nucleus. The hydrodynamic simulations reveal inhomogeneous and turbulent gas structure on a sub-pc scale in a circum-nuclear starburst region. Thick disks interlaced with filaments, clumps and holes are naturally formed due to the interplay among energy feedback from supernovae, self-gravity of the gas, galactic rotation, and radiative cooling. The intensity maps of the molecular lines for the circum-nuclear disks show a clumpy structure reflecting the intrinsic inhomogeneity and turbulent motion of the gas disk. The fine structure of the ‘torus’ could be resolved in the nearby active galaxies using the Atacama Large Millimeter/submillimeter Array. We also found that the CO-to-H2 conversion factor (X-factor) is not uniformly distributed in the central 100 pc region. The X-factor derived for 12CO (1-0) intensity depends strongly on the intensity, whereas the X for 12CO (3-2) is nearly constant over two orders of magnitude of the intensity. The suggested conversion factor for the molecular gas mass is cm-2 (K km s-1)-1. The line-ratio of high-J transitions of CO is not uniformly distributed in the nuclear disk, and the apparent ratio depends on the beam sizes. ‘Observed’ 12CO (J=4-3)/12CO (J=2-1) can differ from the intrinsic ratio by maximally 20%.
Subject headings:
ISM: structure, kinematics and dynamics — galaxies: nuclei, starburst — method: numerical1. INTRODUCTION
The galactic centers of spiral galaxies are important regions for the evolution of galaxies. It has been widely believed that most ‘large’ galaxies harbor supermassive black holes (SMBHs) at their centers, and also that the observed scaling relation between masses of black holes and the galactic bulges suggests that they have evolved together during the hierarchical formation of galaxies (e.g. Kauffmann & Haehnelt, 2000). The galactic centers are often very active. Nuclear starbursts and various kinds of active galactic nuclei (AGNs) are observed in nearby galaxies and also in galaxies at high redshifts. These active phenomena must be related with the evolution of the SMBHs and galaxies, as well as the intergalactic medium through galactic winds and radiative feedback, especially at high redshifts. All these phenomena are related to the structure and dynamics of the interstellar medium (ISM) in the central 100 pc regions of galaxies. For example, AGN activities are supported by gas fueling, whose mechanisms remain unclear, especially in the inner 100 pc from the central engine (see Wada 2004, and references therein). We have not yet determined what triggers the nuclear starbursts that are connected to the formation of stellar cores and the SMBH (e.g. Norman & Scoville, 1988). However, in the next decade, we may expect drastic change in our observational knowledge of the ISM in the circum-nuclear region of galaxies. The 0.01” spatial resolution with the next generation millimeter and submillimeter interferometer, ALMA (the Atacama Large Millimeter Array) may reveal a sub-pc structure of the ISM. We now need to improve our theoretical modeling of the ISM in the galactic central regions in order to make direct comparison with future observations.
The ISM in galaxies is inhomogeneous and multi-phase, and this is especially important in studying the gas dynamics in circum-nuclear regions, because the typical scale of the inhomogeneity of the ISM ( pc) is not negligible compared to the size of the system ( pc). The isothermal approximation (e.g. the sound velocity 10 km s-1), which has often been used for modeling gas dynamics on a galactic scale, is not adequate for the nuclear gas dynamics, particularly when energy and radiative feedback from stars is taken into account. The multi-phase nature is also important for comparing numerical models with observations. Radiative transfer calculations, for continuum and various lines emitted from the AGN regions, require realistic density, temperature and velocity distributions of the ISM as input. In order to achieve realistic numerical models of the ISM, sub-pc spatial resolution for diffuse gases as well as for dense gases and resolving strong shocks is also essential. We should also take into account the self-gravity and three-dimensional dynamics of the ISM.
Instead of adopting phenomenological approaches for the multi-phase ISM, in which many free parameters and assumptions are unavoidable (e.g. Combes & Gerin, 1985),Wada & Norman (2001, 2002) obtain global, inhomogeneous models of the ISM with a sub-pc scale resolution, by solving the governing basic equations of the ISM with a high-accuracy Euler mesh code. In the present paper, using these results (three-dimensional density, temperature and velocity field data), we have made the first attempt to derive the molecular line intensities emitted from the nuclear starburst region with a supermassive black hole applying our non-LTE (non Local Thermodynamic Equilibrium), fully three-dimensional radiative transfer calculations.
These kinds of ‘synthesized observations’ based on radiative transfer calculations has recently been applied to turbulent molecular clouds (Padoan et al., 1998; Ossenkopf, 2002; Ossenkopf & Mac Low, 2002). Padoan et al. (1998) performed non-LTE radiative transfer calculations of CO and CS lines using a Monte-Carlo integration scheme (Juvela, 1997) for numerical results of the magneto-hydrodynamic simulations of turbulent clouds. They found that the synthesized maps and spectra bear resemblance to real molecular clouds in many respects. Ossenkopf (2002) and Ossenkopf & Mac Low (2002) made similar analysis of turbulent clouds, but they assumed a local LVG (Large Velocity Gradient) approximation and isotropic radiation field. Ossenkopft et al. claimed that their simplified analysis is accurate enough for comparison between the observations of molecular clouds and the numerical models of turbulent clouds. These studies focused on the molecular clouds in disks of spiral galaxies, like our Galaxy, therefore we cannot simply apply their results to the interstellar medium in the nuclear starburst with a supermassive black hole. Apparently we should not assume isothermal, isotropic turbulence in the galactic nuclear region. Since the local turbulent motion is of the same order as the global rotation (Wada & Norman, 2002), a fully consistent treatment of the radiative transfer is necessary.
In §2, we describe the numerical method and models. In §3, the typical structure of the ISM in the circum-nuclear region obtained by hydrodynamic simulations is briefly described. Then, 12CO and 13CO line intensity calculations are shown. The CO-to-H2 conversion factor, the so-called “X” factor and the line-ratios are also discussed. A brief summary and discussion are presented in §4.
2. Numerical Method and Models
2.1. Hydrodynamic models
The numerical methods for obtaining three-dimensional density, temperature and velocity fields of the gas around a SMBH, for which the line-transfer and excitation of molecules are calculated, are the same as those described in Wada & Norman (2002). Details of the two-dimensional version of the numerical scheme is described in Wada & Norman (2001). In addition to the model described in Wada & Norman (2002), we also performed a model with a moderate supernova rate and a less massive black hole (see below). Here, we briefly summarize them. We solve mass, momentum, and energy conservation equations with the Poisson equation numerically in 3-D to simulate the evolution of a rotating ISM in a fixed gravitational potential. Here the external potential force in the momentum conservation equation is , where the time-independent external potential is with a core radius of pc and a maximum rotational velocity of km s-1. The central BH potential is with pc. The mass of the BH is assumed to (model A) and (model B). Model A is the same model studied in Wada & Norman (2002). We also assume a cooling function with Solar metallicity and heating due to photoelectric heating, and due to energy feedback from SNe, . We assume a uniform UV radiation field, which is ten times larger than the local UV field. We assume an equation of state for an ideal gas with a ratio of specific heat .
The hydrodynamic part of the basic equations is solved by AUSM (Advection Upstream Splitting Method) (Liou & Steffen 1993). We use (model A) or (model B) Cartesian grid points covering a pc3 (model A) or pc3 (model B) region around the galactic center (the spatial resolution is 0.25 pc). The Poisson equation is solved using the fast Fourier transform and the convolution method. The initial condition is an axisymmetric and rotationally supported thin disk with a uniform radial density profile (the scale height in z-direction is 2.5 pc) and a total gas mass of (Model A) and (Model B). Random density and temperature fluctuations, which are less than 1 % of the unperturbed values, are added to the initial disk.
Supernova (SN) explosions are assumed to occur at random positions on the disk plane. The average SN rate is 0.8 yr-1 (model A) and 0.08 yr-1 (model B). The energy of ergs is instantaneously injected for each supernova into a single cell, as a form of thermal energy. The three-dimensional evolution of blast waves driven by the SNe in an inhomogeneous and non-stationary medium with a global rotation is followed explicitly, taking into account the radiative cooling. Therefore the evolution of the SN remnants, e.g. their duration and structure, depends on the gas density distribution around the SNe, and we do not need to assume free parameters, such as the heating efficiency.
2.2. Line radiative transfer calculations
Next, we try to ‘observe’ the star-forming disk around a SMBH, calculated separately using the hydrodynamic method described in §2.1, with molecular lines. A snapshot of density, temperature and velocity fields of (model A) or (model B) or cells [i.e. each cell is (0.5 pc)3], averaged from the original hydrodynamics simulations with or , cells is used to obtain 12CO and 13CO intensities. We have performed three-dimensional, fully non-LTE calculations to obtain CO line intensity distribution. We use the density, temperature and velocity data in a data cube from a snapshot of a three-dimensional hydrodynamical calculation, and the accelerated Monte-Carlo method is applied. We have developed a three-dimensional code, based on Hogerheijde & van der Tak (2000), and this is optimized to our vector-parallel supercomputer. Here we briefly describe the method. The equation of radiative transfer is
| (1) |
where is the intensity at frequency along a particular line of sight described , the source function is defined as with emission and absorption coefficients and . The optical depth is defined as . The coefficients and for a spectral line are determined by absorption and emission between levels and with number density and :
| (2) | |||||
| (3) |
where is a line-profile function peaked around the frequency , and , and are the Einstein probability coefficients. The line profile is given by
| (4) |
The level populations are determined by the equation of statistical equilibrium, i.e.
| (5) | |||
where is the mean intensity of the radiation field,
| (6) |
with . Equations (1), (2.2) and (6) are solved iteratively. The integral in eq. (6) is evaluated using the Monte Carlo approach. Instead of using the original Monte Carlo approach (Bernes, 1979), here we used the implementation developed by Hogerheijde, & van der Tak (2000), in which the integration is performed along the rays incident on each cell from infinity. This approach has the advantage of convergence of the radiation field and level populations.
For each grid cell, rays are calculated. First, we choose the wavelength of photons incoming to the cell at according to equation (4). The central frequency of these photons is taken to be equal to , where , , and represent the central frequency of this transition in the laboratory frame, randomly chosen normal vector of the ray from and the local velocity of the gas at . For these photons, the absorption and emission due to the grid cell at on the path are calculated using equations (2) and (3). In equation (4), we put for the central frequency. Then, we integrate equation (1) from the boundary, where the cosmic microwave background radiation is assumed, and obtain . After averaging the specific intensities of rays as equation (6) by adding respective intensities, we finally solve the rate equation and obtain the level populations for the cell at . This procedure continues till the level populations of each cell converge.
We solved ten excitation levels of 12CO and 13CO, and for each cell is used. In most cases, the radiation field, the level populations, and the final intensity distribution of the lower-level () molecular lines are converged in about 20 iterations. The collision coefficients for 12CO and 13CO are taken from Green & Thaddeus (1976) and Green & Chapman (1978). Ten energy levels of these molecules are included in the calculation. We have assumed constant abundances of for 12CO and for 13CO. The ‘micro-turbulence’, in eq.(4) is assumed 1 km s-1.
Computational time for one typical run of these radiative transfer calculations is typically about 4 hours, using 32 processors of a vector-parallel supercomputer Fujitsu VPP5000 (the peak performance is 9.6 Gflops/processor).
3. Numerical Results
3.1. Input models
Recent high resolution, 3-D hydrodynamical simulations revealed that a typical three-dimensional density structure of the ISM in the central 100 pc is characterized by a ‘tangled’ network of filaments and dense clumps (Wada, 2001). These filaments are a natural consequence of the gravitational and thermal instabilities, tidal interaction between dense clumps, and local and global shear motions. The probability distribution function of gas density in an equilibrium state is well represented by a single log-normal function (Wada & Norman 2001; Wada 2001). In other words, this reflects the fact that the denser media occupy smaller volumes, and the log-normal function implies that the inhomogeneous structure is a consequence of highly non-linear ways. This nature of the density field would be related to the empirical relation between the global star formation rate and the average surface density of the ISM (Elmegreen, 2002). During the development of these inhomogeneous structures, a small part of the galactic rotational energy is converted to maintain a steady turbulent motion of the ISM [see also Wada, Meurer, & Norman (2002) for two-dimensional cases]. The ISM around a SMBH () on a 10-100 pc scale is basically the same structure as mentioned above. However, the gravitational field of the massive black hole affects the scale height of the disk. Energy feedback from supernova explosions, which is expected in the clumpy medium, also determines the global structure of the nuclear gas disk. Therefore, the scale height of the thick disk is determined from a balance between supernova heating and turbulent energy dissipation due to the radiative cooling in a black hole and galactic gravitational field (Wada & Norman, 2002).
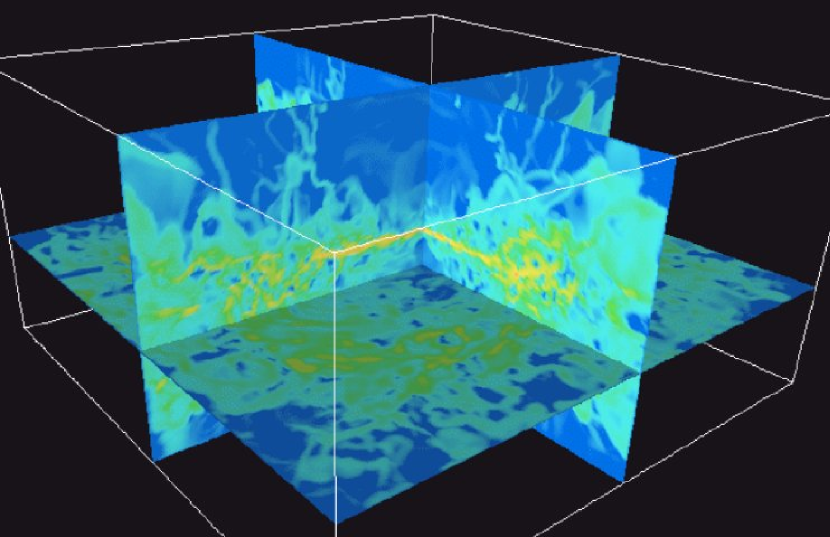
Figure 1 is density distribution of model A ( with a relatively high star formation rate yr-1), and it is clear that the gas around the central massive black hole is filamentary and clumpy, and the scale height is larger in the outer region. As pointed out in Wada & Norman (2002), the internal inhomogeneous structure of the ’torus’ is not steady, but rather seemingly turbulent, although it globally rotates around the center. The global flared disk shape does not change significantly during many rotational periods. The turbulent motion is enhanced by supernova explosions which are assumed to randomly occur in the disk, and their blast waves blow the gas up from the disk plane.
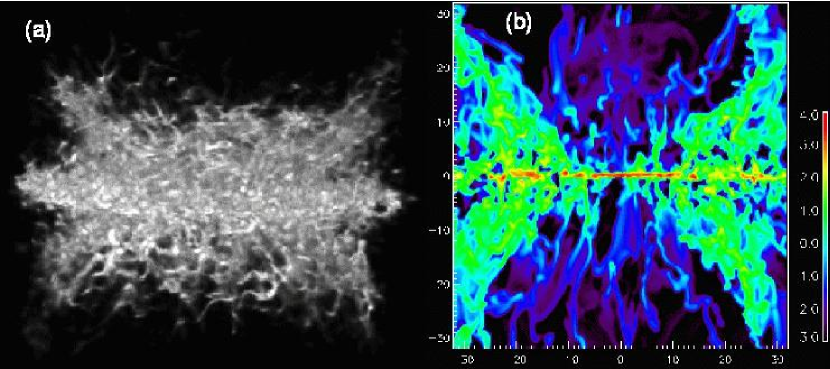
Figure 2 shows the density structure of model B, in which a less active supernova rate (0.08 yr-1) and a less massive black hole () are assumed. The structure is similar to those seen in Figure 1.
3.2. Molecular line-transfer calculations
Since most parts of the gas mass in the torus are in cold ( K) and dense ( cm-3) phases, we expect that molecular lines, such as 12CO (1-0, 2-1, …), are good tracers to observe the molecular torus. Here we demonstrate how the dense clumpy ‘torus’ is observed by the 12CO lines, using three-dimensional radiative transfer calculations, without assuming the LTE described in §2. Figure 3 shows channel maps of 12CO () for the torus shown in Figure 1 with a viewing angle of 45 degrees from the rotational axis. If we obtain channel maps like Figure 2 by future radio observations, we can confirm the ISM in the circum-nuclear region is globally rotating at km s-1, and the internal velocity dispersion for the cold and dense gas is as large as km s-1. The large random motion inside the torus suggests that the torus is geometrically thick, provided that the scale height of the torus is determined by a balance between vertical components of the centrifugal force due to the central black hole and vertical velocity dispersion (see Wada & Norman, 2002).
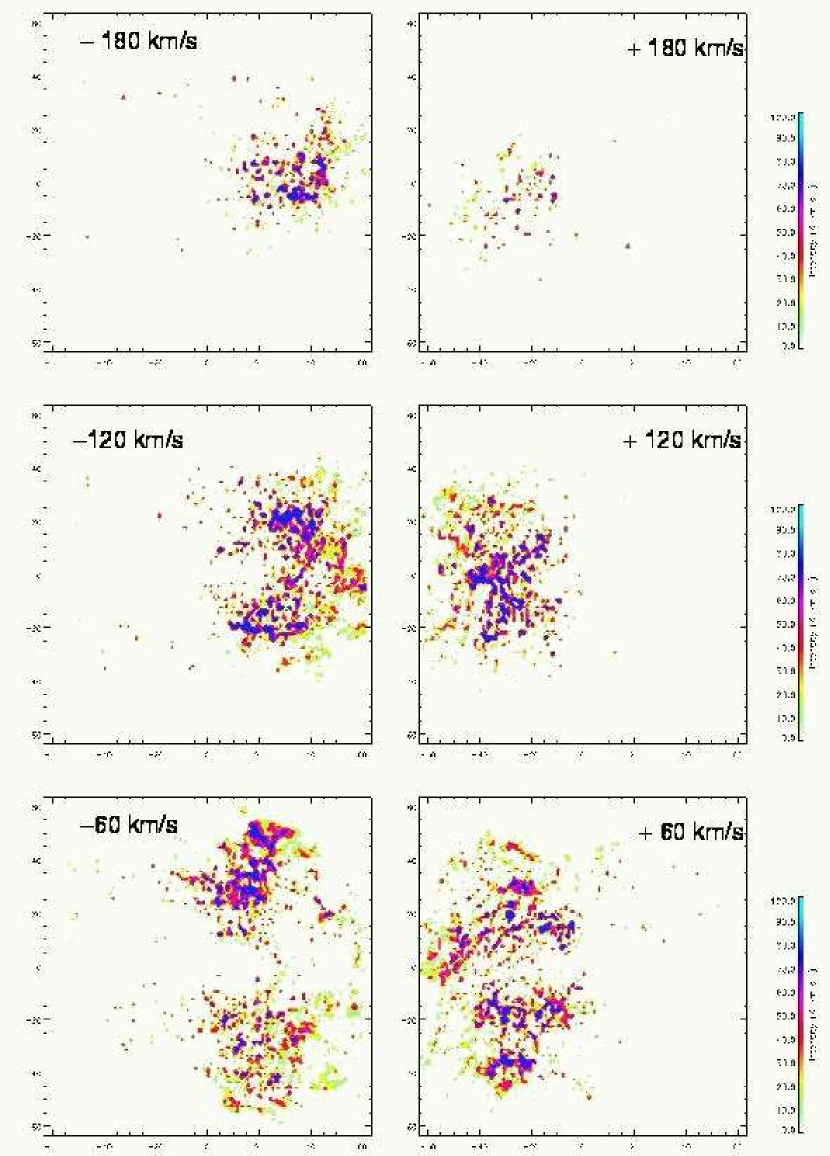
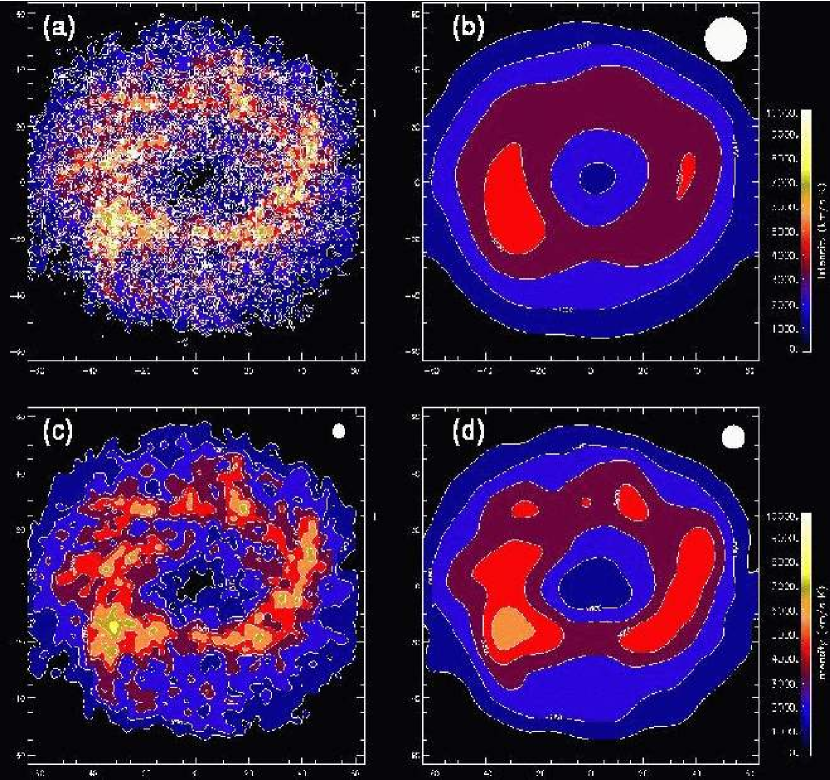
Figure 4 shows integrated intensity maps for model A in Figure 1. We convolved the maps with four different ‘beam’ sizes to see how the difference affects the apparent structure inhomogeneity of the integrated maps. As is clearly seen in Figure 3b, the clumpy structure of the torus cannot be resolved with a beam size of about 1/10 of the disk size, although the torus-like structure can be still observed. Suppose this torus is located in the Virgo cluster, 0.01 arcsec angular resolution, which is expected to be attained by the ALMA, approximately corresponds to the beam size in Figure 3c. Therefore, the clumpy structure of the molecular tori will easily be detected. On the other hand, the one arcsec beam, which is typically achieved by present-day radio interferometers, such as the Nobeyama Millimeter Array, is almost comparable to the torus size, therefore even the central hole of the torus could not be resolved, even if it in fact presents.
The two panels of Figure 6 are volume-weighted and mass-weighted histograms for a density and temperature in model B. As in the usual three-phases model of the ISM (McKee & Ostriker, 1977), three stable branches can be seen in Figure 5a, i.e. cold, dense gases ( pc-3 and K), warm gases at K, and hot, diffuse gases at K and pc-3. The temperatures of warm and cold gases are maintained by the photoelectric heating of the dust by the UV radiation, and shock heating in the compressible turbulence due to supernova explosions. They are roughly in pressure equilibrium, but one should note that the dispersion of the pressure is quite large for a given density or temperature, which suggests that structure of the multi-phase ISM may not be determined under a constant pressure. Figure 5b, the mass-weighted phase diagram shows that the gas mass is dominated by the cold, dense phases. Mass fraction of the gas with K is about 20% of the total mass.
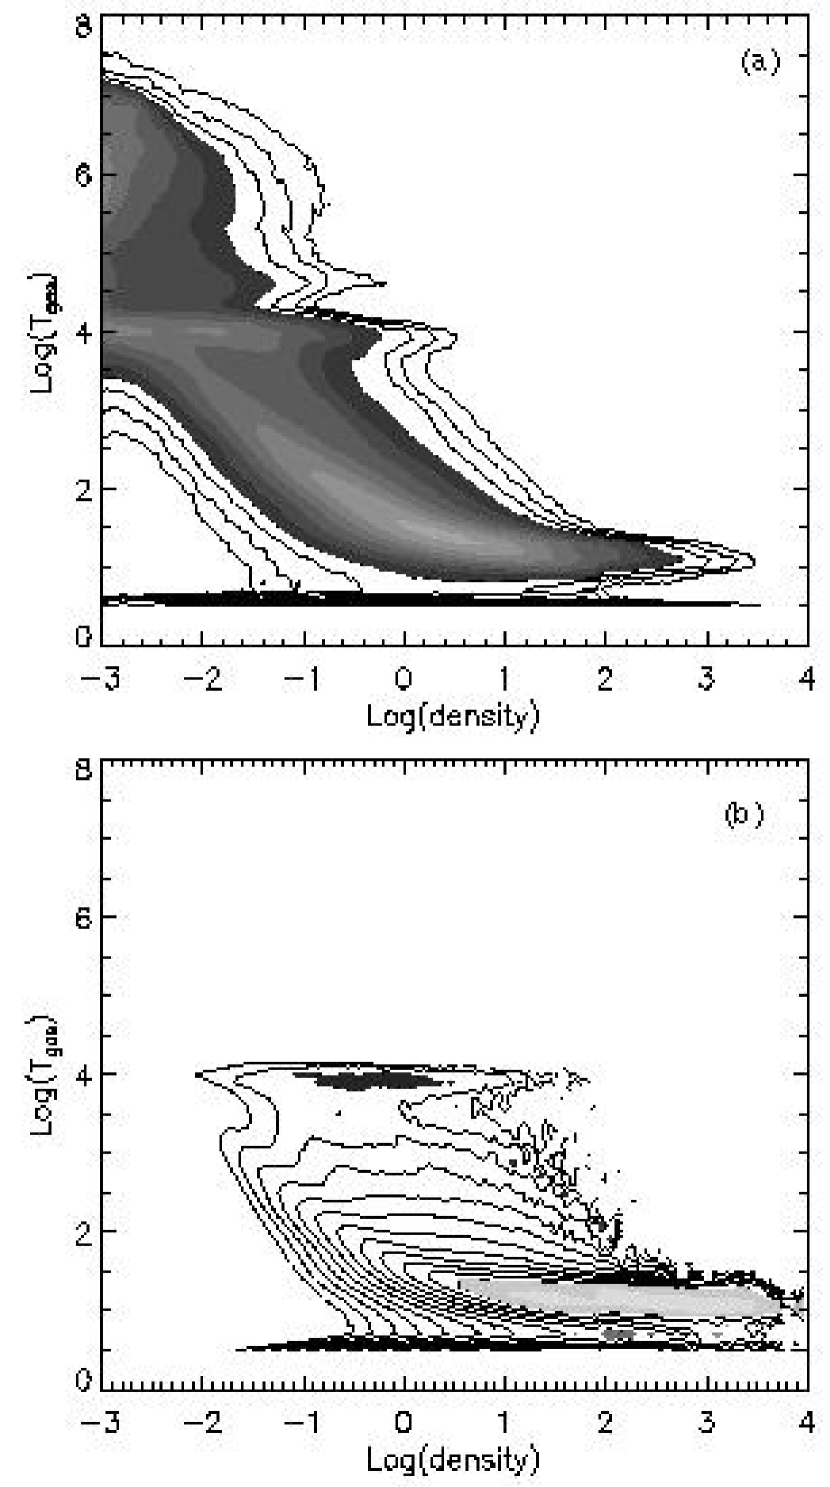
Figure 5 shows line-ratios of 13CO for the edge-on view of model B. The flared disk shown in Figure 2 is clearly seen with the ratio of 13CO (J=1-0)/13CO (J=2-1) , and 13CO (J=3-2)/13CO (J=2-1) , whereas in 12CO line-ratios (Figure 6), the flared disk is not clear. These results suggest that the 12CO/13CO line-ratio is not uniform in the nuclear starbursts even for the constant abundance ratio that we assumed. This kind of fine structure of the molecular gas should be detected in nearby Seyfert 2 galaxies with starbursts (Storchi-Bergmann et al., 2001; Cid Fernandes et al., 2003) by future observations with the ALMA.
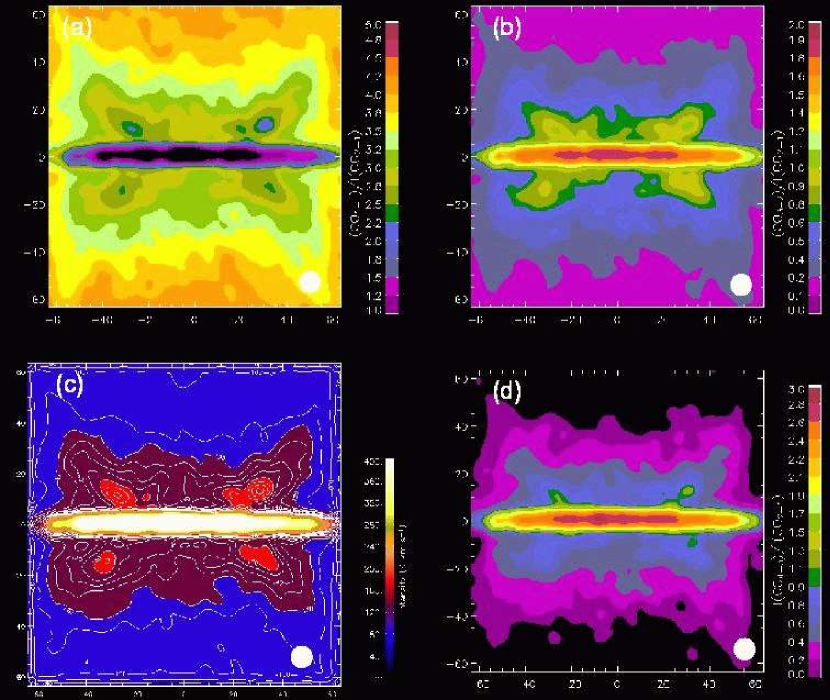
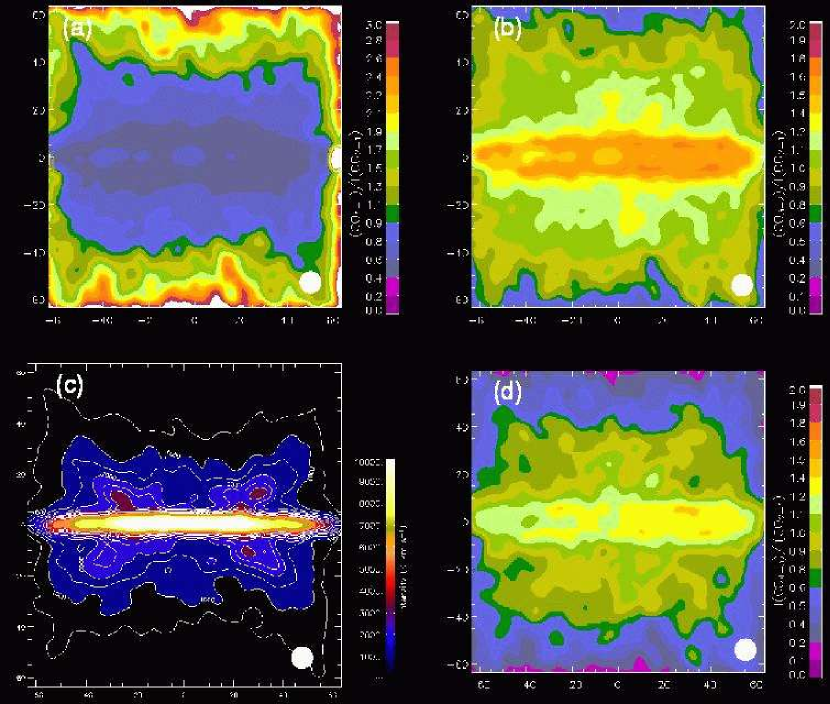
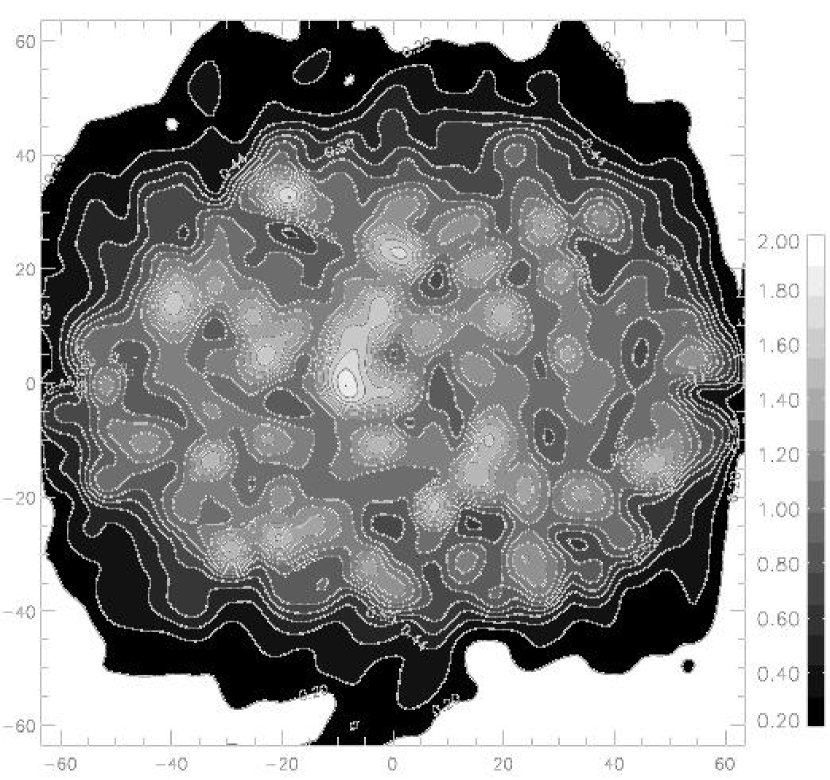
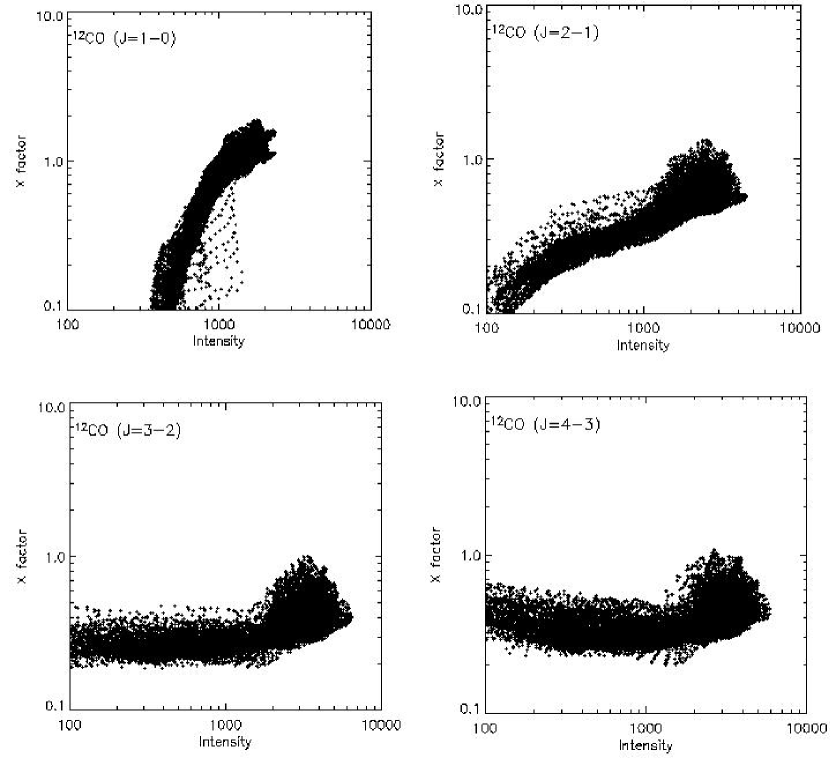
Figure 8 shows distribution of the CO-to-H2 conversion factor (X-factor) calculated from column density of the gas and integrated intensity of 12CO (1-0). The starburst model (Fig. 2) is observed from a viewing angle of 45∘, convolved with a Gaussian kernel of FWHM 2.5 pc (five grid points). It is clear that the X-factor is not uniformly distributed. In most regions, the X-factors are smaller than the value estimated for the local clouds in the Galaxy [2-3 cm-2 (K km s-1)-1] (Solomon, Rivolo, Barrett, & Yahil, 1987). Its distribution roughly follows the column density distribution. This is also clear in Figure 7, in which the X-factors for four lines of 12CO are plotted against the integrated intensity. The X-factor of 12CO (1-0) depends on the intensity, and the larger X-factor (i.e. higher density) is obtained for stronger intensities. In other words, the column density of the molecular gas in dense regions may be under-estimated if a constant conversion factor is assumed. On the other hand, the X-factor of 12CO (3-2) is nearly constant for an integrated intensity of less than 2000 K km s-1. These results suggest that 12CO (1-0) is not a good tracer for gas column density and total gas mass for the dense nuclear gas disk with the starburst, but 12CO (3-2) can be used to estimate the column density of the molecular gas in a wide range of intensity. The average X-factor for 12CO (3-2) is in the range of K km s-1. These results are consistent with the well known fact that the mid-J CO transitions are suitable for derivation of the column density of warm (e.g. 30-50 K) molecular clouds in our Galaxy(e.g. Stutzki & Guesten, 1990). Using ‘synthesized observations’ of the numerically obtained magnetized turbulent clouds, Ossenkopf (2002) also showed that the X-factor for 12CO (1-0) linearly increases for the column density. They claimed that the X-factor is a constant only in a small column density range, and this is consistent with our results, although the objects (molecular clouds in a galactic disk and a molecular torus around the AGN) are very different.
The line-ratios, such as 12CO (2-1)/12CO (1-0), are often used to infer the physical conditions of molecular clouds, mostly in the Milky way (e.g. Oka et al. 1998), with the Large-Velocity-Gradient (LVG) technique (e.g. Scoville & Solomon, 1974). We find that the line-ratio is not also uniformly observed for the nuclear disk. This suggests that the line-ratios observed with large beams do not necessarily show the true ratios. In Figure 10, the maximum line-ratios of 12CO (1-0)/(2-1), (3-2)/(2-1), (4-3)/(2-1) are plotted for four different beam sizes. One finds that the ratios depend on beam sizes, especially for higher- transitions. CO(4-3)/CO(2-1) is different by about 20% between results with the finest and lowest resolutions. This implies that for a line-ratio obtained with a beam size that is comparable to or larger than the object (i.e. nuclear disk), the ‘true’ line-ratio on a local scale could be larger than the average by 20%. This difference might not be negligible in inferring the physical conditions of the ISM using the usual LVG analyses. In this sense, we should understand that the currently observed molecular line-ratios in external galaxies (e.g. Wall et al. 1993; Zhu et al. 2003) posses some intrinsic uncertainty.

The beam sizes of current radio interferometer observations are typically a few arc-seconds, which is comparable to or larger than the size of the molecular disk/torus in nearby galaxies. Therefore it is impossible to make a direct comparison between our models and observations on the fine structure of the disk/torus. Here we compare our results with radio observations of central regions of nearby galaxies on the peak intensity and the line ratio. The Virgo high-resolution CO survey with the Nobeyama Millimeter-wave Array (NMA) by Sofue et al. (2001) revealed that many normal spiral galaxies have molecular gas cores at their central several 100 pc regions, and their 12CO (1-0) intensity is typically 200-400 K km s-1. In Fig. 4b, we showed that 12CO (2-1) intensity is 3000 K km s-1 on average, and this is larger by one order of magnitude than the observed peak intensity of normal spiral galaxies Note that, as shown in Fig. 4a, if the nuclear disks/tori have a pc-scale sub-structure, the maximum intensity could be much higher than 1000 K km s-1. By combining NMA and the 45m telescope at Nobeyama, Sofue et al. (2001) and Koda et al. (2002) found a very dense molecular core in the central region of NGC 3079, which is Seyfert 2 with a nuclear starburst. The 12CO (1-0) peak intensity of this galaxy is extremely high, K km s-1, and our torus model associated with the starburst is consistent with this high peak intensity.
For higher-J transitions, such as CO (3-2) and (4-3), the beam sizes of current observations are typically 20 arc-seconds. Therefore it is hard to make direct comparison between the observations and models. Using the 15 m James Clerk Maxwell Telescope (JCMT), Israel & Baas (2001, 2002, 2003) presented and 4-3 maps of 12CO , and maps of 13CO of 15 nearby spiral galaxies. The peak intensity of 12CO (4-3) distributed from 9 K km s-1 (NGC 278) to 1019 K km s-1 (NGC 253). Harrison, Henkel, & Russell (1999) showed that 998 K km s-1 in the central 300 pc of NGC 253 using JCMT. They also showed that the line ratio, 12CO (3-2)/12CO (2-1) at the center of NGC 253. Note that using the Heinrich-Hertz-Telescope, Dumke et al. (2001) showed 680 K km s-1 and 12CO (3-2)/12CO (2-1). The line ratio, 12CO (3-2)/12CO (2-1), shown in Fig. 10 is , if the beam size is comparable to the disk radius. Our results suggest that the line ratio in the central 100 pc region is inhomogeneous, and the apparent ratio depends on the beam size. To confirm this, we have to await future ultra-high resolution observations with the ALMA.
4. SUMMARY AND DISCUSSION
In this paper, we made the first ‘observational visualization’ of a molecular torus (or disk) around a supermassive black hole in an active galactic nucleus under the dynamical influence of starbursts through supernova explosions. Three-dimensional hydrodynamic simulations of the multi-phase gas disk/torus are used as an input for the three-dimensional non-LTE radiative transfer calculations for 12CO and 13CO lines. We found that clumpy and turbulent structure of the nuclear disk whose radius is about 30 pc can be resolved with a few pc spatial resolution, which will be achieved with the ALMA for nearby galaxies. Our results suggest that the CO-to-H2 conversion factor (X-factor) is not uniformly distributed in the cental 100 pc, and the X-factor for 12CO (1-0) is not constant against the density. On the other hand, 12CO (3-2) is nearly constant over the wide range, which is , and it can be used to estimate molecular gas mass in gas-rich galactic central regions associated with active star formation. We also found that the observed line-ratios depend on the beam sizes, and the average line-ratios (e.g. 12CO (4-3)/12CO (2-1)) do not necessarily represent the ‘real’ ratios of the ISM on a local (parsec) scale. We should be careful to use the ratios to infer the physical conditions of the ISM if the spatial resolution is not fine enough.
Although this is the first attempt to investigate the three-dimensional structure and dynamics of the ISM in the galactic central region, which could be compared directly with observations by next-generation radio interferometers, our methodology still needs further improvement in various respects. Firstly, we have not taken into account the radiation from the AGN itself. The strong UV radiation from the accretion disk could affect both the dynamics and excitation of the molecular gases (see also Ohsuga & Umemura 2001). We also assumed a uniform UV radiation field. However this uniformity would not be the case in reality, because the radiation from the massive stars distributed in the clumpy nuclear disk should affect the dissociation and excitation of molecules as well as the UV heating of the ISM non-uniformly. We cannot answer how serious these effects are on the ‘synthesized observations’ presented here, before we more consistently solve the radiation field.
The CO abundance, which is assumed constant in our calculations, could affect the intensity and the CO-to-H2 conversion factor (Sakamoto, 1996). Arimoto, Sofue, & Tsujimoto (1996) suggested that the observed CO intensities depend on the metallicity in galaxies, and they found smaller X-factors in the central regions than in outer regions of galaxies. In this paper, we assumed the solar metallicity, and a smaller X than the local value is suggested. Thus the X-factor could be even smaller in the nuclear starburst region with higher metallicity than the Galactic local value by a factor of two or maybe as much as ten. In fact, low values of X have been suggested for the central regions of galaxies (e.g. Wall et al., 1993; Regan, 2000). It is certain at least that 12CO (1-0) with the standard X-factor inferred from observations for our Galaxy should not be used without caution, especially for the dense ISM with strong star forming activities, such as starburst galaxies or ultra-luminous infrared galaxies.
The dense molecular gas can be traced not only by CO lines, but also by ionized and atomic carbon, and by lines. Under some conditions, CO molecules are photo-dissociated by UV radiation, but H2 is still present. The neutral carbon may be ionized in the photon-dominated region (PDR). Observations with the Kuiper Airborne Observatory revealed that emission is correlated with the 12CO(1-0) emission in gas-rich star forming galaxies (Stacey et al., 1991). The Balloon-borne Infrared Carbon Explorer (BICE) also found emission in the galactic plane, which shows similar distribution to CO (Nakagawa et al., 1998). The Antarctic Submillimeter Telescope and Remote Observatory (AST/RO) has recently revealed that emission has a spatial extent similar to low-J CO lines in the Galactic central regions (Martin et al., 2004). This is also the case in external galaxies, based on observations with the James Clerk Maxwell Telescope (JCMT)(Israel & Baas, 2002). These observations support the PDR picture (e.g. Tielens & Hollenbach, 1985) in terms of the molecular clouds illuminated by the nearby OB stars. In the present paper, we do not solve the UV radiation field in the torus, and photo-chemistry in terms of CO, , and is not taken into account. One should note, therefore, that the CO intensities and the conversion factors shown in §4 might be modified if the photo-chemistry and the UV radiative transfer are fully taken into account. Although such calculations are beyond the scope of the present paper, we can estimate how important the photo-chemical effects are using the published PDR models. Mochizuki & Nakagawa (2000) investigated PDR models of molecular clouds, solving chemical and thermal equilibrium with radiative transfer calculations for simple, static molecular clouds. Their method is basically based on the PDR model by Tielens & Hollenbach (1985), but they assume a spherical cloud instead of the plane-parallel geometry. The molecular clouds considered in Mochizuki & Nakagawa (2000) have typically a mass of , a mean hydrogen density , and size 2-20 pc, and these are similar to the clumps in our torus models (Wada & Norman, 2002). Mochizuki & Nakagawa (2000) found that emission originates in the outer envelope of the molecular cloud. On the other hand, CO emission is concentrated in the inner region of the cloud. They also found that luminosity of CO and the CO-to-H2 conversion factor are insensitive for the far-UV flux over about two orders of magnitude. The conversion factor is close to the standard X-factor for a relatively massive cloud (). These results imply that the UV radiation affects mainly the outer envelopes of typical molecular clouds/cores; therefore, the CO intensity distribution and conversion factor presented in the previous section would not be significantly changed even if we took into account the photo-chemistry in our model. Of course, this must ultimately be verified by fully self-consistent radiative transfer calculations with chemistry for the clumpy, turbulent medium.
We showed in this paper that spatial resolution ten-times finer than present-day observations in the radio frequency could drastically change our pictures of the ISM in the central regions of the external galaxies. Combining numerical techniques like the one presented here with the near-future observations by ALMA will be a very powerful tool for investigating the unsolved problems associated with galactic nuclei, such as the starburst-AGN connection and fueling mechanism for the AGNs.
References
- Arimoto, Sofue, & Tsujimoto (1996) Arimoto, N., Sofue, Y., & Tsujimoto, T. 1996, PASJ, 48, 275
- Bernes (1979) Bernes, C. 1979, A&A, 73, 67
- Combes & Gerin (1985) Combes, F. & Gerin, M. 1985, A&A, 150, 327
- Cid Fernandes et al. (2003) Cid Fernandes, R., González Delgado, R. M., Schmitt, H., Strochi-Bergmann, T., Pires Martins, L., Heckman, T., & Leitherer, C. 2003, ASP Conf. Ser. 290: Active Galactic Nuclei: From Central Engine to Host Galaxy, 461
- Dumke et al. (2001) Dumke, M., Nieten, C., Thuma, G., Wielebinski, R., & Walsh, W. 2001, A&A, 373, 853
- Elmegreen (2002) Elmegreen, B. G. 2002, ApJ, 577, 206
- Green & Chapman (1978) Green, S. & Chapman, S. 1978, ApJS, 37, 169
- Green & Thaddeus (1976) Green, S. & Thaddeus, P. 1976, ApJ, 205, 766
- Harrison, Henkel, & Russell (1999) Harrison, A., Henkel, C., & Russell, A. 1999, MNRAS, 303, 157
- Hogerheijde, & van der Tak (2000) Hogerheijde, M. R. & van der Tak, F. F. S. 2000, A&Ap, 362, 697
- Israel & Baas (2001) Israel, F. P. & Baas, F. 2001, A&A, 371, 433
- Israel & Baas (2002) Israel, F. P. & Baas, F. 2002, A&A, 383, 82
- Israel & Baas (2003) Israel, F. P. & Baas, F. 2003, A&A, 404, 495
- Juvela (1997) Juvela, M. 1997, A&A, 322, 943
- Koda et al. (2002) Koda, J., Sofue, Y., Kohno, K., Nakanishi, H., Onodera, S., Okumura, S. K., & Irwin, J. A. 2002, ApJ, 573, 105
- Kauffmann & Haehnelt (2000) Kauffmann, G. & Haehnelt, M. 2000, MNRAS, 311, 576
- Liou & Steffen (1993) Liou, M., Steffen, C., 1993, J.Comp.Phys., 107,23
- Martin et al. (2004) Martin, C. L., Walsh, W. M., Xiao, K., Lane, A. P., Walker, C. K., & Stark, A. A. 2004, ApJS, 150, 239
- McKee & Ostriker (1977) McKee, C.F. & Ostriker, J.P. 1977, ApJ,218,148
- Mochizuki & Nakagawa (2000) Mochizuki, K. & Nakagawa, T. 2000, ApJ, 535, 118
- Nakagawa et al. (1998) Nakagawa, T., Yui, Y. Y., Doi, Y., Okuda, H., Shibai, H., Mochizuki, K., Nishimura, T., & Low, F. J. 1998, ApJS, 115, 259
- Norman & Scoville (1988) Norman, C. & Scoville, N. 1988, ApJ, 332, 124
- Ohsuga & Umemura (2001) Ohsuga, K. & Umemura, M. 2001, A&A, 371, 890
- Oka et al. (1998) Oka, T., Hasegawa, T., Hayashi, M., Handa, T., & Sakamoto, S. 1998, ApJ, 493, 730
- Ossenkopf (2002) Ossenkopf, V. 2002, A&A, 391, 295
- Ossenkopf & Mac Low (2002) Ossenkopf, V. & Mac Low, M.-M. 2002, A&A, 390, 307
- Padoan et al. (1998) Padoan, P., Juvela, M., Bally, J., & Nordlund, A. 1998, ApJ, 504, 300
- Pier & Krolik (1992) Pier, E. A. & Krolik, J. H. 1992, ApJ, 399, L23
- Regan (2000) Regan, M. W., 2000, ApJ, 541, 142
- Sakamoto (1996) Sakamoto, S. 1996, ApJ, 462, 215
- Scoville & Solomon (1974) Scoville, N. Z. & Solomon, P. M. 1974, ApJ, 187, L67
- Sofue et al. (2001) Sofue, Y., Koda, J., Kohno, K., Okumura, S. K., Honma, M., Kawamura, A., & Irwin, J. A. 2001, ApJ, 547, L115
- Sofue et al. (2003) Sofue, Y., Koda, J., Nakanishi, H., Onodera, S., Kohno, K., Tomita, A., & Okumura, S. K. 2003, PASJ, 55, 17
- Solomon, Rivolo, Barrett, & Yahil (1987) Solomon, P. M., Rivolo, A. R., Barrett, J., & Yahil, A. 1987, ApJ, 319, 730
- Stacey et al. (1991) Stacey, G. J., Geis, N., Genzel, R., Lugten, J. B., Poglitsch, A., Sternberg, A., & Townes, C. H. 1991, ApJ, 373, 423
- Storchi-Bergmann et al. (2001) Storchi-Bergmann, T., González Delgado, R. M., Schmitt, H. R., Cid Fernandes, R., & Heckman, T. 2001, ApJ, 559, 147
- Stutzki & Guesten (1990) Stutzki, J. & Guesten, R. 1990, ApJ, 356, 513
- Tielens & Hollenbach (1985) Tielens, A. G. G. M. & Hollenbach, D. 1985, ApJ, 291, 747
- Wall et al. (1993) Wall, W. F., Jaffe, D. T., Bash, F. N., Israel, F. P., Maloney, P. R., & Baas, F. 1993, ApJ, 414, 98
- Wada (2001) Wada, K. 2001, ApJ, 559, L41 (W01)
- Wada (2004) Wada, K. 2004, Coevolution of Black Holes and Galaxies, from the Carnegie Observatories Centennial Symposia. Published by Cambridge University Press, Ed. by L. C. Ho, 2004, p. 187
- Wada & Norman (2001) Wada, K. & Norman, C. A. 2001, ApJ, 547, 172 (WN01)
- Wada & Norman (2002) Wada, K. & Norman, C. A. 2002, ApJ, 566, L21
- Wada, Meurer, & Norman (2002) Wada, K., Meurer, G., & Norman, C. A. 2002, ApJ, 577, 197
- Zhu, Seaquist, & Kuno (2003) Zhu, M., Seaquist, E. R., & Kuno, N. 2003, ApJ, 588, 243