XMM observations of the high-redshift quasar RX J1028.6-0844 at =4.276: soft X-ray spectral flattening
Abstract
We present results from a new XMM-Newton observation of the high-redshift quasar RX J1028.6-0844 at a redshift of 4.276. The soft X-ray spectral flattening, as reported by a study with ASCA previously (Yuan et al. 2000, ApJ 545, 625), is confirmed to be present, however, with reduced column density when modelled by absorption. The inferred column density for absorption intrinsic to the quasar is 2.1 for cold matter, and higher for ionised gas. The spectral flattening shows remarkable similarity with those of two similar objects, GB 1428+4217 (Worsley et al. 2004, MNRAS 350, L67) and PMN J0525-3343 (Worsley et al. 2004, MNRAS 350, 207). The results improve upon those obtained from a previous short-exposure observation for RX J1028.6-0844 with XMM-Newton (Grupe et al. 2004, AJ 127, 1). A comparative study of the two XMM-Newton observations reveals a change in the power-law photon index from 1.3 to 1.5 on timescales of about one year. A tentative excess emission feature in the rest-frame 5–10 keV band is suggested, which is similar to that marginally suggested for GB 1428+4217.
keywords:
galaxies: active – galaxies: individual: RX J1028.6-0844 – X-ray: galaxies1 Introduction
High-redshift quasars are powerful cosmological probes to study the evolution of massive black holes and quasar environments in the early universe. Previous X-ray observations suggested the presence of soft X-ray spectral flattening111 This effect is commonly referred to as excess absorption in the literature. Here we use a generalised term in consideration of possible alternative explanations. in some radio-loud quasars at redshifts =2–3 (Wilkes et al. 1992, Elvis et al. 1994, Cappi et al. 1997, Fiore et al. 1998, Yuan & Brinkmann 1998, Reeves & Turner 2000). This result is strengthened and extended to higher redshifts by its detection in a few extremely X-ray/radio-loud quasars at 4, namely RX J1028.6-0844 (Yuan et al. 2000), GB 1428+4217 (Boller et al. 2000, Fabian et al. 2001b), and PMN J0525-3343 (Fabian et al. 2001a), with ROSAT, ASCA, and BeppoSAX. These objects seem to have characteristics typical of blazars (Fabian et al. 1997, 1998; Zickgraf et al. 1997, Moran & Helfand 1997, Hook & McMahon 1998). The most plausible explanation for this effect is photoelectric absorption of soft X-rays by associated medium with column densities of , although intrinsic spectral flattening cannot be excluded. The physical implication of this effect has been discussed extensively in the literature in terms of excess absorption (Elvis et al. 1998, Yuan et al. 2000, Fabian et al. 2001a,b) and intrinsic breaks in the X-ray spectra of blazars (Fabian et al. 2001a,b).
The contemporary X-ray observatories XMM-Newton and Chandra should be able to test these previous findings. Indeed, soft X-ray spectral flattening has been confirmed to be present in GB 1428+4217 and PMN J0525-3343 (XMM-Newton, Worsley et al. 2004a,b), and in some other objects at lower redshifts, e.g. PKS 2126-0158 at =3.27 (XMM-Newton, Ferrero & Brinkmann 2003; BeppoSAX, Fiore et al. 2003). Tentative evidence was also found in the combined spectra of several , moderately radio-loud quasars (Chandra , Bassett et al. 2004).
RX J1028.6-0844 was first detected as an X-ray source in the ROSAT All-sky Survey (RASS) and was identified as a quasar at =4.276 (Zickgraf et al. 1997). It is also a radio source (PKS B1026-084) with a flux density of 220 mJy at 5 GHz (Otrupcek & Wright 1991) and a flat radio spectrum. Its X-ray colors in the ROSAT energy band imply a hard spectrum (Zickgraf et al. 1997). Its first X-ray spectrum, as obtained with a long ASCA observation made in 1999, flattens substantially towards soft X-ray energies (Yuan et al. 2000); an excess (cold) absorption model required a column density of for local absorber or for absorber intrinsic to the quasar. A later short-exposure XMM-Newton observation found, however, only marginal evidence for excess absorption (Grupe et al. 2004). In this paper we report on a new XMM-Newton observation of RX J1028.6-0844 with an exposure much longer than the previous observation. The measured X-ray spectrum—with substantially improved photon statistics—confirms the presence of the soft X-ray spectral flattening as detected by ASCA. The observations and data reduction are described in Sect. 2. We present the spectral analysis in Sect. 3, including a re-analysis of the previous XMM-Newton observation. Discussion of the results is given in Sect. 4, including comparisons with previous observations and with other similar objects. Conclusions are summarised in Sect. 5. We adopt =71 km s-1 Mpc-1, =0.73, and =0.27. The Galactic column density in the direction of RX J1028.6-0844 is (Dickey & Lockman 1990). Errors are quoted at the level for one parameter of interest unless stated otherwise.
2 Observation and data reduction
The quasar RX J1028.6-0844 was observed with XMM-Newton on June 13th, 2003 during satellite revolution 643 (observation ID 0153290101). The EPIC (European Photon Imaging Camera) MOS1, MOS2, and PN cameras were operated in the ‘primary full window’ imaging mode and a thin filter was used to screen out optical/UV light. The observational log is shown in Table 1. The XMM-Newton Science Analysis System (SAS, v.6.0) and the most up-to-date calibrations (August 2004) were used for data reduction. We followed standard data reduction and screening procedures. A fraction of the observation period suffered from high flaring background caused by soft protons. By inspecting the light curve of energy 10 keV, single events in the whole field of view, these periods were identified as having count rates higher than 1 and 0.35 for PN and MOS detectors, respectively, as recommended by the XMM-Newton Science Operation Centre (SOC).
| PN | MOS1 | MOS2 | |
| observation duration (ks) | 41.5 | 43.1 | 43.1 |
| good exposure (ks) | 15.8 | 21.3 | 22.1 |
| energy band used (keV) | 0.2–10 | 0.3-10 | 0.3–10 |
| events pattern used | 0–4 | 0–12 | 0–12 |
| source extraction radius | 32″ | 32″ | 32″ |
| source+BGD counts | 5024 | 2006 | 2080 |
| net source counts | 4854 | 1920 | 1986 |
| source count rate () | 30.7 0.5 | 9.00.2 | 9.00.2 |
| fluxa ( ) | 1.160.04 | 1.140.07 | 1.140.06 |
| fluxb ( ) | 1.170.04 | 1.150.07 | 1.150.06 |
-
a
Flux in the 1–10 keV band; the model of a power-law with intrinsic absorption at =4.276 plus is used.
-
b
Galactic absorption corrected flux in the 1–10 keV band; the same model as in is used.
The quasar was detected at a sky position RA=10h 28m 38s.84, Dec= 44′ 38″.3 (J2000), 0″.6 away from the position of its radio counterpart (Simbad database) and 2″.1 of its optical counterpart (Zickgraf et al. 1997). Source X-ray events were extracted from a circle of 32 ″radius, which corresponds to the 87 per cent encircled energy radius. Background events were extracted from source-free regions using a concentric annulus of 52/128 ″radii for the MOS detectors, and circles of 32 ″radius at the same CCD read-out column as the source position for the PN detector. X-ray images, light-curves, and spectra were generated from the extracted, cleaned events for the source and background. Parameters for data screening and source extraction are listed in Table 1. No photon ‘pile-up’ problem was found, as expected. nor effect of low-energy noise above 0.2 keV. We used the spectral range of 0.2–10 keV for PN and 0.3–10 keV for MOS. The EPIC response files (rmf and arf) were generated using the source information on the detectors. The EPIC spectra were re-binned to have a minimum of 30 counts in each bin.
The source profile in the 0.3–2 keV band was compared against the point spread function of the detectors (FWHM of 5 ″for MOS and 6 ″for PN) and was found to be consistent with a point-like source. There was no significant variability found during the 40 ks exposure, though a 10 per cent drop in count rates (averaged over 5 ks) was marginally detected, from 0.3160.09 at the beginning to 0.2710.08 towards the end of the observation.
3 X-ray spectral analysis
Due to an increase in the surface charge loss properties of the CCDs, which degrades the energy resolution, there has been a time-dependent, significant change in the low-energy redistribution properties of the MOS cameras. This effect has been taken into account in the most up-to-date MOS calibration files; however, some small systematic uncertainty may still remain at below 0.5 keV (Kirsch 2004, Kirsch et al. 2004). To minimise possible biases induced in the results, we treat the MOS spectra in two ways and compare the results. The first was to simply omit the spectral range below 0.5 keV; the second was to use the spectral range down to 0.3 keV and introduce a systematic error of 2 per cent in the 0.3–0.5 keV band (as recommended in Kirsch 2004, Kirsch et al. 2004). As seen in Table 2, these two methods yielded statistically consistent results. We thus formally quote the results obtained using the 0.3–10 keV band. XSPEC (v.11.3) was used for spectral fitting.
3.1 Soft X-ray spectral flattening
3.1.1 Power-law model with local cold absorption
We began by fitting the spectra of each detector individually with a single power-law model 222 , where is the photon index. modified by neutral absorption with a column density as a free parameter. This model gave acceptable333 We regard a model fit as acceptable if the null hypothesis probability derived from the fit is greater than 10 per cent (0.1), as is commonly quoted. fits to the PN and the MOS1 spectra (see Table 2), but not to the MOS2 spectrum [reduced =1.4 for 53 degree of freedom (d.o.f.), i.e. a null hypothesis probability of =0.02 only]. Inspection of the residuals of the fit singled out one energy bin at 1.82 keV (a width of 80 eV), which contributed 11 out of the total of 76. The feature can be fitted with either a narrow notch feature at =1.830.02 keV (a width of 49 eV and a covering fraction 0.99) or a Gaussian absorption line (=1.83 keV) of infinitely small width. This energy corresponds to 9.7 keV in the quasar’s rest-frame, at which no known physical absorption feature is present. On the other hand, it is coincident with the instrumental absorption feature at 1.84 keV due to the Silicon edge. Furthermore, it appears in neither the PN nor the MOS1 spectrum. Excluding the 1.82 keV bin reduced the by 12, and resulted in an acceptable fit (=1.2 for 52 d.o.f.) with fitted parameters in good agreement with those for MOS1 within 1- errors. We therefore consider the disagreement between MOS2 and MOS1/PN to be due to inadequate MOS2 calibration around the Silicon edge, and ignore this energy bin hereafter. Parameters (including normalisations) for the two MOS spectra were tied together to be the same in joint fitting (MOS1+2). The fitted of ) is significantly higher than (Table 2). The photon index is now 1.55, typical of blazars.
A power-law with fixed Galactic absorption (4.59 ) yielded unacceptable fit and a flat photon index (=1.3–1.4, Table 2). The improvement in for the fit with freely fitted over that with fixed = is substantial— was reduced by 36 for PN and by 31 for a joint MOS1+2 fit for one additional free parameter. Applying the -test444 Recently, Protassov et al. (2002) have questioned the validity of using the -test to test for the significance of adding an additional spectral component, as this involves testing a hypothesis that is on the boundary of the parameter space. We note that the -test we used here is not affected by the boundary condition problem, because we are testing for the significance of the different values in between = (null hypothesis) and the free-fitted value, rather than for the addition of a model component. (Bevington & Robinson 1992) gives a chance probability 0.001.
For fixed =, acceptable fit was obtained only within the restricted 1–10 keV range. We plotted in Fig. 1 the data, the best-fit model (for a joint PN and MOS1+2 spectral fit) and its extrapolation down to the low-energy end of the detectors, and the data-to-model ratio as residuals. A systematic deficit of photons below 1 keV is clearly indicated. Fig. 2 shows the confidence contours for the free-fitted total (Galactic plus excess) and for PN and MOS1+2, respectively. Absorption in excess of is evident. It is noted that PN gives systematically lower values than MOS. We regard the results from MOS to be more reliable than those from PN in consideration of the EPIC cross calibration uncertainties as discussed in details in Appendix A.
| Detector | a | /dof | ||
| local neutral absorption, free | ||||
| PNc | 8.70.7 | 1.530.03 | 137.8/147 | 0.69 |
| MOS1 (0.5–10keV) | 12.82.5 | 1.540.06 | 57.7/52 | 0.27 |
| MOS1 (0.3–10keV) | 12.72.0 | 1.54 | 68/67 | 0.44 |
| MOS2 (0.5–10keV) | 11.32.5 | 1.57 | 63.7/52 | 0.13 |
| MOS2 (0.3–10keV) | 9.01.6 | 1.530.05 | 76/67 | 0.21 |
| MOS1+2 (0.5–10keV) | 12.11.7 | 1.56 | 122.8/107 | 0.14 |
| MOS1+2 (0.3–10keV) | 11.11.2 | 1.540.04 | 150/137 | 0.21 |
| local neutral absorption, fixed | ||||
| PN | 4.59 (fix) | 1.370.02 | 173/148 | 0.07 |
| MOS1 (0.5–10keV) | 4.59 (fix) | 1.360.04 | 69/53 | 0.07 |
| MOS1 (0.3–10keV) | 4.59 (fix) | 1.300.03 | 91/68 | 0.03 |
| MOS2 (0.5–10keV) | 4.59 (fix) | 1.430.04 | 71/53 | 0.05 |
| MOS2 (0.3–10keV) | 4.59 (fix) | 1.400.03 | 84/68 | 0.09 |
| MOS1+2 (0.5–10keV) | 4.59 (fix) | 1.400.03 | 141/108 | 0.017 |
| MOS1+2 (0.3–10keV) | 4.59 (fix) | 1.350.02 | 181/138 | 0.008 |
| power-law + and excess absorption at | ||||
| Detector | /dof | |||
| PN | 14930 | 136/147 | ||
| MOS1+MOS2 (0.5–10keV) | 122/107 | 0.15 | ||
| MOS1+MOS2 (0.3–10keV) | 22246 | 1.490.03 | 153/137 | 0.17 |
| broken power-law + Galactic absorption (PN+MOS1+2) | ||||
| /dof | ||||
| PN | 133/146 | 0.77 | ||
| MOS1+2 (0.5–10keV) | 122/105 | 0.12 | ||
| MOS1+2 (0.3–10keV) | 148/135 | 0.21 | ||
-
a
Column density of hydrogen in units of
-
b
Null hypothesis probability of the test for the fit
- c
-
d
The break energy of broken power-law in keV. When no errors are given, the value is unconstrained within a physically meaningful range.


3.1.2 Absorption intrinsic to the quasar
This is the most plausible postulate in consideration of the statistical argument presented in previous work (see Introduction for references). For neutral absorber, was found assuming cosmic abundances. The confidence contours for the excess versus are shown in Fig. 3 for PN (dashed) and MOS1+2, respectively. If the metallicity of the absorber is lower than the cosmic value, which is not unexpected at such a high redshift—could be about 10 per cent or less (e.g. Lu et al. 1996, Pettini et al. 1997, Prochaska & Wolfe 2000), the would be correspondingly higher than the value give here. The absorption-corrected luminosity in the quasar rest-frame is 9.2 in 1–10 keV and 2.64 in 1–50 keV, respectively.
If the absorber is close enough to the central source, the gas is likely to be ionised. Indeed, the optical spectra of RX J1028.6-0844 taken by Peroux et al. (2001) and Zickgraf et al. (1997) show no significant Lyman limit absorption at 912 Å . An estimate of the optical depth of the Lyman limit absorption places an upper limit on the neutral hydrogen column density to be along the line-of-sight to the optical–UV emission region (Yuan et al. 2000). If the X-ray absorber also intercepts the optical–UV light, at least moderate ionisation of the gas is required. The lack of strong optical–UV extinction can be explained by ionised, dust-free absorber. It is interesting to note that such an optical–UV property seems to be common among this type of objects (Yuan et al. 2000, Fabian et al. 2001a,b). We tried to model the excess absorption with ionised absorption (absori in XSPEC). The ionisation parameter (as defined in Done et al. 1992), however, could not be constrained with the current data ranging from an almost neutral to highly ionised absorber. The results of such an analysis are given in Fig. 4, where the data from the two XMM-Newton observations are combined in order to achieve a better constraint on the parameters (see Sect. 3.2.2). With increasing ionisation state, the required column density increases from to .
No redshifted K-shell absorption edges from iron ions (=7.1–9.3 keV in the rest-frame from FeI to FeXXVI) are detected. Assuming cosmic abundance of iron (), a K-shell edge with optical depth 0.02–0.1 is predicted from the above range for neutral–highly ionised iron. This is consistent with the upper limit on estimated from the joint PN and MOS1+2 spectra, which ranges from 0.1 to 0.2 (90 per cent level) for ions from FeI to FeXXVI (absorption cross section from to cm2 atom-1).

3.1.3 Intrinsic spectral break
We also considered the possibility that the soft X-ray spectral flattening is an intrinsic feature. The physical implication of a break in the intrinsic X-ray spectra of blazars has been discussed in Fabian et al. (2001a,b) in the context of a cut-off in the energy distribution of electrons or of soft seed photons for Compton scattering. We modelled the spectral flattening with, as an approximation, a broken power-law modified by local absorption. Acceptable fits could be obtained for both PN and MOS1+2. However, and the low energy photon index could not be constrained due to strong coupling. We thus fixed =. The fitted high-energy photon indices are 1.440.04 (PN) and 1.490.06 (MOS1+2), and the break energy and low-energy index are listed in Table 2. This model gave acceptable fits which are statistically indistinguishable from the models of power-law with either local or intrinsic absorption.
3.2 Comparison with a previous observation and spectral variability
3.2.1 A previous XMM-Newton observation
RX J1028.6-0844 was previously observed with XMM-Newton in revolution 445 with a short exposure of 7 ks in May, 2002 (PI. S. Mathur, observation ID: 0093160701). The results, as published in Grupe et al. (2004), gave absorption values similar to what we find here, but, a flatter spectral slope of . In order to achieve a self-consistent comparison of the two observations—free from the effects introduced by different versions of the evolving calibration and data processing software, we also analysed the data from that observation. The data were taken from the XMM-Newton science archive. The observation was described in Grupe et al. (2004). We used exactly the same data screening criteria and source/background extraction regions as used for the current observation (see Sect. 2 and Table 1). The good exposure and source count rate are 3.7 ks and 0.39 for PN (0.2–10 keV), and 6.9/7.0 ks and 0.12/0.13 for MOS1/2 (0.3–10 keV). A comparison with Table 1 reveals that the broad-band count rates were higher in the 2002 observation than in 2003 by about 30 per cent.
The PN and MOS spectra were binned to have a minimum of 25 and 20 counts in each bin, respectively. The results of the spectral fits are in good agreement with those obtained by Grupe et al. (2004). For an absorbed power-law model, the total local absorption is for joint MOS1 and MOS2 (MOS1+2) spectra and for PN. Again, the fitted is systematically lower for PN than for MOS, as found in the 2003 observation. While the absorption is in good agreement between the two observations, the photon indices are not. The photon indices obtained for the 2002 observation are = and for MOS1+2 and PN, respectively, i.e. the spectrum was steeper during the observation of 2003 (). This result can be seen clearly in Fig. 3, where excess (neutral) absorption is plotted versus for the 2002 observation, assuming absorption is intrinsic to the quasar at =4.276. The spectral steepening remains even when only the hard band 2–10 keV spectra were considered (= and for MOS1+2 and PN, respectively). The Galactic absorption corrected flux in the 1–10 keV band is 1.9 (averaged MOS1 and MOS2 value).
3.2.2 Joint spectral fit of the two observations
We quantified the spectral variability by fitting jointly the spectra of the two observations. We used the MOS spectra only, in consideration of possible PN calibration uncertainties (see Appendix A). For MOS1 and MOS2 spectra from the same observation, all parameters (including normalisation) were tied together. The results are summarised in Table 3.
Firstly, since the fitted of the two observations are in good agreement, we assumed that there was no variability in the absorption. Thus the values for the two observations were tied together in the fitting. Absorbed power-law models were used. As a test, we tied = together in the fitting, which resulted in a fit only marginally acceptable (=242 for 219 d.o.f.). Setting the two indices as independent parameters improved the fit significantly, reducing by 24 for one additional free parameter; the -test [Bevington & Robinson 1992; see Footnote 4 for the argument for the validity of the -test used here regarding the boundary condition warning discussed by Protassov et al. (2002).] gives a chance probability for and being the same. The fit is good (=217 for 218 d.o.f.), indicating that the spectra of the two observations can be fitted well with two different continua (in slope and normalisation) attenuated by the same amount of absorption. The fluxes in the 0.2–1 keV band were comparable in the two observations, while in the 1–10 keV band it was higher by a factor of two in May 2002 compared to June 2003 (Table 3). The two power-law continua, before attenuation by any absorption, cross over at keV in the observer’s frame, i.e. keV in the quasar rest-frame.
The combined data set improves the spectral photon statistics and gives a better constraint on the excess absorption. For neutral absorber intrinsic to the quasar, =2.1() , i.e. excess absorption is evident. An ionised absorber model also gives a good fit, suggesting that the ionisation status is unconstrained. The confidence contours for the ionisation parameter and are shown in Fig. 4.
Secondly, we tested whether the variation in spectral slope could result from variability in the absorption, such as from the ionisation parameter. We fitted the ionised absorber model with independent ionisation parameters and , but tied the indices together (=). No satisfactory result could be obtained for this model; the best fit was significantly worse than that with the above variable- model (). This is not surprising, as the difference in arises primarily in the hard 1–10 keV band, which corresponds to 5.3–53 keV in the quasar rest-frame. At such high energies the amount of absorption of X-ray photons is decreasing dramatically.
We also fitted a broken power-law to the data with absorption fixed at . There is a marginal indication of a higher break energy 1.60.2 keV for the flatter spectrum in May 2002 than for the steeper spectrum in June 2003; however, the significance is low. The low-energy photon indices and the normalisations at 1 keV (below or close to the break energies) are comparable in the 2002 and 2003 observations.
No spectral variability is detected within a 40 ks duration in the June 2003 observation with XMM-Newton.
| parameter | June 2003 | May 2002 |
|---|---|---|
| power-law with neutral absorption /d.o.f.=217/218 | ||
| photon index | 1.530.04 | 1.310.04 |
| normalisation @1keV () | 1.770.07 | 2.130.09 |
| total absorption () | 0.110.01 (tied) | |
| fluxa 0.2–1/1–10 keV () | 1.2/11.5 | 1.4/19.1 |
| neutral absorption at z=4.276, fixed /d.o.f.=221/218 | ||
| photon index | 1.480.03 | 1.260.04 |
| normalisation @1keV () | 1.650.05 | 1.990.07 |
| excess absorption () | 2.1 (tied) | |
| fluxb 0.2–1/1–10 keV () | 1.7/11.6 | 1.8/19.2 |
| luminosityc 1–10/1–50 keV () | 0.92/2.58 | 1.06/3.88 |
| broken power-law, fixed /d.o.f.=214/215 | ||
| break energy (keV) | 1.10.1 | 1.60.2 |
| low-energy index | 0.920.11 | 0.870.09 |
| high-energy index | 1.500.04 | 1.330.07 |
| normalisation @1keV () | 1.540.06 | 1.750.06 |
-
a
Galactic absorption uncorrected flux in units of .
-
b
Galactic absorption corrected flux in units of .
-
c
Absorption corrected luminosity in the quasar rest-frame in units of .

4 Discussion
4.1 The presence of soft X-ray spectral flattening
4.1.1 XMM-Newton results
We have shown the presence of soft X-ray spectral flattening in the z=4.276 quasar RX J1028.6-0844 using an observation made with XMM-Newton. The result confirms the previous report based on ASCA data (Yuan et al. 2000). In the excess absorption scenario, the derived absorption from our analysis are consistent with those obtained by Grupe et al. (2004) from a previous short XMM-Newton observation. In that study the authors suggested that strong excess absorption was marginal. This is not surprising given the lower signal-to-noise of their data and consequently the weaker constraints on compared to this work, which benefits from a much longer exposure.
We note that PN tends to give systematically lower values than MOS. This is most likely due to discrepancies in the calibration below 1 keV between PN and MOS, as reported in the most recent XMM calibration status (Kirsh et al. 2004, see also XMM-Newton SOC XMM-SOC-CAL-TN-0018 555http://xmm.vilspa.esa.es/es/external/xmm_sw_cal/calib/index.shtml). Although a complete solution is yet to be reached, preliminary indications suggest that PN is most likely the cause of the problem. A detailed discussion on this issue and a quantitative PN–MOS comparison taking the most up-to-date calibration into account is given in Appendix A. In summary, we consider the values derived from MOS spectra to be more reliable. Furthermore, it may also be the case that both PN and MOS yield systematically higher fluxes at low energies compared to XMM-Newton RGS and Chandra. If this turns out to be the case, the true column in the absorption scenario could be even higher than what is reported here.
4.1.2 Comparison with previous results
The total assuming local absorption is ) measured from the XMM-Newton observations (joint MOS from the two observations). This value is a factor of 2–3 times smaller than the value measured from ASCA (Yuan et al. 2000). For intrinsic absorption at , the inferred by XMM-Newton (a few times ) becomes about 10 times smaller than that obtained by ASCA. Intrinsic variability in the absorption cannot be ruled out. However, we speculate that a systematic difference in the instrumental calibration of the two missions might play at least a partial role. This is because a similar trend was also found for GB 1428+4217 and PMN J0525-3343 (Worsley et al. 2004a,b). It is not clear which instrument causes the difference. In the cases of GB 1428+4217 and PMN J0525-3343, the previous results before XMM-Newton were obtained by a joint fit of both the ASCA and BeppoSAX spectra (Fabian 2001a,b). This fact, together with the aforementioned XMM EPIC calibration issue, suggests that perhaps both missions, rather than merely XMM-Newton, may be the cause. Improved XMM EPIC calibration and independent investigations by other instruments (Chandra or XMM-Newton RGS) are needed to resolve this problem.
Comparing the observations of XMM-Newton in 2003 and of ASCA in 1999, the spectral photon indices are consistent within their mutual 1- errors; no significant flux variability (10 per cent) is detected in the 1–10 keV band.
4.1.3 Comparison with other objects
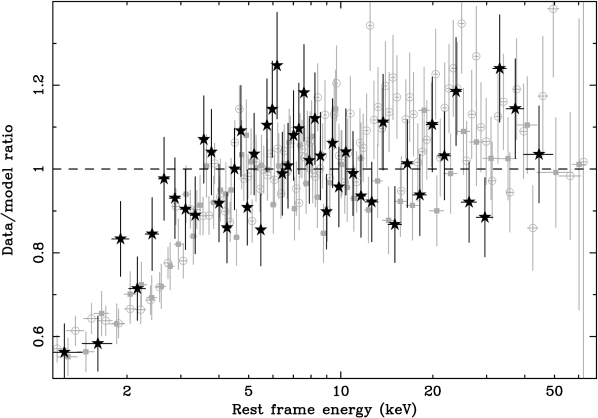
We compare the spectral shape of RX J1028.6-0844 with those of GB 1428+4217 and PMN J0525-3343 in the quasar’s rest-frame. Following Worsley et al. (2004b), we produced the data-to-model ratio for RX J1028.6-0844 where the model is the best-fit power-law with Galactic absorption in the restricted 1–10 keV band. The result is plotted in Fig. 5, together with those for GB 1428+4217 and PMN J0525-3343 from Worsley et al. (2004b, their Figs. 2 and 5). It should be noted that the data-to-model ratio is free from the effects of instrument response, Galactic absorption, and redshift. It can be seen that the three spectra agree remarkably well in terms of the break energy and the shape of the spectral cutoff. The values of intrinsic (cold) absorbers of a few times as measured by XMM-Newton in these three objects are in good agreement. The striking spectral similarity shared by these objects at different redshifts argues for a real soft X-ray flattening against instrumental effects, and suggests a common nature to this phenomenon.
Another similarity lies in their optical–UV properties, which argue for a highly ionised, dust-free absorber model (Yuan et al. 2000; Fabian et al. 2001a,b; Worsley et al. 2004a,b). It is interesting to note that excess absorption in several , moderately radio-loud quasars, as tentatively suggested by their combined Chandra spectra, has also similar values of a few times (Bassett et al. 2004).
4.2 X-ray spectral variability
It is worth stressing that while spectral variability is indeed typical of flat-spectrum quasars, the extremely flat spectrum in the 2–10 keV band during the 2002 observation is consistent only within the 2 uncertainty range with the limiting value of for a relativistic distribution of particles emitting via synchrotron and inverse Compton (in the simplest hypothesis). If the production of such flat high-energy spectra are confirmed, revision of the widely accepted emission scenarios would be required.
Although flux variability over short timescales is a distinctive characteristic of blazar emission, no significant variations have been detected within a single observation. It should be noted, however, that due to the high redshift of the source, the intrinsic timescale sampled by the observation ( 2 hr) might be too short to detect significant variations (for powerful quasars doubling timescales of the order several hour to a day might be more typical, e.g. 3C279, Wherle et al. 1998).
4.3 Excess emission around 5–10 keV?
Worsley et al. (2004b) pointed out possible excess emission at energies around 5–10 keV in the quasar rest-frame spectrum for GB 1428+4217. The evidence is only marginal. Interestingly, the same spectral structure also appears in RX J1028.6-0844, as can be seen in Fig. 5. The similarity of the energy position of this feature in two objects at different redshifts is remarkable. If this feature is real, it may come from an additional spectral component which is peaked around 5–10 keV in the rest-frame. We modelled the XMM-Newton spectra taken in May 2003 by adding a steep power-law component in the above spectral models, following Worsley et al. (2004b). Both the PN and MOS1+2 spectra were fitted jointly to improve the statistics. A steep photon index is yielded for the second power-law, as =2.3–4.4 for a model with local absorption and =1.9–7.2 for intrinsic absorption at =4.276 (90 per cent confidence range for 1 interesting parameter). These values are consistent with that obtained for GB 1428+4217, 1.8–2.6 (Worsley et al. 2004b). The model does improve the fit in the 5–10 keV (rest-frame) band, though the statistical significance is not high ( for 3 additional free parameters).
If this excess emission feature proves to be real, it might be the first evidence for the presence of emission originating from bulk comptonisation on the soft photon field through which the relativistic jet propagates (Begelman & Sikora 1987). The detection of such a feature could carry key clues to the amount of (cold) leptons flowing in the jet (Sikora & Madejski 2000). The lack of its detection in the majority of objects so far remains a puzzle. However, in most cases the X-ray emission might be dominated by the non-thermal emission from relativistic particles, and thus the possibility of detecting such a component could be limited to cases of particularly high jet Lorentz factors (which would shift its peak up to high energies) and/or low-states/steep power-law of the non-thermal relativistic component (the latter case could of course be tested, in principle). Observations with even higher signal-to-noise than the present ones or stacking spectra from different sources might be a way to clarify the issue.
5 Conclusions
We have presented a new X-ray spectroscopic study of the high redshift (=4.276) quasar RX J1028.6-0844 with XMM-Newton. The high signal-to-noise spectrum confirms the presence of the soft X-ray spectral flattening, which was reported previously with ASCA data (Yuan et al. 2000). This spectral feature can be modelled by either excess absorption of the quasar X-rays or an intrinsic break at 1 keV in the X-ray spectra of the source. In the absorption scenario, the derived column density for cold absorber intrinsic to the quasar is 2.1() . This value is comparable to those reported in two similar objects GB 1428+4217 (=4.72) and PMN J0525-3343 (=4.4) from XMM-Newton observations. The remarkable similarity in the shape of the spectral cutoff among these objects at different redshifts argues against instrumental effects as an origin, but rather argues for a common nature to the soft X-ray flattening in high- blazars. In terms of the soft X-ray spectral flattening, the results are consistent statistically with and improved upon those obtained from a previous short-exposure observation for RX J1028.6-0844 with XMM-Newton (Grupe et al. 2004). A comparative study of the two XMM-Newton observations revealed a spectral steepening from 1.3 in 2002 to 1.5 in 2003, and a consequent drop in flux in the hard energy band above 1 keV.
The derived columns from XMM-Newton observations, however, are reduced when compared with the previous ASCA results (Yuan et al. 2000). We speculate that this might be due to systematic instrumental effects, probably inherent in both missions. Future improved XMM-Newton EPIC calibration and independent investigations by other instruments (such as Chandra) are needed to resolve this issue.
A tentative excess emission feature in the rest-frame 5–10 keV band is suggested, which bares remarkable similarity to that marginally imprinted in the X-ray spectrum of GB 1428+4217 (Worsley et al. 2004b).
Acknowledgements
We thank Richard Saxton of the XMM-Newton calibration team for useful advice on the EPIC calibration issues. Matt Worsley is thanked for help in making the plot of Fig. 5. W.Y. thanks Franz Bauer for comments and a careful reading of the manuscript. ACF thanks the Royal Society for their support. AC acknowledges the MIUR and INAF for financial support. This research has made use of the NASA/IPAC Extragalactic Database (NED) which is operated by the Jet Propulsion Laboratory, California Institute of Technology, under contract with the National Aeronautics and Space Administration.
References
- Bassett et al. (2004) Bassett L.C., Brandt W.N., Schneider D.P., Vignali C., Chartas G., Garmire G.P., AJ, 128, 523
- Begelman (1987) Begelman M.C. & Sikora M., 1987, ApJ, 322, 650
- Bevington & Robinson (1992) Bevington P.R. & Robinson D.K., 1992, Data reduction and error analysis for the Physical sciences, 2nd edition, McGraw-Hill, Inc.
- Boller et al. (2000) Boller Th., Fabian A.C., Brandt W.N., & Freyberg M.J., 2000, MNRAS, 315, L23
- Cappi et al. (1997) Cappi M., Matsuoka M., Comastri A., et al., 1997, ApJ, 478, 492
- Dickey and Lockman (1990) Dickey J.M. & Lockman F.J., 1990, ARA&A 28, 215
- Done et al. (1992) Done C., Mulchaey J.S., Mushotzky R.F., Arnaud K.A., 1992, ApJ, 395, 275
- Elvis et al. (1994) Elvis M., Fiore F., Wilkes B., McDowell J., Bechtold J., 1994, ApJ, 422, 60
- Elvis et al. (1998) Elvis M., Fiore F., Giommi P., Padovani P., 1998, ApJ, 492, 91
- Fabian et al. (1997) Fabian A.C., Brandt W.N., McMahon R.G., Hook I.M., 1997, MNRAS, 291, L5
- Fabian et al. (1998) Fabian A.C., Iwasawa K., Celotti A., et al., 1998, MNRAS, 295, L25
- Fabian et al. (2001a) Fabian A.C., Celotti A., Iwasawa K., McMahon R.G., Carilli C.L., Brandt W.N., Ghisellini G., Hook I.M., 2001a, MNRAS, 323, 373
- Fabian et al. (2001b) Fabian, A.C., Celotti, A., Iwasawa K., Ghisellini G., 2001b, MNRAS, 324, 628
- Ferrero (2003) Ferrero E. & Brinkmann W., 2003, A&A, 402, 465
- Fiore et al. (1998) Fiore F., Elvis M., Giommi P., Padovani P., 1998, ApJ, 492, 79
- Fiore et al. (2003) Fiore F., Elvis M., Maiolino R., Nicastro F., Siemiginowska A., Stratta G., D’Elia V., 2003, A&A, 409, 57
- Grupe et al. (2004) Grupe D., Mathur S., Wilkes B., Elvis M., 2004, AJ, 127, 1
- Hook et al. (1998) Hook I.M. & McMahon R.G., 1998, MNRAS, 294, L7
- Kirsh et al. (2004) Kirsch M., Altieri B., Chen B., Haberl F., Metcalfe L., et al. 2004, SPIE in press, (astro-ph/0407257)
- Kirsh (2004) Kirsch M., 2004, ‘EPIC status of calibration and data analysis’, 2004, XMM-Newton SOC, XMM-SOC-CAL-TN-0018 (July, 28, 2004)
- Lu et al. (1996) Lu L., Sargent W.L.W., Barlow T.A., Churchill C.W., Vogt S., 1996, ApJS, 107, 475
- Moran and Helfand (1997) Moran E.C. & Helfand D.J., 1997, ApJL, 484, 95
- Otrupcek and Wright (1991) Otrupcek R.E. & Wright A.E., 1991, PASA, 9, 170
- Peroux et al. (2001) P roux C., Storrie-Lombardi L.J., McMahon R.G., Irwin M. Hook I.M., 2001, AJ, 121, 1799
- Pettini et al. (1997) Pettini, M., Smith, L. J., King, D. L., Hunstead, R. W., 1997, ApJ, 486, 665
- Prochaska and Wolfe (2000) Prochaska J.X. and Wolfe A.W., 2000, ApJL, 533, 5
- Protassov et al. (2002) Protassov R., van Dyk D., Connors A., Kashyap V.L., Siemiginowska A., 2002, ApJ, 571, 545
- Reeves et al. (1997) Reeves, J. N., Turner, M. J. L., Ohashi, T., Kii, T., 1997, MNRAS, 292, 468
- Sikora (2000) Sikora M., Madejski G, 2000, ApJ 534, 109
- Wehrle etal. (1998) Wehrle A.E., Pian E., Urry C.M., Maraschi L., McHardy I.M., Lawson A.J., Ghisellini G., Hartman R.C., et al., 1998, ApJ, 497, 178
- Wilkes et al. (1992) Wilkes, B. J., Elvis, M., Fiore, F., et al., 1992, ApJL, 393, L1
- Worsley et al. (2004a) Worsley M.A., Fabian, A.C., Turner A.K., Celotti A., Iwasawa K., 2004a, MNRAS, 350, 207
- Worsley et al. (2004b) Worsley M.A., Fabian, A.C., Celotti A., Iwasawa K., 2004b, MNRAS, 350, L67
- Yuan and Brinkmann (1999) Yuan, W. and Brinkmann, W., 1999, in Highlights in X-ray Astronomy, ed., Aschenbach, B., and Freyberg, M., (MPE Report 272), 240
- Yuan et al. (2000) Yuan W., Matsuoka M., Wang T., Ueno S., Kubo H., Mihara T., 2000, ApJ, 545, 625
- Zickgraf et al. (1997) Zickgraf, F.-J., Voges, W., Krautter, J., et al., 1997, A&A, 323, L21
Appendix A Effect of calibration uncertainty on the results
In the most updated reports on the XMM-Newton calibration status, Kirsh et al. (2004, see also XMM-Newton SOC XMM-SOC-CAL-TN-0018 666http://xmm.vilspa.esa.es/es/external/xmm_sw_cal/calib/index.shtml) demonstrated significant discrepancies at low energies (below 1keV) between the EPIC PN and MOS cameras, and the EPIC and the RGS777The Reflection Grating Spectrometer on-board XMM-Newton., as well as overall differences in the XMM-Newton instruments and those of Chandra. While MOS and RGS agree with each other in general, PN gives higher fluxes below 0.7 keV by 10–15 per cent with respect to MOS and by 20–30 per cent with respect to RGS (Kirsh et al. 2004). It appears that the problem arises mainly from the PN calibration at low energies, although it is not clear whether the redistribution matrix or the effective area is deficient. This means that PN spectra tend to give less absorption column than MOS and RGS, a trend similar to what we find in this work (Table 2 and Table 3), as well as those obtained by Grupe et al. (2004). We thus argue that the values derived from MOS spectra are more reliable.
If the effect is purely due to an effective area problem of PN, we can test the PN–MOS consistency by taking into account the reported difference in the calibration. To simplify the treatment, we assumed that the PN effective area below 1 keV was under-estimated by a factor of , which is energy-dependent. was estimated from Fig. 10 in Kirsh et al. (2004), in which the MOS/RGS normalisation factors with respect to PN is plotted versus energies. We adopted conservative values of 1.4, 1.15, and 1.0. at any other energies within 0.3–1.0 keV was interpolated using a binomial function. We corrected the PN effective area (ARF) by multiplying by at the corresponding energy. The PN spectral fitting was repeated with is corrected ARF and the results are listed in Table 4. The fitted total is (11.1) , in excellent agreement with the MOS results, while remains unchanged. We therefore conclude that the fitted from the PN spectrum is likely to be under-estimated. More quantitative and reliable estimation of in PN spectra must await the completion of the PN and MOS calibration at the low energies (Kirsh et al. 2004).
| absorber | a | /dof | ||
|---|---|---|---|---|
| observation in June 2003 | ||||
| local | 11.10.8 | 1.540.03 | 137/147 | 0.70 |
| local | 4.59 (fix) | 1.290.02 | 218/148 | 1.4 |
| z=4.276 | 23128 | 134/147 | 0.77 | |
-
a
Column density of hydrogen in units of