Giant Radio Pulses from the Crab Pulsar
Abstract
Individual giant radio pulses (GRPs) from the Crab pulsar last only a few microseconds. However, during that time they rank among the brightest objects in the radio sky reaching peak flux densities of up to 1500 Jy even at high radio frequencies. Our observations show that GRPs can be found in all phases of ordinary radio emission including the two high frequency components (HFCs) visible only between 5 and 9 GHz (Moffett & Hankins, 1996). This leads us to believe that there is no difference in the emission mechanism of the main pulse (MP), inter pulse (IP) and HFCs. High resolution dynamic spectra from our recent observations of giant pulses with the Effelsberg telescope at a center frequency of 8.35 GHz show distinct spectral maxima within our observational bandwidth of 500 MHz for individual pulses. Their narrow band components appear to be brighter at higher frequencies (8.6 GHz) than at lower ones (8.1 GHz). Moreover, there is an evidence for spectral evolution within and between those structures. High frequency features occur earlier than low frequency ones. Strong plasma turbulence might be a feasible mechanism for the creation of the high energy densities of and brightness temperatures of .
1 Observational Techniques
Observations with the Effelsberg 100-m radio telescope began on 25 November 2003 and ended on 28 November 2003. We used a secondary focus cooled HEMT receiver with a center frequency of 8.35 GHz, providing two circularly polarized IF signals with a system temperature of 25 K on both channels. With a sky temperature of 8 K, and a contribution of 33 K from the Crab nebula, the effective system temperature was 70 K. Two detection systems were used. First, a polarimeter with 1.1 GHz bandwidth detected total power of the left-hand and right-hand circularly polarized signals (LHC and RHC respectively) as well as and . These four signals were then recorded by the standard Effelsberg Pulsar Observation System (EPOS). With the Crab pulsar’s dispersion measure of , we had an un–dedispersed time resolution of , while our sampling resolution was fixed at . EPOS was therefore set to continuously record data blocks containing 20 periods divided into 1020 phase bins for all four signals (Fig. 1).
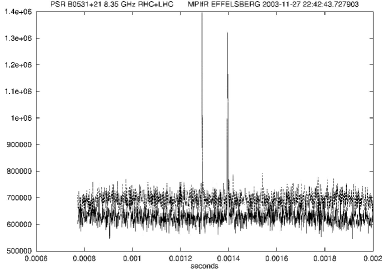
The minimum detectable flux per bin was . Considering the dispersion pulse broadening, the detection limit for a single GRP of duration would be . Selected GRPs are shown on Fig. 2.
A wide band ultra-high resolution detection system similar to the one of Hankins et al. (2003) was used as well. The two IF signals (100–600 MHz) carrying the LHC and RHC information were sampled and recorded with a fast digital storage oscilloscope (LeCroy LC584AL). samples per channel were recorded at the rate of samples per second. The storage scope was used in a single shot mode. We used giant radio pulses to trigger data acquisition by the digital storage scope. The RHC signal was detected, amplified and low-pass filtered (3 kHz), then passed to a second scope (Tektronics 744). The second scope triggered the digital scope whenever pulses stronger than 3–4 times rms (75–100 Jy) were detected. The recorded waveforms were then transferred to disk. This required manual intervention and led to a dead time of about 100 seconds after each pulse.
2 EPOS Data
About periods were observed with EPOS. Presented results are only based on a third of all observed rotations. This selection was mostly caused by an insufficient quality of the data. Because of the Crab pulsar’s weak signal at 8.35 GHz and the strong nebula background, ordinary single pulses were not observable with Effelsberg at that frequency. It takes about 20 min integration to assemble a mean profile at that frequency. The giant pulses come in short outbursts, about 5 to 20 minutes in duration, and appear extremely prominent during such burst phases.
In our subsequent analysis, we set a threshold level of 5 rms = 125 Jy on the sum of RHC and LHC for the same phase bin to count as a detection of a giant pulse. More than 1300 giant pulses were detected that way (Fig. 2) and their arrival phases were computed by using the TEMPO111http://pulsar.princeton.edu/tempo pulsar timing package. The data were aligned using the current Jodrell Bank timing model. They were found to be a perfect match to the time of arrivals (TOAs) obtained at Jodrell Bank before and after the Effelsberg observing session. Upper panel of Fig. 3 shows these phases. We found that the giant pulses occur at all those phases where the radio components of the Crab pulsar emission are observed (Fig. 3, bottom panel).
For all giant pulses, i.e. regardless of their phases, the histogram of their peak strengths at 8.35 GHz can be described by a power law with a slope (Fig. 4). This result is consistent with the results obtained by others (e.g. Lundgren et al., 1995). Moreover in Fig. 5 , we show the phase resolved distributions of four components: two high frequency components (HFC1 and HFC2), and the main and inter pulse components (MP and IP). Because of limited statistics we could make a model fit only for the IP component, where a power law index was found, and it is consistent with the value of presented by Cordes et al. (2004). So far, there is no evidence that the distributions for HFC1 and HFC2 differ from each other. However, their slopes seems to be steeper than the slope for the IP component.
The results obtained so far by us suggest that the physical conditions in the regions responsible for HFC emission might be similar to those in the main pulse (MP) and inter pulse (IP) emission regions. We plan to pursue this question further in the beginning of 2005, when a new observation campaign at two frequencies, 4.85 GHz and 8.35 GHz, of the GRPs of the Crab pulsar is scheduled.
3 High Resolution Detections
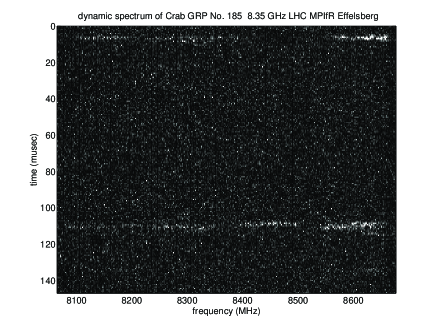
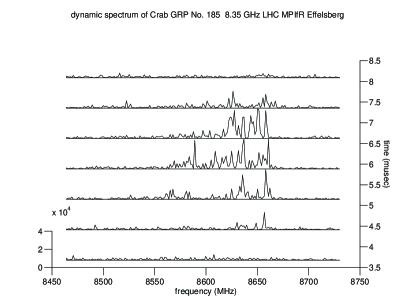
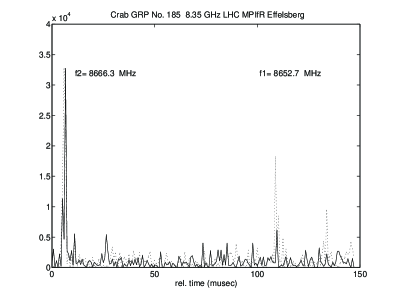
Because of the burst-like character of the giant pulse emission and the long dead-times in our data acquisition, only 150 pulses were observable with the high resolution equipment (for example Fig. 6). The peak strength varied from our threshold of 75 Jy to a few rare events which even exceeded 1000 Jy. We computed dynamic spectra for the LHC and RHC signals by successive Fourier transforms and squaring of the data. Baseline and sensitivity corrections were also applied through the use of bandpass averages. The pulses were typically 2–5 wide and certainly wider than the resolution of our incoherent software de-dispersion, . Hankins et al. (2003) showed the strong temporal variabilities within the giant pulses, which are possibly unresolved because of the limited bandwidth of the observations. Although giant pulses can be received over a wide bandwidth, the individual pulses do not have a uniform spectrum, as seen in Fig. 7. The strongest emission was predominantly detected in the upper quarter of the accessible bandwidth. The individual pulses consist of MHz-wide clusters of narrow MHz spectral lines waxing and waning with time (Fig. 7, upper). High frequency features appear earlier than low frequency features. Furthermore, if two giant pulses occur in rapid succession (Fig. 6, 7) separated by only , their spectra are similar though not identical. The maximum emission of the leading pulse occurs at higher frequencies than that of the trailing pulse (Fig. 6, bottom). The separation of spectral maxima also decreases in the trailing pulse. Intrinsic fluctuations of the emission process or - alternatively - scintillation could be the cause.
4 Characteristics of the Emission Mechanism
The maximum flux of = Jy is detected on a typical timescale of = . With the Crab’s distance of and accounting for bandwidth coverage ( = , = ) a peak luminosity of is obtained. The pulse duration limits the size of the emitting volume to and a rough estimate of the dissipated energy density yields . For our observations the brightness temperature is estimated to = applying the relation in accordance with Soglasnov et al. (2004). Such extreme brightness temperatures accompanied by strong polarization indicate a highly coherent radio emission process. We find that the GRPs occur at the same phases as the ordinary radio emission, perhaps dominating the radio profile at high frequencies. Such coincidence suggests that the GRPs are of the same origin as the radio emission at . At these emission heights, the interaction of relativistic particles with turbulent plasma wave packets in the pulsar magnetosphere represents a possible source process for the creation of GRPs (Hankins et al., 2003). Strong plasma turbulence is the highly non-linear dynamic equilibrium between density fluctuations and radiative plasma modes. The purely electrostatic two-stream instability parallel to the pulsar dipolar field serves as the trigger mechanism. In the pulsar magnetosphere, electron-positron pairs are created in events which are sharply localized in space and time. Each event creates an individual plasma shell. Different shell generations have different bulk speeds and can interpenetrate the magnetosphere on the way outwards (Jaroschek et al., 2004). In such colliding plasma shells, the plasma two-stream instability is excited, which evolves to a fully saturated equilibrium of turbulent plasma modes. Self-induced, strong density fluctuations in the high-energy beam are coupled to density fluctuations in the low-energy background population via radiation pressure. Such coupling leads to significant bunching of particles and thereby to coherent emission expected at a frequency of , where denotes the Lorentz factor in the frame of the slower plasma shell and is the plasma frequency of an intrinsically relativistic plasma.
The mechanism outlined above is attributed as collisionless Bremsstrahlung (Weatherall & Benford, 1991) and is identified in self-consistent 3D particle-in-cell (PIC) simulations (Jaroschek et al., 2004). In these simulations, coherent radiation emission stimulated by strong Langmuir turbulence is studied in slab geometry for similar conditions (particle densities corotation densities of and Lorentz factors of ). Turbulent energy densities reach up to with rise times and fluctuation timescales of a few nanoseconds. The emission of a fraction of this energy density is sufficient for the observed GRPs. The PIC simulations show that the emitted radiation has a Poynting flux with magnitude, temporal structure and linear polarization in good agreement with our observations. The radiation would last until the supply of high energy particles is exhausted.
Acknowledgments
We would like to thank Michael Kramer for the kind supply of ephemeris and TOAs from the Crab pulsar and H. Wiedenhöver and K. Grypstra for their help with the LeCroy Scope and analog signal processing. Aga Słowikowska was supported by grant KBN 2P03D.004.24. She would like to thank Bronek Rudak for his very bright suggestions. We are pleased to acknowledge two anonymous referees for their comments.
References
- Cordes et al. (2004) Cordes, J.M., Bhat, N.D.R., Hankins, T.H., McMaughlin, & Kern, J. The Brightest Pulses in the Universe: Multifrequency Observations of the Crab Pulsar’s Giant Pulses, Astrophys. J., 612, 375-388, 2004.
- Hankins et al. (2003) Hankins, T.H., Kern, J.S., Weatherall, J.C., Eilek, J.A. Nanosecond radio bursts from strong plasma turbulence in the Crab pulsar, Nature 422, L141-L143, 2003.
- Jaroschek et al. (2004) Jaroschek, C.H., Nodes, C., Schopper, R., Ruhl, H., Lesch, H. Ultra-relativistic Plasma Shell Collisions in Pulsar Magnetospheres and Gamma-ray Bursts. In ’High Performance Computing in Science and Engineering’, Munich 2004. Transactions of the Second Joint HLRB and KONWIHR Result and Reviewing Workshop, March 2nd and 3rd, 2004, Technical University of Munich, Springer-Verlag New-York Berlin Heidelberg, pp. 419-430, 2004.
- Lundgren et al. (1995) Lundgren, S.C., Cordes, J.M., Ulmer, M., Matz, S.M., Lomatch, S., Foster, R.S., Hankins, T. Giant Pulses from the Crab Pulsar: A Joint Radio and Gamma-Ray Study, Astrophys. J., 453, 433-445, 1995.
- Moffett & Hankins (1996) Moffett, D.A., & Hankins, T.H. Multifrequency radio observations of the Crab pulsar, Astrophys. J. 468, 779-783, 1996.
- Soglasnov et al. (2004) Soglasnov, V.A., et al. Giant pulses from PSR B1937+21 with widths nanoseconds and , the highest brightness temperature observed in the Universe, astro-ph/0408285, 2004.
- Weatherall & Benford (1991) Weatherall, J.C., & Benford, G. Coherent radiation from energetic electron streams via collisionless bremsstrahlung in strong plasma turbulence, Astrophys. J. 378, 543-549, 1991.